Listed in Singapore · Marine and offshore services
SGX: BEZ · Information cut-off 20 August 2026
Investor snapshot
Business model
Beng Kuang sells marine fabrication, repair and offshore-support work under project and service contracts.
Latest figures
In 1H2026 revenue rose 9.7% to S$55.712m, but gross margin fell to 26.2% from 38.2%; funded borrowings were S$26.312m and the ASOM acquisition carried about S$20m of contingent consideration.
Main risk
The central risk is that acquisition-linked obligations and project working capital absorb cash while the lower margin persists.
Next proof
The next test is whether the next results convert contracted work into operating cash and clarify the final acquisition funding burden.
Evidence balance
The live questionHow quickly does Beng Kuang's uncertified contract work convert into billings and cash while acquisition-linked obligations remain outstanding?In 1H2026 the group reported higher revenue but an operating cash outflow, so the pace of certification and collection now decides whether contracted work funds the acquisition claims already recognised.
What improved
Revenue rose 9.7% to S$55.712m in 1H2026, and a first-half intake of about S$85.2m was disclosed across the three main units (S$27.6m in 1Q, S$57.6m in 2Q), which carried about S$70.7m of work remaining.
What became more demanding
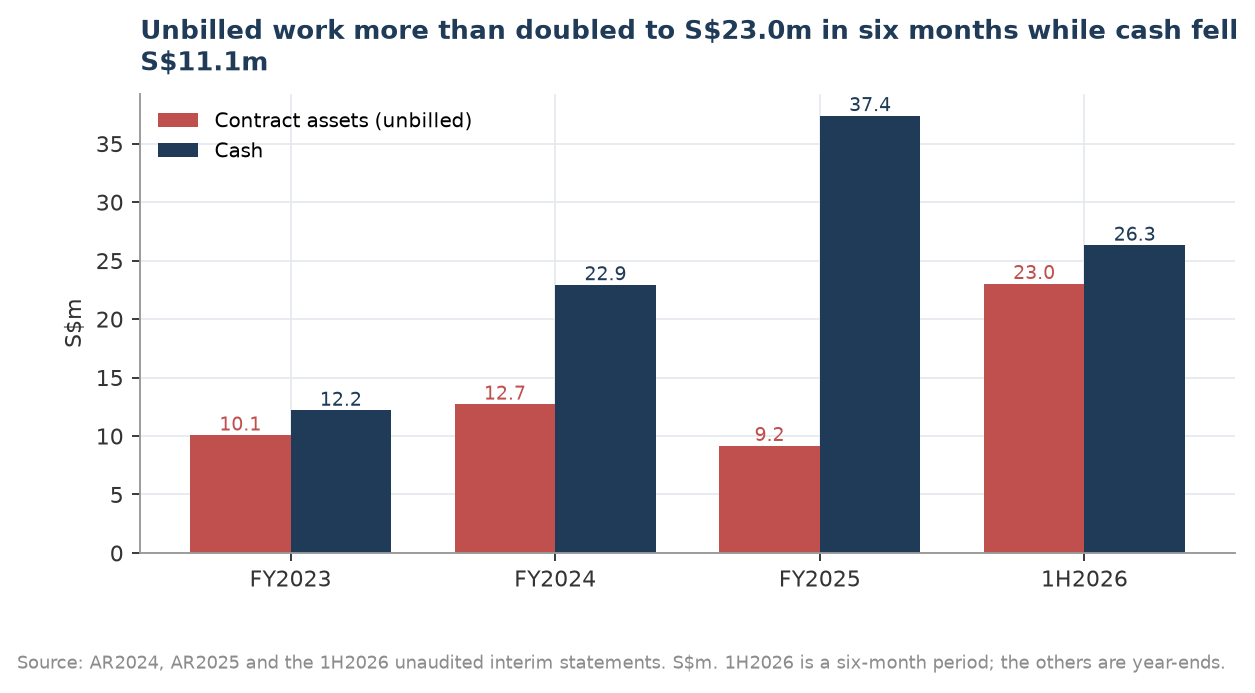
Gross margin fell to 26.2% from 38.2%, operating cash flow was negative S$8.648m as contract assets increased by S$13.852m to S$23.024m, funded borrowings were S$26.312m, and the acquisition left a recognised S$20m contingent-consideration balance that is a potential cash claim.
Strongest alternative explanation
The build in contract assets could simply reflect work performed but not yet certified: the company attributed the margin fall to early-stage shipbuilding and to West Africa lifecycle scopes starting only after a floatel was positioned in June, which would be consistent with timing rather than collectability.
The decisive missing fact
The filings do not answer how quickly S$23.0m of contract assets converts to certified billings and cash, which facilities survived at 30 June, or what ASOM entity-level profit after tax will be for the earn-out and when that cash is paid.
Drawn from the evidence on this page: the improvement, the constraint, the benign reading and the fact that would settle it. It states no view on the shares.
About the private research record
Also on file for this company, behind the rated view 🔒 (author-only): one current integrated equity-credit initiation PDF (the 7-page note) · the private rating and full written equity view with fair value and scenarios · the private indicative credit opinion · the 20-tab integrated workbook with forecast, valuation and credit schedules · the 15-slide presentation deck · the understanding sheet · the cross-vendor and red-team review artifacts. Kept private; not for distribution.
On this page
Business anatomy · operations, customers and cash
Marine capability is sold through fabrication, repair and offshore-service jobs
Steel, pipe, spares and technical labour feed two related service lanes that end with contracted work for shipowners and offshore operators.
Read each card by investor role: business line, operating step, customer outcome or cash conversion.
Customer needContract brief
A vessel or asset needs work
What happensA shipowner or offshore operator commissions fabrication, repair, maintenance or support around a marine asset.
Commercial triggerThe commercial starting point is a customer work order or project contract.
Business lineFabrication lane
Cut, weld and repair
What happensSteel, pipe, drawings and skilled labour become modules, structures or repaired equipment in the group’s facilities.
How it earnsProject revenue follows the contracted fabrication or repair work.
Business lineService lane
Supply offshore support
What happensMarine spares, equipment and operational capability support separate offshore-service assignments.
How it earnsService fees depend on the scope and duration of the contracted work.
Customer deliveryCustomer acceptance
Return the asset to work
What happensThe completed module, repaired equipment or support service is delivered back into the customer’s marine operation.
Revenue triggerShipowners and offshore-energy operators pay against milestones, delivery or service completion.
Original SMID Research comic. AI-assisted, analyst-directed monochrome artwork depicts the evidenced operating steps of Beng Kuang Marine; deterministic captions and dated mix figures state the economics using issuer disclosures available to 2026-08-20. The drawings are representative—not issuer artwork, an exact product or site design, a statement of scale, or a company forecast.
Investor translation
What matters after the operating picture
Four questions connect the business model to cash and balance-sheet risk. This is a factual reading aid, not a valuation or recommendation.
Value lever
Yard utilization, project margin and the mix of fabrication, repair and offshore-service work.
Cash bottleneck
Steel, labour and contract work are funded before milestones are certified and collected.
Balance-sheet pressure
Project cash and available facilities cannot cover current debt, bonding and completion costs.
Next proof
Backlog conversion, gross margin, contract-asset collection and operating cash.
Text version of this comic
Customer need · A vessel or asset needs work A shipowner or offshore operator commissions fabrication, repair, maintenance or support around a marine asset. Commercial trigger: The commercial starting point is a customer work order or project contract.
Business line · Cut, weld and repair Steel, pipe, drawings and skilled labour become modules, structures or repaired equipment in the group’s facilities. How it earns: Project revenue follows the contracted fabrication or repair work.
Business line · Supply offshore support Marine spares, equipment and operational capability support separate offshore-service assignments. How it earns: Service fees depend on the scope and duration of the contracted work.
Customer delivery · Return the asset to work The completed module, repaired equipment or support service is delivered back into the customer’s marine operation. Revenue trigger: Shipowners and offshore-energy operators pay against milestones, delivery or service completion.
Latest filing tape
A refreshed issuer-IR sweep found a director-interest filing dated 17 August 2026 that was absent from the prior local corpus. Chua Beng Yong bought 50,000 shares at S$0.455 on 13 August and 50,000 at S$0.450 on 14 August, taking his disclosed interest to 3.88% of 299,992,179 shares. The purchase is recorded here as a governance fact; no investment inference is made.
No later item was visible on the issuer newsroom through 20 August. The SGX rendered tape timed out during the independent check, so the no-newer-filing statement is verified only at issuer-IR level. Primary pages: issuer newsroom and 17 August disclosure.
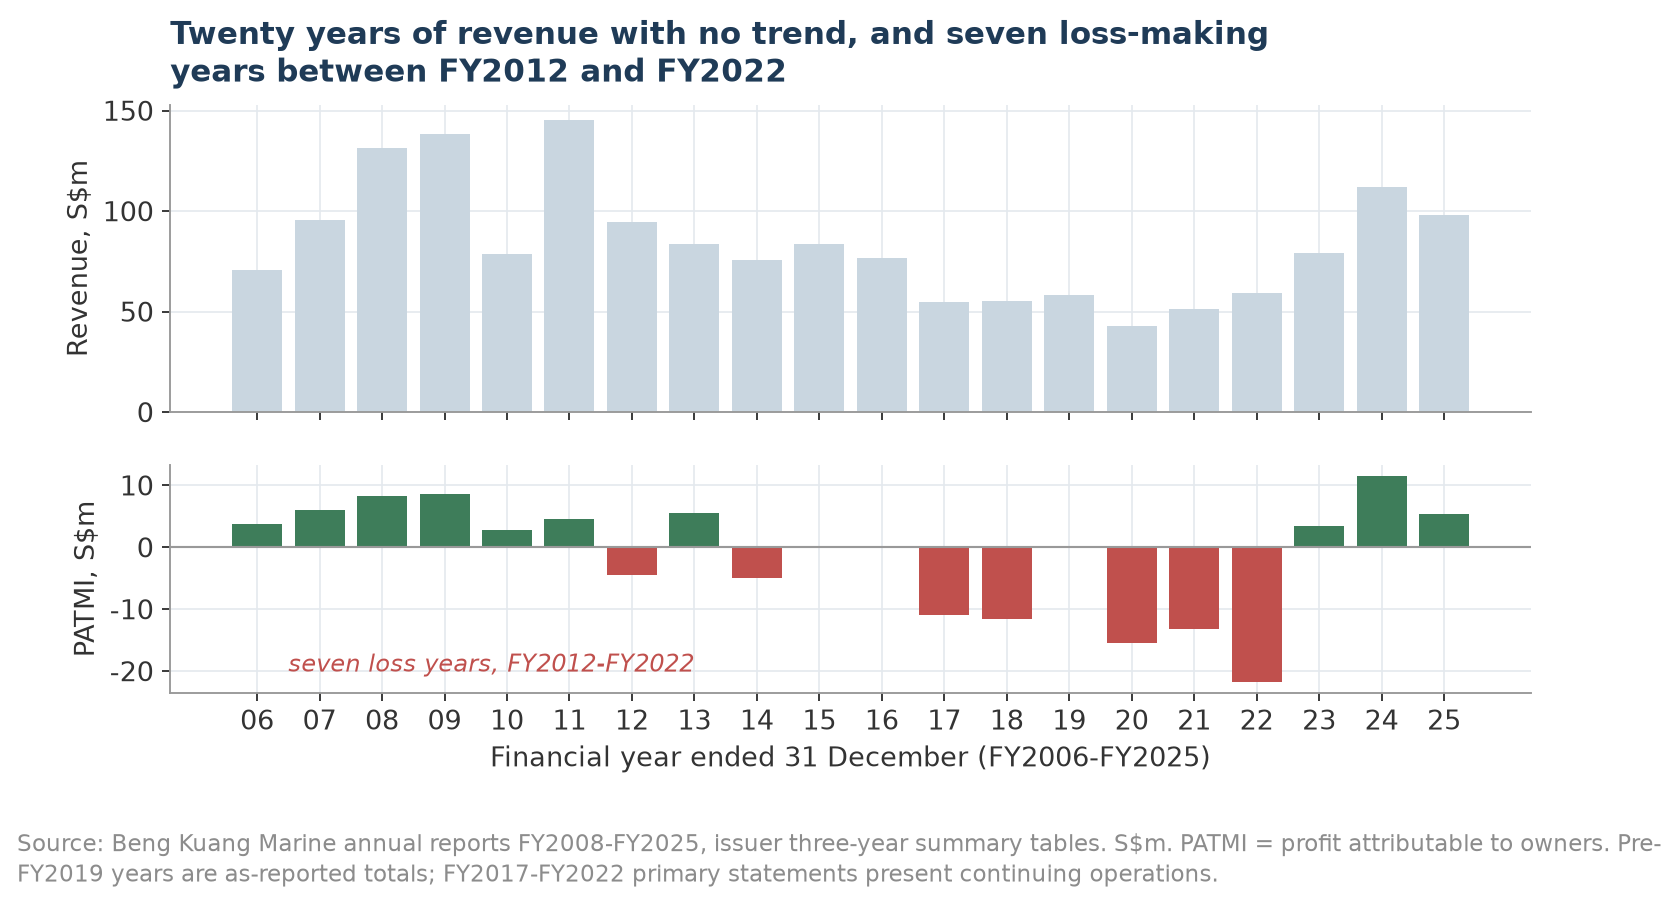
Twenty years in one picture
Revenue and profit attributable to ordinary shareholders from the complete annual-report run. Figures are as filed; later restatements are identified in the workbook.
The company spent much of FY2016–FY2022 near breakeven or loss-making before returning to profit. The recent recovery is concentrated in Infrastructure Engineering and in the ASOM operating perimeter.
The ASOM transaction changed ownership, not the revenue perimeter
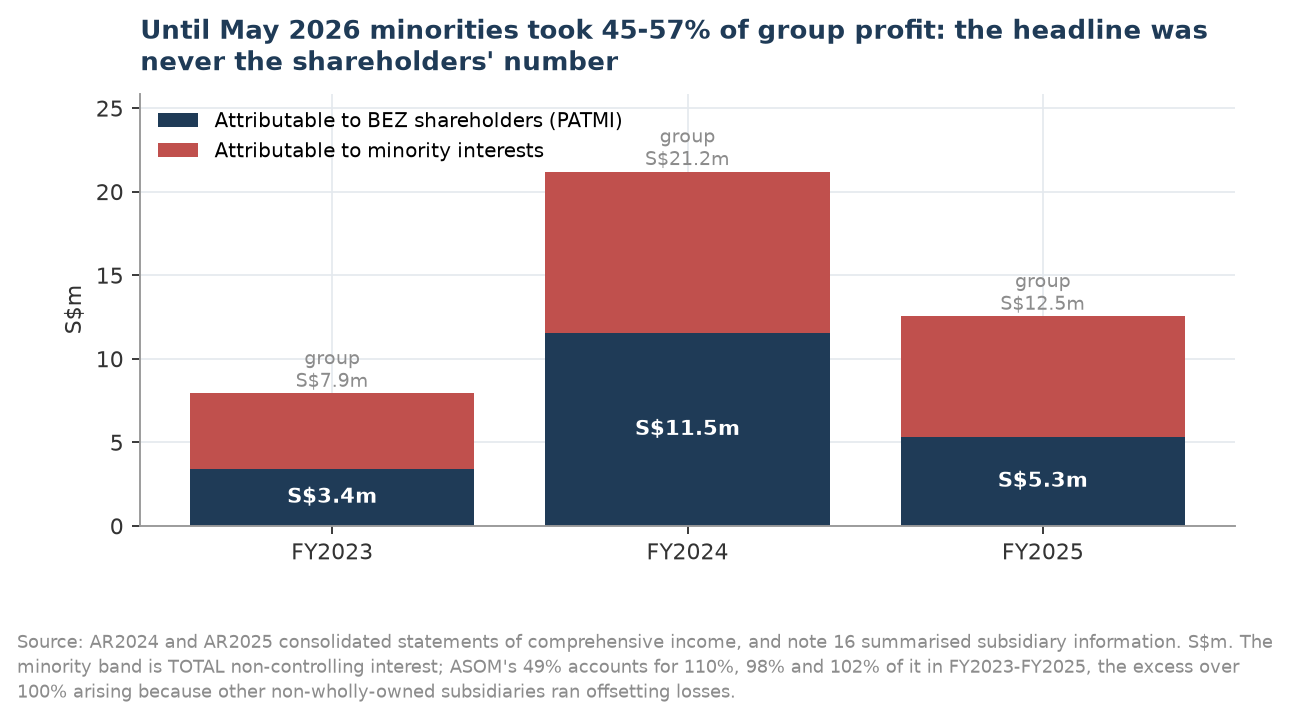
The remaining 49% of ASOM was acquired for up to S$60m: S$20m cash, S$20m of shares and up to S$20m of earn-out. ASOM was already controlled and consolidated, so the transaction primarily changes the split between ordinary shareholders and non-controlling interests. It does not add a new block of consolidated revenue.
ASOM transaction bridge
S$m
Public treatment
Consideration shares
20.000
57,142,856 shares issued at S$0.35
Cash at completion
20.000
Reported as acquisition-of-NCI financing outflow
Contingent cash consideration
Up to 20.000
S$10m current and S$10m non-current recognised at 30 June
Maximum consideration
60.000
Total claim stack
NCI carrying amount derecognised
14.359
Equity transaction because control already existed
Premium charged to parent equity
45.641
No acquired cash, debt or goodwill
FY2025 group profit was S$12.53m; S$5.33m reached ordinary shareholders and S$7.20m was attributed to NCI. Source: FY2025 annual report.
The final accounting treated the acquisition as an equity transaction under SFRS(I) 10 and charged a S$45.641m premium to reserves. This differed from the transaction documents' pro-forma goodwill presentation. Attributable book value after the transaction is therefore not comparable with the circular's pro-forma NAV.
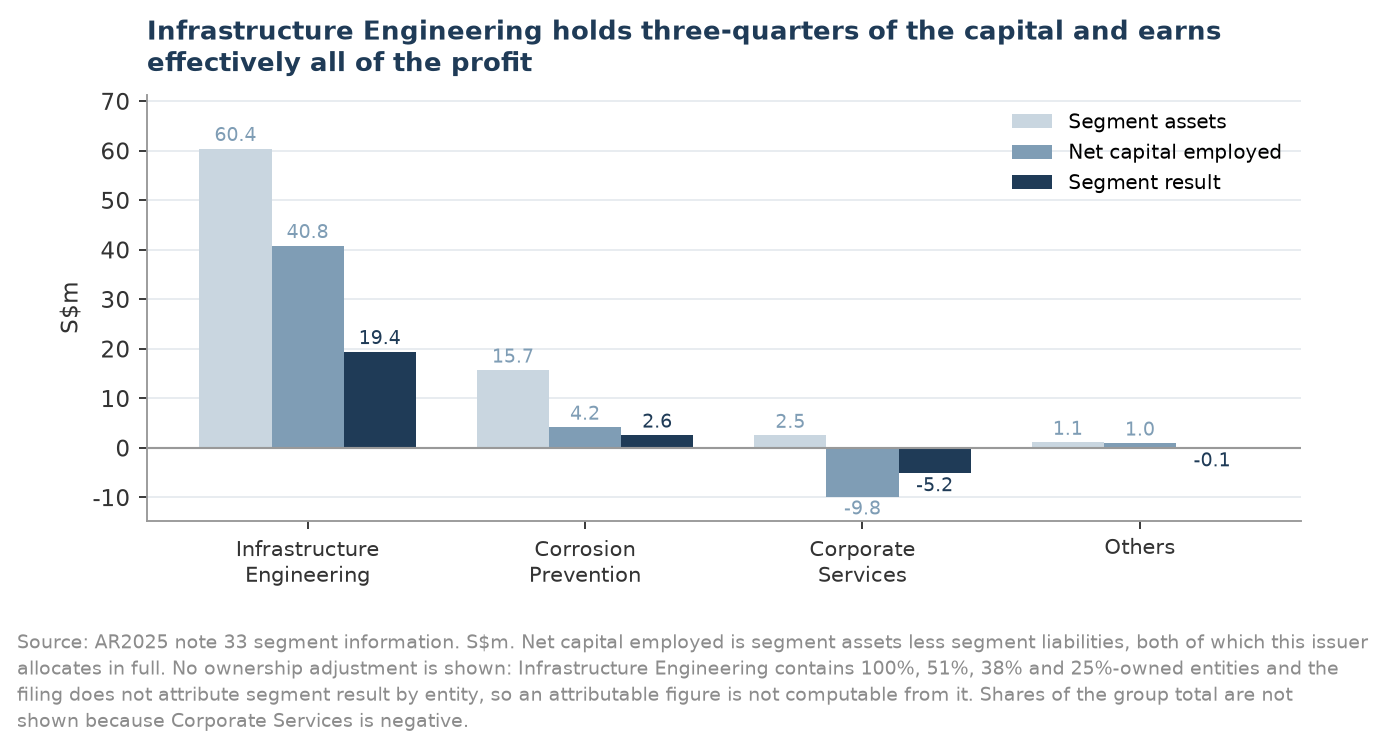
Reported segment economics — without an ownership shortcut
FY2025, S$m
Infrastructure Engineering
Corrosion Prevention
Corporate Services
Others
External revenue
78.5
19.6
—
0.0
Segment result
19.4
2.6
(5.2)
(0.1)
Segment margin
24.8%
13.1%
n.m.
n.m.
Segment assets
60.4
15.7
2.5
1.1
Net capital employed
40.8
4.2
(9.8)
1.0
Infrastructure Engineering is not identical to ASOM. The group structure places entities with 100%, 51%, 38% and 25% ownership, the Batam yard and deck-equipment activities inside the same segment. The filing does not disaggregate segment profit by entity, so an ownership-adjusted segment result is not computable.
Reported segment figures in absolute S$m. No entity-level ownership allocation is asserted.
1H2026: revenue growth, margin compression and cash absorption
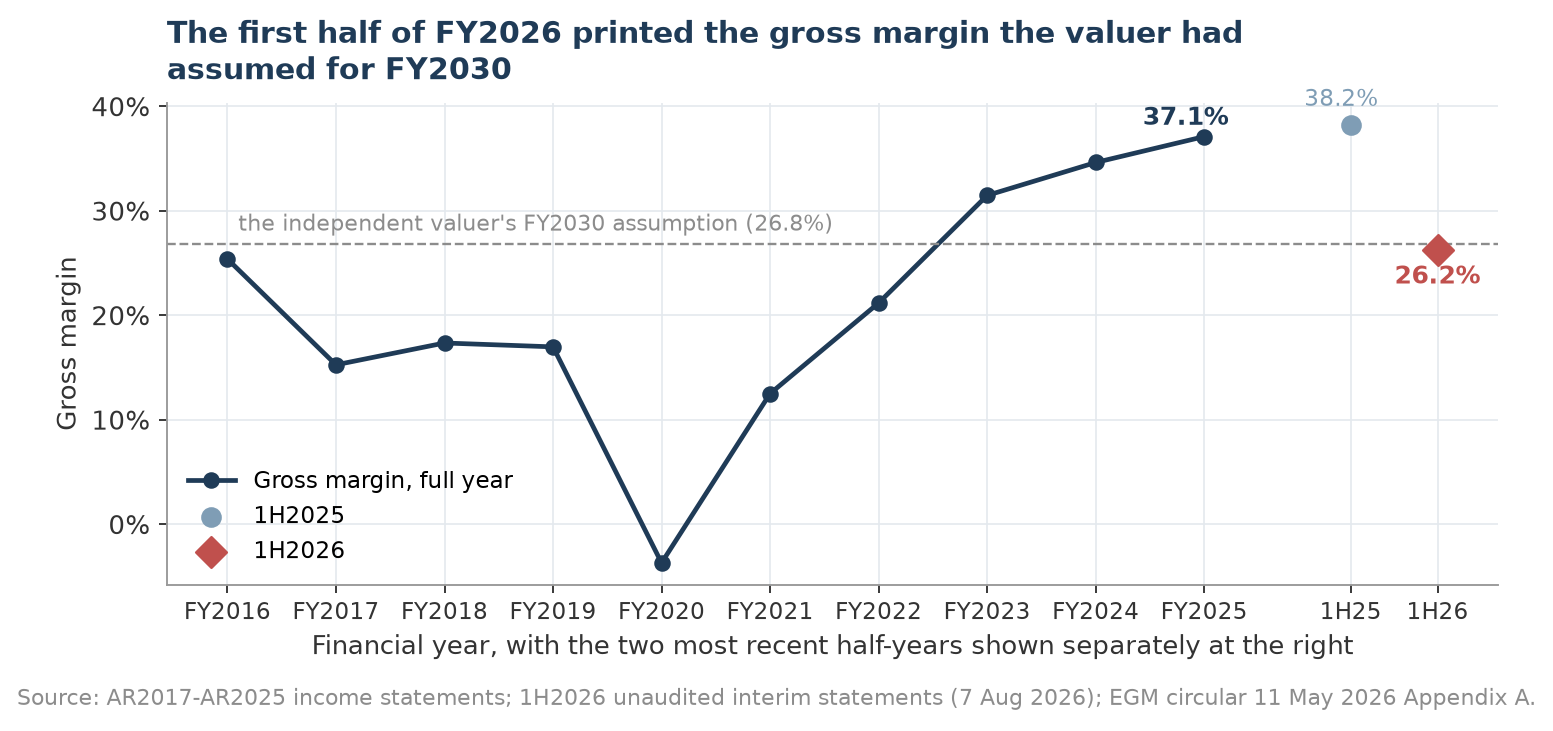
Revenue rose 9.7% to S$55.712m while gross margin fell from 38.2% to 26.2%. Management attributed the decline to project timing and execution mix and said higher-margin lifecycle work should strengthen progressively as mobilisation advanced. The filing did not quantify a future margin.
Gross margin history with 1H2025 and 1H2026 shown separately. Source: annual reports and 1H2026 interim.
Operating cash flow was negative S$8.648m. Contract assets increased by S$13.852m to S$23.024m while receivables absorbed S$3.375m and payables supplied S$2.493m. Contract assets were 22.3% of trailing revenue.
Work performed but not yet certified or billed against cash. Source: annual reports and 1H2026 interim.
Contracted work supports activity, but no group book-to-bill is disclosed
Contracted work remaining was S$70.7m at 30 June: S$52.3m at ASOM, S$7.3m at NEI and S$11.1m at IOE. Framework scopes may extend beyond FY2026 and some deliveries run into FY2028.
The S$85.2m first-half intake disclosure covers those three subsidiaries. Dividing it by group revenue and calling the result group book-to-bill mixes perimeters. The filings do not provide a complete group order-intake figure or customer-level execution cohort.
How concentrated the customer base is
Revenue from major customers, from note 33(c) of the FY2025 accounts and the equivalent note in each earlier annual report. The issuer discloses the aggregate, not the individual shares, so these are the only concentration figures it publishes. Dependence roughly doubled in three years — from 39.4% of revenue across two customers in FY2022 to 76.2% across four in FY2024 — and has stayed above 72% since. Four counterparties now account for close to three-quarters of what the group sells, and the accounts do not say who they are.
FY2022
FY2023
FY2024
FY2025
Revenue from major customers (S$m)
23.3
55.4
85.2
71.2
Group revenue (S$m)
59.1
79.2
111.9
98.2
Major customers as a share of revenue
39.4%
70.0%
76.2%
72.5%
Number of major customers, as disclosed
2
4 (later stated as 2)
4
4
One inconsistency is recorded rather than resolved. The FY2023 annual report says revenue came from 4 major customers that year; the FY2024 annual report, giving FY2023 as its comparative, says 2. Both state the same $55,395,143. The dollar figure is consistent across the two filings and the customer count is not, and nothing in either report explains the change.
Funding and covenant evidence
Funded borrowings were S$26.312m at 30 June. The acquisition also created a recognised S$20m contingent-consideration balance; it is non-interest-bearing and is not funded debt, but it is a potential cash claim.
The official 11 May 2026 announcement identifies an HSBC Singapore term-loan facility of up to S$15m to partially fund the S$20m cash consideration. It discloses transaction-linked protections tied to the SPA, continued 100% ownership of ASOM and material uncured SPA breach. It does not publish pricing, maturity, amortisation, security or a financial-covenant schedule.
1H2026 consolidated cash flows show S$17.997m of borrowing proceeds and S$3.390m of repayments. Those totals are not wholly transaction-attributable, so the public record supports the group cash bridge but not a conclusion on facility drawdown or covenant compliance.
AR2025 disclosed two small facilities with net-worth, leverage and gearing tests. At 30 June, the unadjusted public net-worth measure is below a disclosed S$28m threshold. That arithmetic does not establish a contractual breach because facility survival, borrower, contractual adjustments, test dates, waiver/cure rights and cross-default reach are not fully public. The public evidence establishes neither compliance nor breach.
Outstanding instruments comprised 39,776,260 warrants at S$0.22 and 720,000 options at S$0.342, alongside a scrip-dividend alternative.
The share price and what came with its moves
Over the window Beng Kuang Marine returned +499.6% on a dividend-adjusted basis; the Straits Times Index returned +80.0% and the median of the 2 listed comparisons +113.0%.
Click a quarter — on the chart or in the return strip under it — to read its filings beside its large moves.
Key: Beng Kuang Marine (BEZ) as a solid line; Straits Times Index rebased, dashed; peer median rebased, dotted; filing ticks above the axis; ex-dividend ticks on it; numbered pins are moves with a written note; plain dots are other detected moves.
Key moves
The five largest moves over a day or up to two weeks, with no day counted twice.
Each move is shown next to the market over the same days (and peers, where shown). News listed with a move was published within its dates; that does not mean the news caused the move. The quarter view has all the news.
Index: Straits Times Index. Peers: the average of two listed companies used as a sector check; the notes name them and their limits.
Q3 2023
22 Aug 2023 – 29 Sep 2023 (part quarter)
BEZ −16.0%STI +1.8%Peer median −2.1%Range S$0.06–S$0.07Close S$0.06
Q4 2023
2 Oct 2023 – 29 Dec 2023
BEZ +1.6%STI +0.7%Peer median +7.5%Range S$0.05–S$0.06Close S$0.06
The parcel is 30.7% of the 328,956 sqm Batam waterfront yard; with the 90,000 sqm first parcel (S$8.64m, approved July 2023) the group would sell 58.05% of the site and keep 137,986 sqm. The company said the yard had been underutilised since 2014 and was used only for berthing and cold-stacking, and that up to S$5.0m of net proceeds would repay bank borrowings and the S$3.5m bonds maturing 5 November 2024. On 5 October the company had reported the full 12% deposit of S$1,036,800 on the first parcel and an extension of that sale's condition-precedent date to 31 December 2023.
Next session (16 Oct): BEZ −3.2% · STI −0.7% · peers −1.5%
Gross margin reached 30.1% for the nine months, which the company attributed to cost-minimisation and productivity measures and to the exit of loss-making units; 3Q2023 revenue was S$21.40m against S$14.82m a year earlier. Profit before tax was S$4.16m. Operating cash inflow was S$6.64m; cash was S$6.60m and borrowings S$15.95m at 30 September 2023. The order book was S$24.4m at 30 June 2023, S$8.8m of it FPSO/FSO repair and maintenance. The filing was made under Rule 1313(2) because the company had been on the SGX watch-list since 6 June 2023.
Next session (10 Nov): BEZ +3.5% · STI −0.9% · peers −1.6%
With both parcels sold the group retains 137,986 sqm of the Batam yard, about one-third of the original site. The tugboat balance of S$463,205 was received on 19 January 2024.
Next session (25 Jan): BEZ −4.3% · STI −0.2% · peers −0.5%
Gross margin rose to 31.5% from 21.2% and gross profit doubled (up 98.9%) to S$24.91m. Infrastructure Engineering revenue rose 47.0% to S$57.02m (72.0% of the group) on FPSO and FSO contracting and maintenance, and 2H2023 IE revenue rose 85.9% to S$36.31m; Corrosion Prevention rose 9.0% to S$22.09m. Administrative expenses rose 19.7% to S$16.05m on headcount. Net profit included a S$6.26m gain on the first completed Batam parcel. Operating cash inflow was S$5.95m; cash rose 81.6% to S$12.19m and borrowings fell 36.3% to S$14.14m, turning net current liabilities of S$12.37m into net current assets of S$1.33m. ASOM's order book was S$30m at 31 December 2023. No dividend, as the company said it was still deleveraging.
Guidance: The group 'expects to sustain its business momentum under the restructured IE division', tempered by geopolitical and global economic uncertainty.Same session: BEZ −3.7% · STI −0.4% · peers −0.4%
Large price moves
38 Jan 2024 · +21% · index 0% · peers −1%
4week to 12 Jan 2024 · +19% · index 0% · peers +4%
Q2 2024
1 Apr 2024 – 28 Jun 2024
BEZ +173.3%STI +3.4%Peer median +36.9%Range S$0.11–S$0.27Close S$0.23
Gross margin was 34.2% and gross profit rose 208.0% to S$9.79m; IE revenue was S$23.61m against S$8.35m a year earlier and CP S$5.02m. Excluding the land gain the company put profit before tax at S$5.49m. EBITDA was S$12.26m. Cash was S$14.11m and borrowings S$9.14m at 31 March 2024. The company also named a 'BKM 2.0' programme and the appointment of an acting CEO for the CP division and a CEO for the crane unit IOE.
Next session (3 May): BEZ −2.2% · STI −0.1% · peers −0.7%
Large price moves
51 Apr 2024 · +23% · index 0% · peers +7%
6week to 5 Apr 2024 · +49% · index 0% · peers +13%
78 Apr 2024 · +21% · index 0% · peers +4%
811 Apr 2024 · +14% · index 0% · peers 0%
9week to 12 Apr 2024 · +48% · index 0% · peers +11%
10week to 21 Jun 2024 · +20% · index 0% · peers +8%
1125 Jun 2024 · +18% · index 0% · peers +3%
Q3 2024
1 Jul 2024 – 30 Sep 2024
BEZ +14.9%STI +7.6%Peer median −5.0%Range S$0.20–S$0.32Close S$0.27
IE revenue rose 141.7% to S$50.11m (83.6% of the group) on FPSO and FSO asset-integrity work and crane supply; CP fell 11.5% to S$9.81m after the exit from the bottled-water distribution business. Gross margin rose from 26.3%. Administrative expenses rose 71.7% to S$11.03m on hiring and bonus provisions. Net profit included a S$5.53m gain on the second Batam parcel (S$5.51m in the financial statements); rental income from the retained yard was S$0.82m. Operating cash inflow was S$5.96m; cash S$19.29m and borrowings S$8.57m at 30 June 2024; net assets S$23.55m. No interim dividend. A bonus warrant issue was announced the same morning (next entry).
Guidance: The group 'expects to maintain its business performance, given the stable industry outlook for oil, gas and marine sector'.Same session: BEZ −2.0% · STI −4.1% · peers −5.8%
The exercise price was a 12.4% discount to the S$0.251 VWAP and 10.2% below the S$0.245 close of 2 August 2024. Shares went ex-warrants on 27 August; 59,763,110 warrants were listed on 4 September 2024, exercisable from six months after listing until 3 September 2027. The company said proceeds on exercise would fund expansion and new ventures.
The affected data were described as back-end working files; the provider reported to the PDPC, CSA and police. The company said it was relying on backups and that there was no evidence of data theft.
Next session (20 Aug): BEZ +2.2% · STI +0.4% · peers +2.8%
Large price moves
128 Jul 2024 · +15% · index 0% · peers 0%
1326 Jul 2024 · +14% · index 0% · peers +4%
14week to 26 Jul 2024 · +26% · index −1% · peers +1%
156 Aug 2024 · −13% · index −1% · peers −1%
1615 Aug 2024 · +14% · index +1% · peers 0%
1712 Sep 2024 · +20% · index +1% · peers +11%
Q4 2024
1 Oct 2024 – 31 Dec 2024
BEZ −16.7%STI +5.6%Peer median −13.9%Range S$0.20–S$0.28Close S$0.23
The new bonds pay 9.0% semi-annually, mature around 5 November 2027 and were offered to existing bondholders by set-off. On 5 November 2024 the company confirmed the old bonds redeemed in full and S$3.0m of 2027 bonds issued.
Next session (22 Oct): BEZ +0.0% · STI −0.8% · peers −0.2%
Gross margin was 35.4% (35.7% a year earlier). The company said a customer's accommodation barge was dry-docked in Africa in July 2024, interrupting FPSO work, with redeployment from late September. Nine-month profit before tax was S$20.83m including the S$5.51m land gain; operating cash inflow S$7.41m. Cash was S$18.56m against borrowings of S$9.17m (computed from current S$8.26m and non-current S$0.91m) at 30 September 2024, a net cash position the company contrasted with 135.8% net gearing a year earlier.
Next session (13 Nov): BEZ +2.2% · STI +0.2% · peers −1.8%
Large price moves
183 Dec 2024 · +10% · index +1% · peers +1%
1927 Dec 2024 · +10% · index 0% · peers −1%
Q1 2025
2 Jan 2025 – 28 Mar 2025
BEZ −8.9%STI +4.9%Peer median −10.9%Range S$0.20–S$0.27Close S$0.20
Gross margin rose to 34.6% from 31.5% and gross profit 55.5% to S$38.73m. IE revenue rose 60.3% to S$91.43m (81.7% of the group); CP fell 7.4% to S$20.44m. The second half was slower: 2H2024 revenue rose 9.8% to S$51.96m with gross margin of 33.6% after two months of downtime on an FPSO job while an accommodation barge was dry-docked. Administrative expenses rose 25.3% to S$20.66m on salaries and incentive accruals. Net profit included the S$5.51m Batam gain. Operating cash inflow was S$13.47m; cash S$22.92m, borrowings S$8.24m, equity S$28.47m at 31 December 2024. A scrip dividend scheme was adopted the same evening. Released 19 February at 18:18 and re-filed unchanged on 20 February.
Guidance: The group 'expects to maintain its business momentum given the stable oil and gas sector as well as marine industry outlooks', tempered by geopolitical risk.Next session (20 Feb): BEZ −7.7% · STI −0.2% · peers −2.6%
Gross margin rose to 36.4% and gross profit fell 11.3% to S$8.69m; the comparison included the S$5.83m land gain a year earlier, without which the company put 1Q2024 profit before tax at S$5.49m. The company cited logistical and administrative delays in one African market, deck-equipment contracts starting only from 2Q2025 and lower CP work timing. Operating cash inflow was S$3.89m. Separately, 51%-owned IOE won a contract to supply five 30-tonne knuckle-boom cranes to an Indian customer for about US$4.94m (S$6.48m), for delivery from May 2025 to January 2029.
Guidance: The CEO said the group was 'seeing a healthy pipeline of projects supporting FPSO operations' and the deck headlined 'momentum to pick up from 2Q2025'.Next session (8 May): BEZ +1.1% · STI −0.4% · peers −1.6%
Record date 9 May 2025, paid 27 June 2025. Scrip shares were priced at a 4.81% discount to the VWAP of 8-9 May; 2,990,402 new shares were issued to electing holders, taking issued shares to 207,240,473.
Large price moves
237 Apr 2025 · −12% · index −8% · peers −18%
Q3 2025
1 Jul 2025 – 30 Sep 2025
BEZ +84.8%STI +8.5%Peer median +37.5%Range S$0.18–S$0.39Close S$0.34
Gross margin rose to 38.2% from 35.5% while gross profit fell 8.6% to S$19.42m. IE revenue was S$41.17m (81.1% of the group) with delays in Africa and Guyana; CP was S$9.59m, with Singapore FPSO-module and offshore-wind work offsetting Batam projects reaching their tail end. Other gains fell to nil from S$7.26m (which had included the S$5.51m land gain) and a S$1.19m foreign-exchange loss from the weaker US dollar replaced a S$0.63m gain. Administrative expenses fell 8.5% to S$10.02m. Operating cash inflow was S$10.01m; cash S$25.13m, borrowings S$8.03m (computed from current S$3.28m and non-current S$4.75m), equity S$33.08m at 30 June 2025. Deck-equipment contracts of S$6.95m had been secured. No interim dividend.
Guidance: The group 'expects to maintain its business momentum' in 2H2025 on a stable oil-and-gas outlook, tempered by geopolitical tensions.Next session (7 Aug): BEZ −5.9% · STI +0.7% · peers +0.4%
OneHub Tank Coating was transferred to MTM for S$10,000 and renamed CCW; CCW will issue S$50,000 of shares to Mr Chew See Choon and S$100,000 to ASES. CCW will offer chemical cleaning and hot-oil flushing for FPSO pre-commissioning and maintenance.
Large price moves
242 Jul 2025 · +13% · index +1% · peers +2%
25week to 4 Jul 2025 · +14% · index +1% · peers +1%
268 Jul 2025 · +7% · index 0% · peers +2%
2725 Jul 2025 · +6% · index 0% · peers +3%
282 Sep 2025 · +13% · index +1% · peers 0%
29week to 5 Sep 2025 · +18% · index +1% · peers 0%
Q4 2025
1 Oct 2025 – 31 Dec 2025
BEZ −5.9%STI +8.0%Peer median +62.5%Range S$0.27–S$0.37Close S$0.32
The S$22.1m includes the US$4.94m (S$6.2m) crane contract of May 2025. The company said the contracts give revenue visibility through their duration and reflect a revival of its deck-equipment and shipbuilding activities.
Next session (7 Nov): BEZ −3.2% · STI +0.2% · peers −1.3%
Gross margin was 36.0% (35.4%) and 9M2025 gross margin 37.5%; nine-month profit before tax was S$13.58m against S$15.32m excluding the prior-year land gain, EBITDA S$16.75m and nine-month operating cash inflow S$11.94m. Order books at 31 October 2025 were S$14.3m for deck equipment and S$7.8m for shipbuilding. The S$3.0m 9% bonds due 2027 were redeemed early on 4 November 2025.
Next session (7 Nov): BEZ −3.2% · STI +0.2% · peers −1.3%
Large price moves
3030 Dec 2025 · +7% · index +1% · peers +2%
Q1 2026
2 Jan 2026 – 31 Mar 2026
BEZ +18.8%STI +5.1%Peer median −15.2%Range S$0.28–S$0.42Close S$0.38
Gross margin rose to 37.1% from 34.6% and gross profit fell 6.0% to S$36.41m. The company attributed the revenue fall to timing delays on offshore asset-integrity projects after customers revised scope and sequencing, saying the work scope 'remains intact'; 2H2025 revenue fell 8.8% to S$47.37m. CP fell 4.0% to S$19.63m. Other income fell to S$1.36m from S$8.61m on the absence of the S$5.51m land gain and a S$0.91m foreign-exchange loss; administrative expenses fell 1.4% to S$20.71m. Operating cash inflow was S$26.55m; equity rose 26.9% to S$36.14m (12.64 cents a share) and the corporate bonds were fully redeemed. New deck-equipment contracts of S$14.2m and shipbuilding contracts of S$7.8m were secured in the year. The group had served 23 FPSOs and one FSO.
Guidance: The company pointed to an ageing FPSO fleet and a steady project pipeline through the late 2020s, and said it had shifted towards shorter-term contracts with 'more predictable margins'.Next session (13 Feb): BEZ −1.8% · STI −1.6% · peers −0.2%
ASOM, the FPSO asset-integrity subsidiary, reported FY2025 revenue of S$75.2m and profit after tax of S$14.9m (FY2024: S$86.3m and S$19.3m); the S$60m prices it at about eight times FY2025 earnings. The 57,142,857 consideration shares are priced at a 12.8% premium to the S$0.3104 VWAP of 23 February; the earn-out needs ASOM profit of S$15m in each of FY2026 and FY2027. Pro forma FY2025 EPS would rise from 2.61 to 4.80 cents; NTA per share would fall from 12.64 cents to a negative 0.67 cents as the S$48.2m premium is not carried as goodwill. The placement of 15,625,000 shares at a 3.09% premium to VWAP, for working capital, was completed on 10 March 2026. Trading was halted from 24 February until these announcements.
Next session (27 Feb): BEZ +9.4% · STI +0.6% · peers +0.6%
The shareholders' agreement followed on 16 April 2026; the barge contract is part of NEI's S$15.8m shipbuilding order book and becomes a related-party transaction. The JV is equity-accounted.
The earn-out pays S$10m a year if ASOM's audited profit reaches S$15m in FY2026 and FY2027, scaled down above S$5m, with a catch-up if the two years together exceed S$30m. The vendors' consideration shares are under moratorium with a tag-along right. A clarification on 23 March corrected the pro forma EPS after the deal to 4.53 cents (from a misstated 1.93 cents). ASOM's FY2023-FY2025 revenue was S$50.6m, S$86.3m and S$75.2m, with net assets of S$32.6m at end-2025.
Next session (20 Mar): BEZ +1.2% · STI −0.4% · peers −2.4%
Large price moves
3123 Feb 2026 · +7% · index +1% · peers +2%
3227 Feb 2026 · +9% · index +1% · peers +1%
332 Mar 2026 · +7% · index −2% · peers +3%
3418 Mar 2026 · +8% · index +1% · peers +1%
3523 Mar 2026 · −9% · index −2% · peers −4%
Q2 2026
1 Apr 2026 – 30 Jun 2026
BEZ +26.6%STI +5.8%Peer median +8.0%Range S$0.39–S$0.60Close S$0.47
NEI's shipbuilding order book was S$15.8m across four Batam projects and IOE's S$12.5m (S$7.8m for FY2026, S$4.7m into FY2027-FY2028). ASOM's US dollar orders (US$18.2m) were translated at 1.30; West Africa lifecycle renewals were excluded pending purchase orders. The record date for the FY2025 dividend (12 June 2026) was announced the same evening.
Next session (16 Apr): BEZ +3.3% · STI −0.3% · peers +0.2%
Gross profit fell 21.5% to S$6.8m and net profit 12.7% to S$2.8m; the company attributed the margin fall to a higher share of early-stage shipbuilding and other work that earns less than FPSO services, not to weaker demand. CP revenue fell 9.1% to S$3.09m. Administrative costs were 13% lower than a year earlier. The company reiterated S$51.2m of FY2026 revenue secured and that the ASOM EGM would be held in May 2026.
Next session (6 May): BEZ −3.5% · STI +0.1% · peers +0.4%
Buyers named by the company included Amova Asset Management, Tokio Marine Life Insurance Singapore and Mr Tan Kim Seng; executive chairman Chua Beng Yong and CEO Yong Jiunn Run bought 578,286 and 500,000 shares, taking their stakes to 4.92% and 5.30%. Mr Chua Meng Hua is stepping back from his executive role. The press release was broadcast at 12:26 during the session; the interest notices followed after the close.
Next session (7 May): BEZ +3.6% · STI +0.3% · peers +2.2%
The circular states ASOM's net cash of about S$32.0m at end-2025 before a permitted pre-completion dividend to the vendors, and plant and equipment of only S$0.3m. The HSBC facility letter of 28 April 2026 requires the company to keep 100% of ASOM and becomes repayable if the SPA is terminated. The EGM was set for 26 May 2026.
The largest single allotment was 6,044,500 shares on 25 May 2026. Issued shares rose from 208,999,673 on 4 March to 242,534,698 before the ASOM consideration shares; 39,860,560 warrants remained outstanding on 23 June 2026 and 39,776,260 on 4 August 2026, exercisable until 3 September 2027. The 1H2026 cash-flow statement shows S$3.99m received from warrant exercises.
Shareholders approved the purchase at the EGM of 26 May 2026. Issued shares rose from 242,534,698 to 299,677,554. The up-to-S$20m earn-out remains outstanding.
Next session (29 May): BEZ +1.9% · STI +1.0% · peers −0.7%
The tank-services orders formalise the West Africa renewals excluded from the April order book. The company said the awards convert 'previously deferred' programmes into secured contracts and that the underlying demand was intact.
Next session (5 Jun): BEZ +1.0% · STI −0.3% · peers −1.1%
Approved at the AGM of 15 April 2026; record date 12 June 2026, paid on or about 19 June 2026. The ex-date is taken as the market day before the record date.
Large price moves
368 Apr 2026 · +11% · index +1% · peers +3%
375 May 2026 · +11% · index 0% · peers −1%
38week to 8 May 2026 · +20% · index 0% · peers +3%
Q3 2026
1 Jul 2026 – 21 Aug 2026 (part quarter)
BEZ −9.5%STI +10.0%Peer median +0.2%Range S$0.43–S$0.54Close S$0.43
The remaining work was ASOM S$52.3m, NEI S$7.3m and IOE S$11.1m; NEI's order book had fallen from S$15.8m at 31 March as projects were executed. The company said the update was not a forecast of results and that ASOM's framework scopes may run beyond FY2026.
Next session (8 Jul): BEZ +0.0% · STI +0.5% · peers −1.2%
Gross profit fell to S$14.60m from S$19.42m, which the company attributed to a higher share of early-stage shipbuilding, engineering and deck-equipment work and to West Africa lifecycle scopes starting only after a floatel was positioned in June; IE segment profit fell to S$7.73m. Attributable profit included S$1.43m of gains on a Batam land parcel and equipment and a smaller minority share after the ASOM purchase. Contract assets rose S$13.85m to S$23.02m, driving the operating outflow. Cash fell to S$26.30m, total borrowings rose to S$26.31m from S$10.50m (computed from the balance sheet), S$20m of contingent consideration sits in payables, and total net assets were S$4.72m, while equity attributable to owners was S$11.16m (3.72 cents a share, based on 299,907,879 shares) and negative non-controlling interests were S$6.44m, after the S$45.6m premium over ASOM's minority book value was charged to equity. No interim dividend.
Guidance: 'Barring unforeseen circumstances', revenue and margins are 'expected to strengthen progressively through 2H2026' on S$70.7m of contracted work, with a second offshore campaign to mobilise in 3Q2026; management's stated priority is converting contract assets into billings and cash.Next session (11 Aug): BEZ −3.1% · STI +1.0% · peers −1.2%
Large price moves
3910 Jul 2026 · +9% · index +1% · peers +2%
Notes and sources
Share price record
How this section was built
The detector flagged 39 large moves in the window — 31 single sessions and 8 weekly windows — before any news was read. 2 sector moves; 37 are left over after both controls, unexplained by them. Of those, 4 followed a filing by timestamp, 3 coincided with one in the same session or week and 30 have nothing filed against them beyond routine notices and are recorded as unexplained rather than explained away.
This section records the 36-month price history and puts every large move through two subtractions and reports what is left over, not what caused it: first the Straits Times Index, then the median of the 2 listed comparisons — Marco Polo Marine and Mermaid Maritime — which trade the same session. “Left over” is what survives both controls.
Each quarter panel pairs two records. Key developments are the filings that carry information — results and quarterly updates, the Batam land sales, the ASOM transaction, contract progress, board and dividend events — with the figures as filed, the guidance given, the close on the day and how the reacting session traded against the controls; a filing after the 09:00 open is read against the next session. Large price moves are the threshold-detected sessions, detected before any news was read and dispositioned from the controls and the enumerated tape; rows with a written note carry a numbered pin, the rest are dots on the line.
How to read the tags.Market-wide and Sector-wide mean the index or the peer median moved with the share over the same session or week; Residual means the move is still large after both are subtracted. A residual is what is left over, not a cause: it does not establish that the company’s own news moved the price, and an unchanged or thinly traded price is not proof that no information arrived. Returns use the dividend-adjusted close; a filing released after the open is read against the next session.
Prices are Yahoo Finance daily closes for BEZ.SI (pulled 18 August 2026; returns on the dividend-adjusted series) against the Straits Times Index, and the announcement tape is the SGX announcements API (company filter) retrieved 23 August 2026 with SGX broadcast times, covering 22 August 2023 to 21 August 2026. A filing after the open is read against the next session.
Limitations bound every row above. The tape is the 175 items Beng Kuang broadcast on SGXNet between 22 August 2023 and 21 August 2026, with SGX broadcast times; the register is selected from that tape, and the attachments were read from the SGX landing pages where the pack did not already hold them. Broker notes, block trades and the timing of substantial-shareholder dealings, trade press and index reviews were not examined. The pack's entity-tape register lists one consolidated subsidiary of note, Asian Sealand Offshore and Marine (ASOM, 51%-owned until 28 May 2026, wholly owned since), which has no disclosure stream of its own, so everything about it comes through the parent's filings; the register also records that its own rendered SGX tape was gapped for 18-20 August 2026, whereas the API tape used here runs to 21 August and its last item is dated 17 August 2026. The peer control is two stocks, Marco Polo Marine (5LY) and Mermaid Maritime (DU4), and their session returns often diverge widely (for the week to 12 April 2024 the map records +3.0% against +19.5%), so the peer median is a weak sector control. Of the 39 threshold moves in the pack's map, 33 are mechanically "unexplained": most of the 2024 re-rating ran on days with no material filing in the prior three sessions.
A quarter shows only the columns it has. An empty developments column means: No filings beyond routine disclosures this quarter. An empty moves column means: No session cleared the large-move threshold this quarter.
The full move register — every large move and its market and sector controls
Every threshold-detected move in the window with its controls, dispositioned in the price-driver register; rows with a written note carry a numbered pin on the chart.
#
Session
BEZ
STI
Peers
Left over
Control result
What the evidence supports
1
18 Dec 2023
+8.8%
−0.1%
+1.1%
+7.7%
Residual
Against an index move of −0.1% and a peer median of +1.1%, about 8 points are left over; 6.0× median volume. No filing beyond routine notices in the prior three sessions. MarcoPolo +0.0 · Mermaid +2.2
2
29 Dec 2023
+6.7%
+0.8%
+2.1%
+4.6%
Residual
Against an index move of +0.8% and a peer median of +2.1%, about 5 points are left over; 1.9× median volume. No filing beyond routine notices in the prior three sessions. MarcoPolo +2.0 · Mermaid +2.2
3
8 Jan 2024
+20.9%
+0.1%
−0.5%
+21.4%
Residual
The first session of the 2024 re-rating: +20.9% on 16.7m shares, 13.5× median volume, after +4.7% the session before. The index rose 0.1%, Marco Polo Marine fell 2.0% and Mermaid Maritime rose 1.1%, so the whole move survives both controls. The only filing in the prior three sessions was the CEO's purchase of 300,000 shares for S$20,400 on 5 January, filed after that day's close; the completion of the second Batam land sale had been announced on 21 December, eleven sessions earlier. The shares reached S$0.086 on 10 January and were back at S$0.066 by 22 January, below the 5 January close. MarcoPolo −2.0 · Mermaid +1.1
4
week to 12 Jan 2024
+19.4%
+0.2%
+4.2%
+15.2%
Residual
Weekly window, 2024-01-05 to 2024-01-12: against an index move of +0.2% and a peer median of +4.2%, about 15 points are left over. No filing beyond routine notices inside the window. MarcoPolo +0.0 · Mermaid +8.4
5
1 Apr 2024
+23.3%
+0.3%
+6.7%
+16.6%
Residual
The session that opened the April 2024 run: +23.3% on 20.4m shares, 16.4× median volume, after three rising sessions that had added 11.7%. The index rose 0.3%; Mermaid Maritime rose 8.4% and Marco Polo Marine 5.0% the same day, so the peer median takes seven points and about 17 survive both controls. Nothing was filed in the three prior sessions, and the two appointments announced on 1 April (an acting CEO for the CP division and a chief operating officer) were broadcast at 17:35, after the close. The next session added 12.3% on 45.0m shares, the heaviest of the 36 months. MarcoPolo +5.0 · Mermaid +8.4
6
week to 5 Apr 2024
+48.8%
−0.2%
+13.3%
+35.5%
Residual
The first of two consecutive weeks of roughly +50%, from S$0.086 to S$0.128, with +23.3% on 1 April and +12.3% on 2 April, the latter on 45.0m shares, the heaviest session of the 36 months. The index fell 0.2%; Mermaid Maritime rose 15.0% and Marco Polo Marine 11.7% over the same week, so the peer median takes 13 points and about 35 survive both controls. The week included two filings, both after the close: the 2 April notice that the audited FY2023 accounts reclassify S$1.80m of operating cash flow (net profit of S$7.92m unchanged) and the 3 April circular proposing a new constitution; the two divisional appointments filed on 1 April were broadcast after that session's 23.3% rise. Nothing filed in the week or the three sessions before it carries a new figure: the FY2023 results had been out since 27 February and the 1Q2024 update did not come until 2 May. MarcoPolo +11.7 · Mermaid +15.0
7
8 Apr 2024
+21.1%
−0.1%
+4.1%
+17.0%
Residual
A +21.1% session on 25.8m shares, 20.8× median volume, after the −3.0% of 5 April. The index was flat; Mermaid Maritime rose 9.8% and Marco Polo Marine fell 1.5%, so the peer median takes four points and about 17 survive both controls. The two filings in the prior three sessions both came after the close and carry no new figure: the 2 April cash-flow reclassification in the audited FY2023 accounts (net profit S$7.92m unchanged) and the 3 April circular for a new constitution. The move continued, +7.7% on 9 April and +13.8% on 11 April. MarcoPolo −1.5 · Mermaid +9.8
8
11 Apr 2024
+13.8%
−0.3%
−0.0%
+13.8%
Residual
Against an index move of −0.3% and a peer median of −0.0%, about 14 points are left over; 21.3× median volume. Followed the filing “Annual General Meeting :: Voluntary”, released 9 Apr 2024, 17:23. MarcoPolo −1.5 · Mermaid +1.5
9
week to 12 Apr 2024
+47.7%
−0.0%
+11.2%
+36.4%
Residual
The second of two consecutive weeks in which the shares rose by about half, from S$0.128 to S$0.189, with +21.1% on 8 April and +13.8% on 11 April on 20.8× and 21.3× median volume. The index was flat; Mermaid Maritime rose 19.5% and Marco Polo Marine 3.0% over the same week, so the peer median takes 11 points and about 36 survive both controls. The week included two filings, the notice of AGM and the FY2023 annual report, both released after the close on 9 April; neither carries a figure that was not already in the results filed on 27 February. The shares held near S$0.19 until 17 April, fell 7.4% on 18 April and were at S$0.162 by 8 May, about a quarter of the two weeks' gain given back. MarcoPolo +3.0 · Mermaid +19.5
10
week to 21 Jun 2024
+20.1%
+0.3%
+7.7%
+12.4%
Residual
Weekly window, 2024-06-14 to 2024-06-21: against an index move of +0.3% and a peer median of +7.7%, about 12 points are left over. No filing beyond routine notices inside the window. MarcoPolo +1.6 · Mermaid +13.8
11
25 Jun 2024
+18.2%
+0.4%
+3.3%
+14.9%
Residual
Against an index move of +0.4% and a peer median of +3.3%, about 15 points are left over; 4.3× median volume. No filing beyond routine notices in the prior three sessions. MarcoPolo +1.6 · Mermaid +5.0
12
8 Jul 2024
+14.6%
−0.2%
+0.3%
+14.2%
Residual
Against an index move of −0.2% and a peer median of +0.3%, about 14 points are left over; 7.2× median volume. No filing beyond routine notices in the prior three sessions. MarcoPolo −1.5 · Mermaid +2.2
13
26 Jul 2024
+13.5%
−0.1%
+3.8%
+9.6%
Residual
Against an index move of −0.1% and a peer median of +3.8%, about 10 points are left over; 5.8× median volume. No filing beyond routine notices in the prior three sessions. MarcoPolo +3.5 · Mermaid +4.1
14
week to 26 Jul 2024
+25.5%
−0.6%
+1.4%
+24.1%
Residual
A week that began from a −9.6% session on 19 July and recovered it twice over: +10.4% on 23 July and +13.5% on 26 July, the latter on 5.8× median volume. The index fell 0.6% and neither peer moved more than 1.7%, so about 24 points survive both controls. The tape is silent: no filing of any kind between the 6 June substantial-shareholder notice and the 1H2024 results of 5 August. The gain did not hold; the shares fell in five of the next seven sessions and closed at S$0.21 on 6 August, below where the week began. MarcoPolo +1.7 · Mermaid +1.1
15
6 Aug 2024
−12.5%
−1.4%
−0.9%
−11.6%
Residual
The second session after the 1H2024 results and the bonus-warrant issue, both filed before the open on 5 August (07:30 and 08:19): revenue up 88.1% to S$59.92m and net profit of S$14.38m including a S$5.53m gain on the second Batam parcel, no interim dividend, and three warrants for every ten shares exercisable at S$0.22. The 5 August session was the global sell-off, with the index down 4.1% and the peers down 5.4% and 6.2%, and the shares fell 2.0%; on 6 August the index fell 1.4%, Marco Polo Marine 1.9% and Mermaid Maritime was unchanged, and the shares fell 12.5% on 7.5× median volume to S$0.21, below the warrant exercise price. About 12 points survive both controls. The CEO bought 200,000 shares at about S$0.205 that day, filed after the close. The fall was recovered on 15 August, +14.3% to S$0.24. MarcoPolo −1.9 · Mermaid +0.0
16
15 Aug 2024
+14.3%
+0.9%
−0.4%
+14.7%
Residual
Against an index move of +0.9% and a peer median of −0.4%, about 15 points are left over; 3.8× median volume. No filing beyond routine notices in the prior three sessions. MarcoPolo +2.0 · Mermaid −2.8
17
12 Sep 2024
+19.5%
+0.7%
+11.1%
+8.4%
Residual
Against an index move of +0.7% and a peer median of +11.1%, about 8 points are left over; 3.9× median volume. No filing beyond routine notices in the prior three sessions. MarcoPolo +0.0 · Mermaid +22.2
18
3 Dec 2024
+9.5%
+0.9%
+0.6%
+9.0%
Residual
Against an index move of +0.9% and a peer median of +0.6%, about 9 points are left over; 1.9× median volume. No filing beyond routine notices in the prior three sessions. MarcoPolo −1.9 · Mermaid +3.0
19
27 Dec 2024
+9.5%
+0.3%
−1.1%
+10.6%
Residual
Against an index move of +0.3% and a peer median of −1.1%, about 11 points are left over; 1.9× median volume. No filing beyond routine notices in the prior three sessions. MarcoPolo +0.0 · Mermaid −2.2
20
21 Jan 2025
+8.7%
−0.3%
−0.7%
+9.4%
Residual
Against an index move of −0.3% and a peer median of −0.7%, about 9 points are left over; 2.4× median volume. No filing beyond routine notices in the prior three sessions. MarcoPolo −3.6 · Mermaid +2.2
21
20 Feb 2025
−7.7%
−0.2%
−2.5%
−5.1%
Residual
Against an index move of −0.2% and a peer median of −2.5%, about 5 points are left over; 7.8× median volume. Followed the filing “General Announcement :: FY2024 Press Release”, released 19 Feb 2025, 18:19. MarcoPolo −1.9 · Mermaid −3.2
22
25 Feb 2025
−8.5%
−0.3%
−1.4%
−7.1%
Residual
Against an index move of −0.3% and a peer median of −1.4%, about 7 points are left over; 1.5× median volume. No filing beyond routine notices in the prior three sessions. MarcoPolo +0.0 · Mermaid −2.8
23
7 Apr 2025
−11.9%
−7.5%
−17.7%
+5.8%
Residual
Against an index move of −7.5% and a peer median of −17.7%, about 6 points are left over; 0.6× median volume. No filing beyond routine notices in the prior three sessions. MarcoPolo −20.0 · Mermaid −15.5
24
2 Jul 2025
+12.6%
+0.5%
+1.5%
+11.1%
Residual
Against an index move of +0.5% and a peer median of +1.5%, about 11 points are left over; 3.7× median volume. No filing beyond routine notices in the prior three sessions. MarcoPolo +2.2 · Mermaid +0.9
25
week to 4 Jul 2025
+14.3%
+1.2%
+1.3%
+12.9%
Residual
Weekly window, 2025-06-27 to 2025-07-04: against an index move of +1.2% and a peer median of +1.3%, about 13 points are left over. No filing beyond routine notices inside the window. MarcoPolo +4.4 · Mermaid −1.8
26
8 Jul 2025
+7.1%
+0.4%
+2.4%
+4.7%
Residual
Against an index move of +0.4% and a peer median of +2.4%, about 5 points are left over; 3.9× median volume. No filing beyond routine notices in the prior three sessions. MarcoPolo +2.2 · Mermaid +2.7
27
25 Jul 2025
+6.2%
−0.3%
+2.6%
+3.6%
Sector-wide
Tracked the sector: against an index move of −0.3% and a peer median of +2.6%, about 4 points are left over. MarcoPolo +5.3 · Mermaid +0.0
28
2 Sep 2025
+13.1%
+0.5%
+0.3%
+12.8%
Residual
Against an index move of +0.5% and a peer median of +0.3%, about 13 points are left over; 3.6× median volume. No filing beyond routine notices in the prior three sessions. MarcoPolo −2.9 · Mermaid +3.4
29
week to 5 Sep 2025
+18.3%
+0.9%
−0.1%
+18.5%
Residual
The week ran +13.1% on 2 September (3.6× median volume) and +4.3% on 4 September, ending on its heaviest session, 11.4m shares on 5 September, and followed three rising sessions from 27 August: S$0.27 to S$0.355 in eight sessions. The index rose 0.9% and the peers split, Marco Polo Marine −2.8% and Mermaid Maritime +2.5%, so the peer median takes nothing and about 18 points survive both controls. The only filing inside the window was the 1 September promotion of an assistant general manager; the 1H2025 results (revenue down 15.2%, net profit down 52.2%) had been filed on 6 August and the IE restructuring on 20 August, both outside it. The gain held: the shares were S$0.345 on 15 September and S$0.385 on 22 September. MarcoPolo −2.8 · Mermaid +2.5
30
30 Dec 2025
+6.8%
+0.5%
+1.9%
+4.9%
Residual
Against an index move of +0.5% and a peer median of +1.9%, about 5 points are left over; 0.8× median volume. No filing beyond routine notices in the prior three sessions. MarcoPolo +0.6 · Mermaid +3.2
31
23 Feb 2026
+6.7%
+0.5%
+1.6%
+5.0%
Residual
Against an index move of +0.5% and a peer median of +1.6%, about 5 points are left over; 1.7× median volume. No filing beyond routine notices in the prior three sessions. MarcoPolo +2.5 · Mermaid +0.8
32
27 Feb 2026
+9.4%
+0.6%
+0.6%
+8.8%
Residual
The first session after a three-day trading halt (24 to 26 February) that ended with two filings at 19:43 and 19:45 on 26 February: a term sheet to buy the 49% of ASOM the company did not own for S$60m, S$20m in shares at S$0.35, S$20m in cash and up to S$20m of earn-out, against ASOM's FY2025 profit after tax of S$14.9m; and a S$5.0m placement of 15,625,000 shares at S$0.32. The shares rose 9.4% to S$0.35, the consideration-share price, on 5.1× median volume; the index rose 0.6% and the peer median 0.6% (Marco Polo Marine +2.0%, Mermaid Maritime −0.8%), so about nine points followed the filings. The move continued: +7.1% on 2 March against a 2.1% fall in the index, and S$0.40 by 5 March, 25% above the pre-halt close. MarcoPolo +2.0 · Mermaid −0.8
33
2 Mar 2026
+7.1%
−2.1%
+3.1%
+4.0%
Sector-wide
Tracked the sector: against an index move of −2.1% and a peer median of +3.1%, about 4 points are left over. MarcoPolo +3.9 · Mermaid +2.4
34
18 Mar 2026
+7.7%
+1.3%
+0.7%
+7.0%
Residual
Against an index move of +1.3% and a peer median of +0.7%, about 7 points are left over; 3.9× median volume. No filing beyond routine notices in the prior three sessions. MarcoPolo +0.7 · Mermaid +0.8
35
23 Mar 2026
−8.5%
−2.2%
−3.9%
−4.6%
Residual
Against an index move of −2.2% and a peer median of −3.9%, about 5 points are left over; 1.0× median volume. No filing beyond routine notices in the prior three sessions. MarcoPolo −5.4 · Mermaid −2.5
36
8 Apr 2026
+11.4%
+0.8%
+3.4%
+8.0%
Residual
Against an index move of +0.8% and a peer median of +3.4%, about 8 points are left over; 4.0× median volume. No filing beyond routine notices in the prior three sessions. MarcoPolo +4.3 · Mermaid +2.6
37
5 May 2026
+10.7%
−0.1%
−1.3%
+12.0%
Residual
Against an index move of −0.1% and a peer median of −1.3%, about 12 points are left over; 13.0× median volume. No filing beyond routine notices in the prior three sessions. MarcoPolo −1.8 · Mermaid −0.8
38
week to 8 May 2026
+19.6%
+0.2%
+2.8%
+16.8%
Residual
The week's gain came on 4 and 5 May, +6.2% and +10.7% on 11.6m and 16.1m shares (the latter 13.0× median volume). The week included three filings: the 1Q2026 business update at 17:23 on 5 May, after the second of those sessions had closed (revenue up 7.7% to S$25.7m, profit before tax down 28.1% to S$3.0m on a gross margin of 26.5%); the press release broadcast at 12:26 on 6 May that founder and executive director Chua Meng Hua had sold his entire 4.26% stake of 9,978,286 shares to institutions and private investors, at about S$0.48 a share on the interest notice; and a warrant allotment that evening. The index rose 0.2% and the peer median 2.8% (Marco Polo Marine +6.4%), so about 17 points survive both controls. 6 May was the week's heaviest session, 19.4m shares, and closed 3.5% lower; the rise on 4 and 5 May preceded both filings. The shares reached S$0.60 on 14 May, the 36-month high, and fell 6.7% the next session. MarcoPolo +6.4 · Mermaid −0.8
39
10 Jul 2026
+8.6%
+0.7%
+1.6%
+7.0%
Residual
Against an index move of +0.7% and a peer median of +1.6%, about 7 points are left over; 1.6× median volume. No filing beyond routine notices in the prior three sessions. MarcoPolo +2.3 · Mermaid +1.0
Key developments: sources, timing and notes
13 Oct 2023 · Circular for the second Batam land sale: 100,970 sqm for S$9,895,060 (S$98 per sqm), a S$5.21m excess over the S$4.68m book value, plus the Drako Gallant tugboat for S$967,000.Corporate actionReaction (next session, 16 Oct): BEZ −3.2% · STI −0.7% · peers −1.5% · 0.8× median volumeSource: EGM circular, 13 Oct 2023 · First-parcel deposit update, 5 Oct 2023
9 Nov 2023 · 9M2023 update: revenue up 21.4% to S$53.25m and gross profit up 115.8% to S$16.03m; net profit S$2.73m from continuing operations.Business updateReaction (next session, 10 Nov): BEZ +3.5% · STI −0.9% · peers −1.6% · 1.5× median volumeSource: Rule 1313(2) quarterly update, 9 Nov 2023 · 3Q & 9M2023 corporate highlights, 9 Nov 2023
21 Dec 2023 · Second Batam land sale completed: the remaining S$8.9m of the S$9.9m consideration received in cash on 20 December 2023.Corporate actionReaction (same session): BEZ −1.7% · STI +0.1% · peers −2.0% · 0.5× median volumeSource: SGX announcement, 21 Dec 2023 (released 07:42, before the open)
24 Jan 2024 · First Batam land sale completed: the remaining S$7.6m of the S$8.64m consideration received; the Drako Gallant tugboat sale (S$967,000) completed five days earlier.Corporate actionReaction (next session, 25 Jan): BEZ −4.3% · STI −0.2% · peers −0.5% · 8.0× median volumeSource: Completion of 90,000 sqm disposal, 24 Jan 2024 · Completion of tugboat disposal, 19 Jan 2024
27 Feb 2024 · FY2023 results: revenue up 33.9% to S$79.16m and a net profit of S$7.92m against a S$23.67m loss in FY2022 (including discontinued operations); profit attributable to shareholders S$3.42m.ResultsReaction (same session): BEZ −3.7% · STI −0.4% · peers −0.4% · 2.8× median volumeSource: SGX announcement, 27 Feb 2024 (released 07:15, before the open) · FY2023 press release, 27 Feb 2024
2 Apr 2024 · Audited FY2023 accounts reclassify the cash-flow statement: operating cash inflow restated to S$4.15m from the S$5.95m announced.AnnouncementSource: Rule 704(6) variance announcement, 2 Apr 2024
2 May 2024 · 1Q2024 update: revenue up 113.1% to S$28.63m and profit before tax of S$11.32m, more than the whole of FY2023, helped by a S$5.83m gain on the second Batam parcel.Business updateReaction (next session, 3 May): BEZ −2.2% · STI −0.1% · peers −0.7% · 5.4× median volumeSource: Rule 1313(2) quarterly update, 2 May 2024 · 1Q2024 corporate highlights, 2 May 2024
19 Aug 2024 · Cybersecurity incident: an external IT provider's servers holding group data were hit by ransomware; the company reported 'marginal impact' on operations.AnnouncementReaction (next session, 20 Aug): BEZ +2.2% · STI +0.4% · peers +2.8% · 0.6× median volumeSource: SGX announcement, 19 Aug 2024
14 Oct 2024 · Removed from the SGX watch-list with effect from 15 October 2024, 16 months after being placed on it on 6 June 2023.AnnouncementReaction (next session, 15 Oct): BEZ +2.0% · STI −0.0% · peers +0.3% · 0.9× median volumeSource: SGX announcement, 14 Oct 2024
21 Oct 2024 · Redemption of the S$3.5m bonds due 5 November 2024, refinanced with an offer of up to S$3.5m of 9.0% bonds due 2027; S$3.0m was taken up.Corporate actionReaction (next session, 22 Oct): BEZ +0.0% · STI −0.8% · peers −0.2% · 0.7× median volumeSource: Proposed bonds redemption and offer, 21 Oct 2024 · Completion, 5 Nov 2024
12 Nov 2024 · 3Q2024 update: revenue up 25.1% to S$26.77m and profit before tax up 27.2% to S$3.79m; nine-month revenue up 62.8% to S$86.69m.Business updateReaction (next session, 13 Nov): BEZ +2.2% · STI +0.2% · peers −1.8% · 0.6× median volumeSource: 3Q2024 & 9M2024 corporate highlights, 12 Nov 2024
7 May 2025 · 1Q2025 update: revenue down 16.6% to S$23.89m and profit before tax down 63.1% to S$4.18m on FPSO project delays in Africa; a US$4.94m crane contract announced the same evening.Business updateReaction (next session, 8 May): BEZ +1.1% · STI −0.4% · peers −1.6% · 2.6× median volumeSource: 1Q2025 corporate highlights, 7 May 2025 · IOE cranes contract, 7 May 2025
20 Aug 2025 · IE division restructured: 51%-owned MTM Engineering renamed Asian Sealand Energy Services as the onshore EPC platform, and a chemical-cleaning start-up, Clean Concept Works, formed with an industry veteran.Corporate actionSource: Internal restructuring and new business (with press release), 20 Aug 2025
6 Nov 2025 · New projects worth about S$15.9m: S$8.1m of deck equipment and S$7.8m of shipbuilding, taking contracts awarded in 2025 to about S$22.1m.AnnouncementReaction (next session, 7 Nov): BEZ −3.2% · STI +0.2% · peers −1.3% · 1.5× median volumeSource: Press release, 6 Nov 2025
6 Mar 2026 · 50:50 joint venture with Epsilon Navigation, Offshore Collective, capitalised at S$1.4m to own and charter marine assets; its first asset is a S$2.8m ballast barge built at Batam.Corporate actionSource: SGX announcement, 6 Mar 2026 · Shareholders' agreement, 21 Apr 2026
19 Mar 2026 · Sale and purchase agreement signed for the 49% of ASOM on the term-sheet terms; the S$60m is a major transaction needing an EGM and will be funded by shares, internal cash and bank debt.Corporate actionReaction (next session, 20 Mar): BEZ +1.2% · STI −0.4% · peers −2.4% · 2.9× median volumeSource: SGX announcement, 19 Mar 2026 · Clarification, 23 Mar 2026
15 Apr 2026 · First contract update: confirmed order book of about S$55.9m at 31 March 2026, with about S$51.2m phased into FY2026 revenue; ASOM holds S$27.6m across 19 FPSOs and FSOs.AnnouncementReaction (next session, 16 Apr): BEZ +3.3% · STI −0.3% · peers +0.2% · 4.8× median volumeSource: SGX announcement, 15 Apr 2026 (released 21:25, after the close)
5 May 2026 · 1Q2026 update: revenue up 7.7% to S$25.7m but gross margin down 9.9 points to 26.5% and profit before tax down 28.1% to S$3.0m on a shift towards shipbuilding.Business updateReaction (next session, 6 May): BEZ −3.5% · STI +0.1% · peers +0.4% · 11.4× median volumeSource: SGX announcement, 5 May 2026 (released 17:23, after the close)
11 May 2026 · EGM circular for the ASOM purchase: independent valuer AVA puts 100% of ASOM at about S$195.3m (13.1 times FY2025 profit) against the S$122m implied by the S$60m price; HSBC provides a S$15m term loan for the cash leg.Corporate actionReaction (same session): BEZ −0.9% · STI +0.4% · peers −0.9% · 2.1× median volumeSource: SGX announcement, 11 May 2026 (released 07:30, before the open) · Term loan facility, 11 May 2026
28 May 2026 · ASOM becomes wholly owned: 57,142,856 shares issued at S$0.35 to the two vendors (9.5% each of the enlarged capital) and the S$20m cash paid on 29 May 2026.Corporate actionReaction (next session, 29 May): BEZ +1.9% · STI +1.0% · peers −0.7% · 1.1× median volumeSource: Transfer of sale shares and allotment, 28 May 2026 · Completion, 29 May 2026
4 Jun 2026 · Two FPSO life-extension purchase orders in West Africa worth about US$28.6m (US$13.2m and US$15.4m), to be executed over twelve months.AnnouncementReaction (next session, 5 Jun): BEZ +1.0% · STI −0.3% · peers −1.1% · 0.8× median volumeSource: SGX announcement, 4 Jun 2026
7 Jul 2026 · Contract progress to 30 June 2026: ASOM booked about S$85.2m of new orders in 1H2026 (S$27.6m in 1Q, S$57.6m in 2Q) and the three main units carried about S$70.7m of work remaining.AnnouncementReaction (next session, 8 Jul): BEZ +0.0% · STI +0.5% · peers −1.2% · 0.5× median volumeSource: SGX announcement, 7 Jul 2026 (released 18:56, after the close)
Every other test on this page waits for the company to file. These do not. Each row is a series you can look up yourself, free, today — with the level this reading was built against, the levels that would put it in question, and what the series cannot tell you.
marine and offshore fabrication — nothing public to watch
Searched the drilling-contractor rig-count series, offshore day-rate commentary and the shipyard order statistics. Each describes the offshore cycle, but this company sells corrosion-prevention and fabrication man-hours into yards and asset owners on short lead times, and it discloses no group book-to-bill against which any of them could be calibrated. Adopting a rig count would imply a link to drilling activity the company's own segment disclosure does not support.
Watchlist reviewed on 2026-08-27; each observation has its own date above. This watchlist date does not change the company research cutoff. A series moving past a level is a reason to re-read the case, not a recommendation. The same series across every company covered: what you can watch.
Notes and sources
What remains unanswered
1. How quickly will S$23.0m of contract assets convert to certified billings and cash?
2. Which facilities survived at 30 June, and what do their executed covenant definitions and waivers say?
3. What is ASOM entity-level PAT for the earn-out calculation, and when will cash be paid?
4. How does contracted work roll from opening balance through execution, variations, cancellations and new orders?
5. What is the residual NCI run-rate after the full-ownership transaction?
Download
A print-ready PDF of this page, for reading away from the screen: Beng Kuang Marine evidence library (PDF). It carries the same content as this page — the filing tape, the twenty-year record, the ASOM transaction, segment economics, 1H2026, contracted work, customer concentration, funding and covenant evidence, the share price and open questions — and the same omissions: no rating, no fair value, no forecast.
The local source library contains 22 annual reports, 53 results files, 86 credit/funding documents, 510 circulars and announcements, 20 other files and 547 text extracts. A fresh 12-month issuer-IR tape enumerated 74 company-announcement rows and one hosted analyst note. Secondary articles were used only for discovery and context; issuer filings control.
Correction, 16 September 2026 — the ASOM consideration-share count. The transaction-bridge table read “57,142,857 shares at S$0.35”. That is the number the sale-and-purchase announcement said would be issued; the 1H2026 interim records the allotment of 57,142,856 new ordinary shares on 28 May 2026, and the table describes the completed accounting, so it now carries the issued count. The figure elsewhere on this page for the shares actually issued was already 57,142,856; the sentence pricing the consideration shares at a 12.8% premium to the S$0.3104 VWAP keeps the announced 57,142,857, because it describes the announced terms. No monetary figure changes: both counts price at S$20.0m.
The 2004 prospectus remains unavailable after the MAS OPERA registration expired. The attachment map also contains more extant IDs than collected company PDFs; this is a reconciliation gap, not proof of a specific missing-file count. The 17 August filing demonstrates why map-to-corpus-to-claim reconciliation is required immediately before a research freeze.
Reader questions & corrections
Ask about this company, challenge a source or suggest a factual correction. Only selected questions that SMID Research has reviewed and answered are published.
Submissions are private by default. Your email is encrypted and never published. Please do not send confidential or inside information, allegations about individuals, promotions, or requests for personalised investment advice.
Behind the lock
A complete private working view of this company exists beyond this page: one current integrated equity-credit initiation PDF, the 20-tab integrated workbook, the 15-slide presentation deck, the understanding sheet, a private indicative credit opinion, and the cross-vendor and red-team review artifacts. It is maintained in the author's vault for the author's own records — not published, and not available for sharing. This page carries everything that is public.
These bounded retrospective corrections clarify specific published facts or calculations. They retain each report's existing research cutoff and do not represent a full refresh or a finding that all possible issues are resolved.
Beng Kuang Marine
Internal Inconsistency. The reported S$4.72m total net assets, S$11.16m equity attributable to owners and negative S$6.44m non-controlling interests are now kept on their separate bases. Source basis: existing published 1H2026 statement inputs. Limitation: This does not add a conclusion about balance-sheet deterioration.
Transcripts
Find available event transcripts in the transcript library.
· Beng Kuang Marine Secures S$7.4 Million Purchase Order for Works on a FPSO vessel in Angola · SGX
Earlier announcements, before 20 August 2026 (37)
· Beng Kuang Posts Revenue Growth of 9.7% in 1H2026, Extending its Profit Track Record; Outstanding Contracted Work of S$70.7 million Provides Visibility Ahead · SGX
· Unaudited Condensed Interim Financial Statements for the Six Months Ended 30 June 2026 · SGX
· Key Updates on Contract Progress and Order Book · SGX
· Beng Kuang Marine Secures Two New Life Extension Purchase Orders with an Aggregate Value of US$28.6 Million · SGX
· Proposed Acquisition of the Remaining 49% of the Issued and Paid-Up Share Capital of Asian Sealand Offshore and Marine Pte. Ltd. (Asom) · SGX
· Proposed Acquisition of the Remaining 49% of the Issued and Paid-Up Share Capital of Asian Sealand Offshore and Marine Pte. Ltd. (Asom) · SGX
· Beng Kuang Marine Attracts Strong Institutional Demand and Reputable Investors in Founder's Share Sale, with Management Increasing Stakes · SGX
· The Compensation Share Issuance – Receipt of AIP from SGX-ST · SGX
· Material Variances Between Unaudited Full-Year Financial Results Announcement and Audited Financial Statements for the FY Ended 31 December 2024 · SGX
· Completion of the Proposed Bonds Redemption and Offer · SGX
· Proposed Bonus Issue of Three (3) Warrants for Every Ten (10) Existing Shares at an Exercise Price of S$0.22 for Each Warrant Into a New Share - Receipt of AIP from SGX-ST · SGX
Titles are from the linked SGX filing, with common words abbreviated. Summaries are written by AI and may contain inaccuracies; refer to the original announcement. Items after 20 August 2026 are not reflected in this page's analysis; earlier items are listed for reference, may not be discussed in it, and may have been updated by later announcements.