Australia · Heavy engineering, construction & shipbuilding
ASX: CVL · SGX: P9D · Information cut-off 28 August 2026
Investor snapshot
Business model
Civmec fabricates and installs large engineered structures for resources, infrastructure, marine and defence customers, recognising revenue as contracted work progresses.
Latest figures
FY2026 revenue was A$903.0m, operating cash flow was negative A$23.1m and net debt including leases rose to A$71.7m, even though the longer FY2019-FY2026 record still shows A$438.5m of cumulative operating cash against A$325.9m of profit.
Main risk
The central risk is that working-capital swings, order-book definitions and the acquired naval programme obscure underlying cash generation.
Next proof
The next test is the next results' contract cash flow, order-book bridge and defence-programme contribution.
Public credit analysis; no public letter rating. Information cutoff 28 August 2026, 07:45 AEST. The latest reported period is FY2026, the full year to 30 June 2026 — Appendix 4E, condensed statements, audited report of the directors and financial statements, media release and investor presentation. The issuer documents are dated 27 August; the official ASX tape lodged the complete matching seven-item package at 07:45 AEST on 28 August. The audited accounts carry an unmodified joint opinion from Moore Australia Audit (WA) and Moore Stephens LLP; the condensed half-and-full-year statement states on its own face that those figures are neither audited nor reviewed. Every number below is as reported in a primary filing or computed from one, with the computation shown.
Evidence balance
The live questionWill the receivable and contract-asset book built up in FY2026 convert into collected cash as progress claims are certified and billed?FY2026 turned operating cash flow to an outflow of A$23.1m even as reported profit rose, so collection of work already performed now decides whether the improvement reaches cash.
What improved
Second-half revenue was A$522.5m against A$307.7m a year earlier, up 69.8%; group profit to owners rose 22.5%, driven by Resources gross profit up 37.5% to A$67.3m on margin recovery; the order book was stated at A$1.4bn at 31 July 2026.
What became more demanding
In the same year working capital absorbed cash: contract assets rose A$122.7m to A$277.7m, 112 days of revenue against 70; lease-adjusted net debt rose from A$17.6m to A$71.7m; and surety-bond utilisation rose from 45.9% to 67.7% of its limit.
Strongest alternative explanation
The absorption could be gross-up and growth funding rather than deterioration: A$128.315m of receivables and an identical payable came in with the acquisition as a Commonwealth-to-vendor pass-through, and a second half growing 69.8% funds unbilled work before certification. That does not by itself establish a collection problem.
The decisive missing fact
The closing Commonwealth receivable and NVL payable are disclosed. The next test is how their collection and settlement, alongside progress-claim certification, explain the working-capital cash-flow movement rather than merely the balance-sheet difference.
Drawn from the evidence on this page: the improvement, the constraint, the benign reading and the fact that would settle it. It states no view on the shares.
About the private research record
Also on file for this company, behind the rated view 🔒 (author-only): the private equity and credit working views, including the indicative shadow credit band and blue/red-team conclusions · the complete initiation report (PDF) · the extended financial spread & credit model workbook (Excel, live formulas) · the presentation deck · the independent-review artifacts. Kept private; not for distribution.
On this page
Business anatomy · from inputs to customer value
Designs and steel become large structures at customer projects
Civmec owns the fabrication and construction step; the project owner or prime contractor owns and operates the completed asset.
Follow the operating chain from demand or inputs to customer outcome and cash.
Customer needProject award
Receive the design package
What happensAn energy, resources, infrastructure, marine or defence customer awards work with drawings, specifications and milestones.
Commercial triggerThe contract establishes scope, price and progress-payment terms.
Company actionOwned yards
Fabricate at scale
What happensStructural steel and engineering move through Civmec’s yards to become modules, bridge sections or naval hull blocks.
Value createdEngineering and fabrication progress create contract revenue.
Customer deliveryProject site
Deliver and install
What happensLarge fabricated structures are transported, assembled or installed into the customer’s wider project.
Revenue triggerCertified milestones convert physical progress into billings.
Cash conversionCustomer cash
Collect against progress
What happensThe project owner or prime contractor accepts the work and pays Civmec under the contract.
Cash triggerCash timing follows certification, claims and collection—not only reported profit.
Original SMID Research comic. AI-assisted, analyst-directed monochrome artwork depicts the evidenced operating steps of Civmec Limited; deterministic captions and dated mix figures state the economics using issuer disclosures available to 2026-08-28. The drawings are representative—not issuer artwork, an exact product or site design, a statement of scale, or a company forecast.
Investor translation
What matters after the operating picture
Four questions connect the business model to cash and balance-sheet risk. This is a factual reading aid, not a valuation or recommendation.
Value lever
Converting a large order book into margin and cash without cost overruns or claims leakage.
Cash bottleneck
Work in progress, contract assets and retention are funded before customer certification.
Balance-sheet pressure
Project cash, bonding capacity and committed facilities cannot cover completion and debt service.
Next proof
Award quality, certified progress, contract cash conversion and margin on the current backlog.
Text version of this comic
Customer need · Receive the design package An energy, resources, infrastructure, marine or defence customer awards work with drawings, specifications and milestones. Commercial trigger: The contract establishes scope, price and progress-payment terms.
Company action · Fabricate at scale Structural steel and engineering move through Civmec’s yards to become modules, bridge sections or naval hull blocks. Value created: Engineering and fabrication progress create contract revenue.
Customer delivery · Deliver and install Large fabricated structures are transported, assembled or installed into the customer’s wider project. Revenue trigger: Certified milestones convert physical progress into billings.
Cash conversion · Collect against progress The project owner or prime contractor accepts the work and pays Civmec under the contract. Cash trigger: Cash timing follows certification, claims and collection—not only reported profit.
What the company is
Civmec earns money one way: it wins fixed-price and schedule-of-rates construction contracts and recognises revenue over time as it executes them. What distinguishes it from most contractors is that it owns its facilities. The balance sheet carried A$619.6m of property, plant and equipment at 30 June 2026 against A$903.0m of revenue — a ratio no asset-light contractor would show. The principal asset is the Henderson yard in Western Australia — a 70,000 m² undercover fabrication and assembly hall, including a covered shipbuilding hall, on a 200,000 m² site, which the issuer rates at 80,000 tonnes of throughput a year. The Henderson buildings stand on leasehold land, held under three land leases dating from 2010, 2014 and 2016, each with a renewal option. A second facility at Tomago, Newcastle adds 227,000 m² and a further 25,000 tonnes, with newer sites at Port Hedland and Gladstone.
Revenue by customer location in FY2026 was Australia A$903.0m — 100%, as in every year since the change of domicile. There is no offshore revenue to analyse.
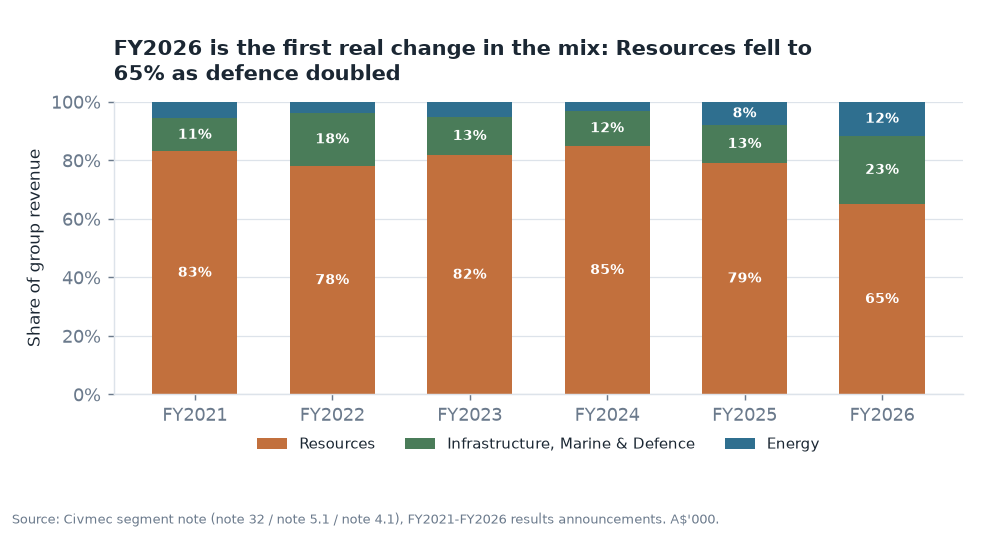
The company reports three segments: Energy; Resources; and Infrastructure, Marine & Defence. The issuer states it aggregates Infrastructure with Marine & Defence “as they have similar long-term average gross margins”. As the segment section below shows, that aggregation stopped being descriptive in FY2025 — and became descriptive again in 1H FY2026.
Three structural breaks the series must respect
Anyone plotting Civmec’s revenue from listing to today on one line is plotting a fiction. There are three breaks, and two of them land on the same year.
Break
What changed
Effect
FY2019
Presentation currency changed from Singapore dollars to Australian dollars
FY2018 revenue of S$738.7m becomes A$712.9m — an implied 1.0363 S$ per A$1
FY2019
Adoption of SFRS(I), including SFRS(I) 15 on revenue from contracts with customers
FY2018 revenue a further A$10.4m lower and profit A$7.3m lower, to A$702.4m and A$17.4m; basic EPS restated from 5.07c to 3.62c
FY2026
Acquisition of Luerssen Australia Pty Ltd, completed 1 July 2025 and renamed Civmec Defence Industries
Net consideration A$17.5m (A$20m cash less a A$2.5m recovered-claim contribution), nil goodwill, and A$36.5m of cash acquired — a net cash inflow. First consolidated in 1H FY2026; FY2026 is the first full year of it, and is the year the segment mix breaks — Resources falls from 79% to 65% of revenue
The FY2018 bridge is the issuer’s own, from note 32 of the FY2019 annual report, and it ties exactly: A$712,850k of translated revenue less a A$10,435k SFRS(I) 15 adjustment equals A$702,415k restated.
As-filed history
Two eras, held apart. First the Australian-dollar era on the current framework:
A$’000
FY2019
FY2020
FY2021
FY2022
FY2023
FY2024
FY2025
FY2026
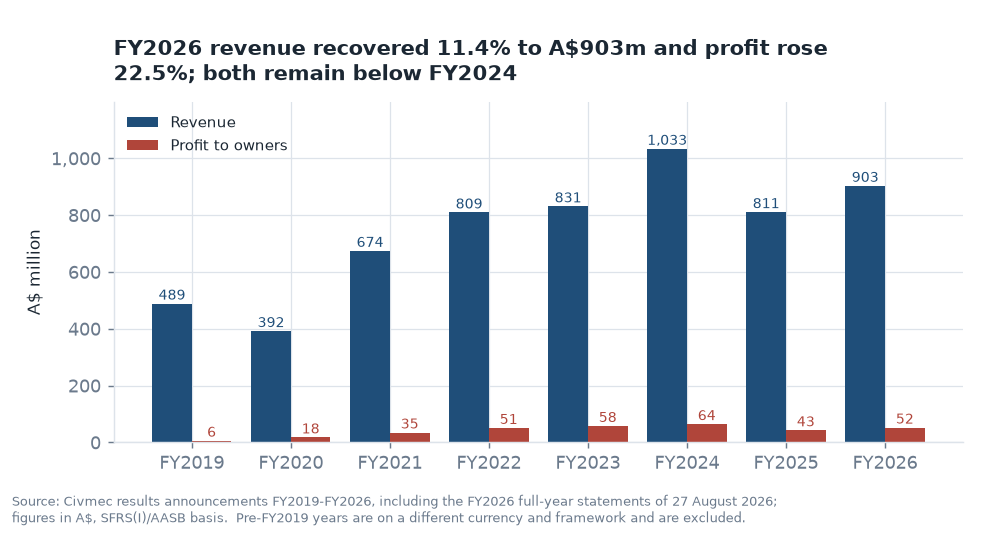
Revenue
488,511
391,868
674,186
809,295
830,866
1,033,473
810,586
902,984
Gross profit
25,533
44,651
75,038
90,837
109,171
119,031
92,940
104,685
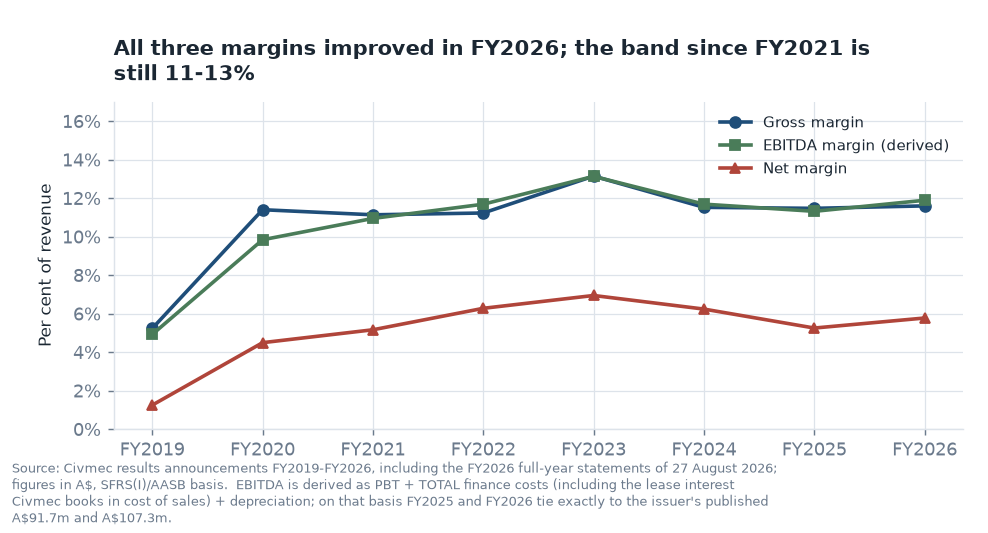
Gross margin
5.2%
11.4%
11.1%
11.2%
13.1%
11.5%
11.5%
11.6%
EBITDA (derived)
24,012
38,534
73,770
94,530
109,079
120,750
91,689
107,323
Profit before tax
8,992
22,766
50,197
69,983
82,571
91,491
60,575
74,148
Profit to owners
6,075
17,586
34,771
50,762
57,655
64,409
42,536
52,096
Basic EPS (A$ cents)
1.21
3.51
6.94
10.11
11.42
12.70
8.37
10.23
Operating cash flow
78,861
95,201
58,263
1,774
95,240
71,354
60,912
(23,117)
Cash capex
68,227
70,039
21,616
6,904
19,880
25,210
4,815
5,400
Net debt incl. leases
n.a.
88,738
66,585
89,080
42,957
32,840
17,571
71,732
EBITDA is not a statutory measure. It is derived here as profit before tax plus total finance costs plus depreciation. Civmec books lease interest inside cost of sales (A$3,797k in FY2025, A$3,993k in FY2026), so the profit-and-loss finance-cost line is not the group total; on the total basis FY2025 EBITDA is A$91.7m at an 11.3% margin and FY2026 is A$107.3m at 11.9%, each exactly the issuer’s own published figure. Two consecutive years tying to the cent is the reason this derivation is used rather than the P&L line. Net debt is borrowings plus lease liabilities less cash, on ending balances.
And the Singapore-dollar era, exactly as originally published — which is where the company’s only completed downcycle sits:
S$’000
FY2012
FY2013
FY2014
FY2015
FY2016
FY2017
FY2018
Revenue
328,654
405,924
433,677
499,153
396,752
345,955
738,741
Gross profit
60,794
69,947
63,755
62,107
43,495
37,059
47,724
Profit to owners
30,310
36,049
35,079
30,308
17,441
8,427
26,225
Basic EPS (S$ cents)
6.05
7.20
7.01
6.05
3.45
1.68
5.23
Revenue fell 30.7% from FY2015 to FY2017 and profit to owners fell 76.0% over the same two years, through the end of the Australian mining-capex boom. The company came out the other side without a rescue equity raising. That is the most useful thing the old series records, and it is invisible in any chart that starts at FY2019.
Revenue peaked in FY2024 at A$1,033m and fell 21.6% in FY2025; profit to owners fell 34.0%. Pre-FY2019 years are excluded because they sit on a different currency and framework.Group margins recovered from the FY2019 trough and have held in a narrow band since FY2021. The segment section below shows what that stability is actually made of.
Segment economics — and the disclosure gap
State the gap first. Note 32 of the FY2025 financial statements says the Group “does not identify nor segregate its assets and liabilities in operating segments as these are managed on a ‘group basis’.” A labelled “Segment assets” block does appear, but the only asset allocated to any segment is A$10k of intangibles (to Resources; the same A$10k in FY2024). FY2026 changed nothing: note 4.1 of the FY2026 statements again allocates that same A$10k and presents A$1,210.1m of assets and the whole A$628.7m of liabilities as unallocated, with capital expenditure given for the group only. At 30 June 2025 the comparable unallocated figures were A$906.8m and A$381.4m. Return on segment assets, segment net capital employed, and the profit-share-versus-asset-share comparison are therefore not computable from the public record. Nothing on this page estimates them.
Correction, 18 August 2026. An earlier version of this paragraph said there were “no segment assets and no segment liabilities disclosed in any year”, and quoted the note as “as they are managed”. Both were wrong: the blocks exist but are almost entirely unallocated, and the filing reads “as these are managed”. The substantive point — that no meaningful capital is allocated by segment — is unchanged. Verified at printed p112–113 of the FY2025 report of directors and financial statements.
What the issuer does disclose is revenue and a “segment result” per segment. That segment result equals group gross profit — it ties to the reported gross profit line exactly in every year, which is worth stating because the label does not say so.
A$’000
FY2021
FY2022
FY2023
FY2024
FY2025
FY2026
Revenue
Energy
38,317
30,192
42,960
31,039
65,188
105,690
Resources
559,781
630,902
678,581
876,478
641,231
587,112
Infrastructure, Marine & Defence
76,088
148,201
109,325
125,956
104,167
210,182
Group
674,186
809,295
830,866
1,033,473
810,586
902,984
Segment result (= gross profit)
Energy
4,289
3,413
5,480
4,332
8,075
14,332
Resources
65,488
71,326
89,467
96,771
48,936
67,288
Infrastructure, Marine & Defence
5,261
16,098
14,224
17,928
35,929
23,065
Group
75,038
90,837
109,171
119,031
92,940
104,685
Segment margin
Energy
11.2%
11.3%
12.8%
14.0%
12.4%
13.6%
Resources
11.7%
11.3%
13.2%
11.0%
7.6%
11.5%
Infrastructure, Marine & Defence
6.9%
10.9%
13.0%
14.2%
34.5%
11.0%
FY2021 Infrastructure, Marine & Defence gross profit is derived by difference from the group total; every other cell is as reported. Segment revenue and segment results both sum exactly to the group figures in all five years.
The FY2026 full year settles both FY2025 anomalies
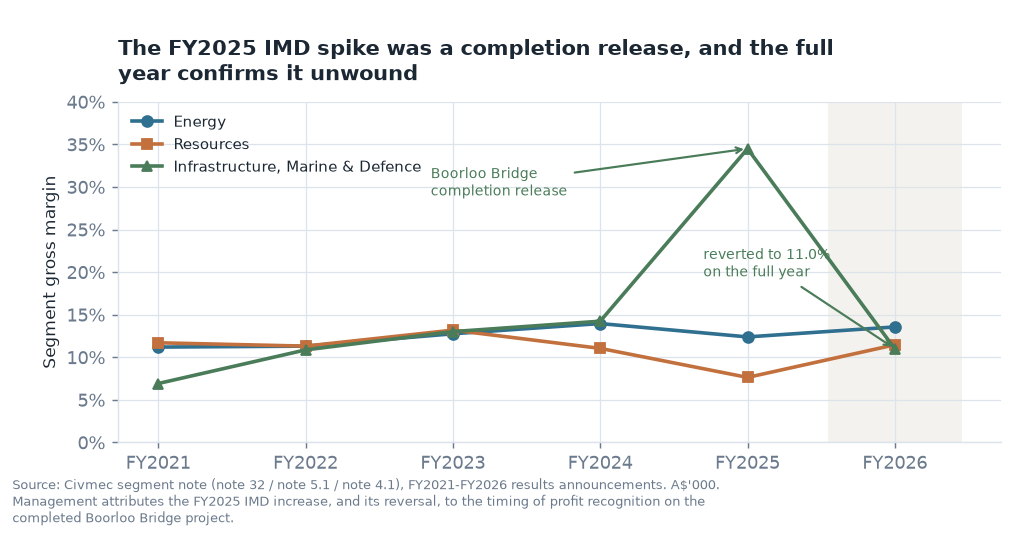
Two things were unresolved in the FY2025 segment note: an Infrastructure, Marine & Defence gross margin of 34.5% against an 11–14% history, and a Resources margin of 7.6% against 11–13%. The full year has now answered both, and in the direction the half-year note pointed. Infrastructure, Marine & Defence came in at 11.0% and Resources at 11.5%. Neither was a new level; both were timing.
What that leaves is a result whose shape is not the one the headline suggests. Group profit to owners rose 22.5%, and the segment that produced the increase is Resources, whose revenue fell: A$587.1m against A$641.2m, down 8.4%, with gross profit up 37.5% to A$67.3m on the margin recovery alone. Infrastructure, Marine & Defence did the opposite — revenue doubled to A$210.2m as Civmec Defence Industries consolidated for a full year, while its gross profit fell 35.8% to A$23.1m. Energy grew on both lines, from a small base.
One issuer statement does not survive its own segment note. Item 2.6 of the Appendix 4E attributes the revenue growth to the Luerssen acquisition “and the increase in activity within the Resources segment which saw the commencement of several large projects”. On a full-year basis Resources activity did not increase — it fell 8.4%, and the same document set says so twelve pages later (“reflecting lower activity levels during the year”). The increase is real but it is a second-half event: Resources revenue rose 55.6% half-on-half, from A$234.3m in 2H FY2025 to A$364.5m in 2H FY2026. Read as a full-year driver the sentence is wrong; read as a second-half one it is right, and the filing does not say which it means.
The half-year note that got there first
Note 26 of the 1H FY2026 interim financial statements, published 12 February 2026, gives the segment note for the half. It answers the question the full-year figures raise:
Two things followed. First, the Infrastructure, Marine & Defence spike was concentrated in the first half of FY2025 — 37.9% against 28.1% in the second — which is what a completion-driven recognition release looks like. Second, both anomalies were already unwinding: the segment was back to 12.5%, and Resources had recovered from 6.9% to 10.9%. This page concluded on 17 August 2026 that “the FY2025 full-year Resources margin of 7.6% was a trough, not a new level”. The FY2026 full year settled it at 11.5%. The half-year segment note is the disclosure that carried the information, six months before the full year confirmed it.
The Luerssen acquisition, as disclosed
Note 12 of the same statements sets out the provisional purchase-price allocation for Luerssen Australia, now Civmec Defence Industries:
A$’000
Acquisition-date amount
Cash consideration
20,000
Less: contribution to Civmec from CoA recovered claim
(2,500)
Net value of consideration
17,500
Cash and cash equivalents acquired
36,533
Trade and other receivables
128,315
Property, plant and equipment / right-of-use assets
3,364 / 1,803
Trade and other payables
(128,315)
Contract liability
(22,195)
Lease liabilities
(2,017)
Total identifiable assets and liabilities
17,500
Identifiable net assets equal the net consideration exactly, so no goodwill arises. Cash acquired of A$36.5m exceeded the A$20m paid, making the transaction a net cash inflow of roughly A$16.5m. The issuer states that contracted confidentiality obligations prevent it from disclosing Civmec Defence Industries’ separate financial contribution; the FY2026 accounts repeat that refusal word for word. The FY2026 note carries the same acquisition-date amounts as the interim note, so no measurement-period adjustment was recognised.
Correction, 27 August 2026 — the acquired contract liability was not released, and this page said it would be.
Note 12 of the 1H FY2026 interim statements, published 12 February 2026, said the contract liability “will be amortised on a straight-line basis over its estimated useful life of 4 years being the length of the contract, starting from the acquisition date”. On that stated policy this page computed roughly A$5.5m a year of non-cash profit running to FY2029, and, in a correction published on 18 August 2026, attributed about A$2.8m of it to the 1H FY2026 gross margin — restating that half’s 11.8% as approximately 11.1% excluding it.
Note 13 of the FY2026 accounts says the opposite. Management “concluded that no release of the acquired contract liability should be recognised during the current financial year”; the carrying amount is unchanged at A$22.195m at 30 June 2026; and management “will continue to assess the appropriate timing and pattern of release as the contract progresses”.
Three consequences, all in the issuer’s favour and none of them previously on this page. FY2026 profit of A$52.1m contains none of that non-cash credit. The 1H FY2026 gross margin of 11.8% stands as reported, and the 11.1% adjusted figure published here on 18 August is withdrawn. And the full A$22.195m still sits on the balance sheet inside contract liabilities, ahead of the company, on a release pattern the issuer has now declined to state — so it is a known future credit of unknown timing rather than a run-rate.
Both the derived A$5.5m and the derived A$2.8m were this page’s computations off the issuer’s stated policy, not issuer disclosures, and both were labelled as such. The policy changed; the arithmetic did not fail. Verified at note 12, printed p13 of the 1H FY2026 condensed interim consolidated financial statements, against note 13, printed p25 of the FY2026 condensed statements.
A A$92.8m payable to Naval Vessels Lürssen for pre-acquisition contract milestones sat in trade and other payables at 31 December 2025. That payable is the visible half of a structure worth understanding: the acquisition brought in A$128.315m of trade and other receivables and A$128.315m of trade and other payables — the same figure to the dollar. The interim statements name both sides: the receivable is “outstanding pre-acquisition contract milestone payments recoverable from the Commonwealth of Australia”, the payable is the matching amount owed “through to NVL Australia GmbH in accordance with the Share Sale and Purchase Deed”. Civmec collects from the Commonwealth and pays it on. It is economically neutral and it does not touch profit, but it grosses up both sides of the balance sheet and it runs through the working-capital lines of the cash flow statement, which is why the FY2026 balance sheet and cash flow below cannot be read without it.
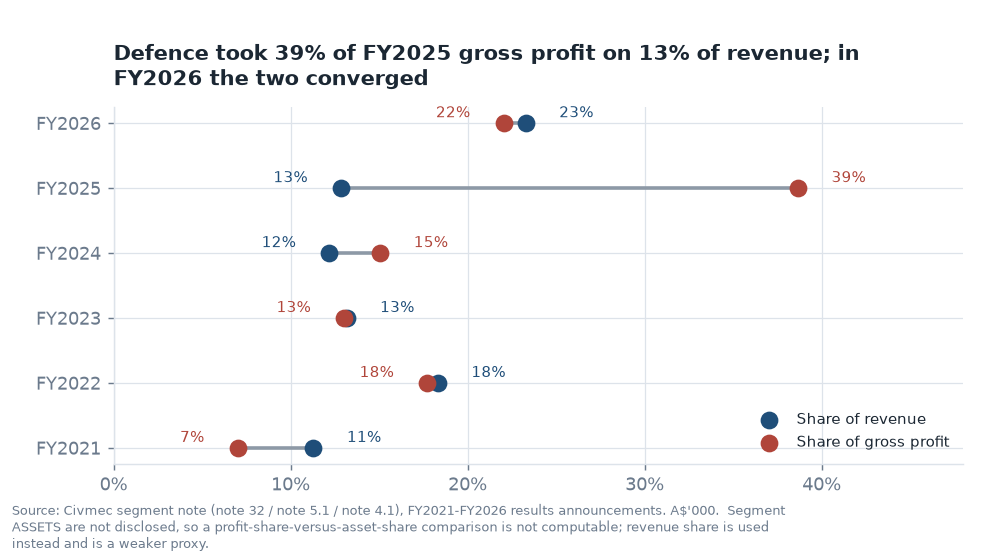
Resources has been between 78% and 85% of revenue for five years. The FY2025 dip in its share is a Resources contraction, not a diversification.The FY2025 group gross margin of 11.5% was unchanged on FY2024 — but underneath it Resources lost 341 basis points while Infrastructure, Marine & Defence posted 34.5% against an 11–14% history.
The issuer’s own explanation for the Infrastructure, Marine & Defence move is one clause, in the FY2025 review of performance: the increase was “mainly due to the timing of profit recognition from the completed Boorloo Bridge project (known as the Causeway Pedestrian and Cyclist Bridges)”. The issuer does not quantify it anywhere. Applying the segment’s own FY2021–FY2024 aggregate margin — A$53.5m of segment result on A$459.6m of segment revenue, or 11.6% — to its FY2025 revenue would give roughly A$12.1m of gross profit rather than A$35.9m, an indicative A$23.8m above that benchmark. That figure is a benchmark-based computation shown here for scale, not an issuer disclosure, and it should not be read as an estimate of an “abnormal” amount: recognition timing moves profit between periods, it does not create or destroy it.
FY2026 has now tested that benchmark. The 11.6% figure was struck from FY2021–FY2024 before the segment’s post-acquisition shape was known; the segment reported 11.0% in FY2026, on revenue two-thirds larger than any year in the benchmark window. The FY2026 review of performance names the same cause for the fall that it named for the rise — “primarily due to the timing of profit recognition from the completed Boorloo Bridge project in FY2025”. The issuer still does not quantify it in either direction. What can now be said, which could not be said a week ago, is that the segment’s underlying margin is a low-teens number and the FY2025 print was not it.
In FY2025 the segment produced 39% of group gross profit on 13% of group revenue. Because segment assets are not disclosed, revenue share stands in for the capital share this chart would normally use — a weaker proxy, stated as such.
Customer concentration
The FY2026 segment note discloses that the Group supplied three major external customers, now in the Resources and the Infrastructure, Marine and Defence segments, accounting for approximately 50.09% of external revenue (FY2025: three customers, all in Resources, 51.4%; FY2024: two customers, 53.5%). Because only A$10k of assets is allocated to any segment, that exposure cannot be sized against the capital standing behind it. It is worth setting against the listing-era position: the 2012 IPO prospectus discloses that five customers were 88.3% of FY2011 revenue, and that at 1Q2012 the top two alone — Leighton Contractors at 40.9% and BHP Billiton Iron Ore at 35.1% — were about 76%. The bases differ (top five then, top three now), but even comparing the top two of 2012 with the top three of 2025 runs conservatively and still shows a large reduction. Concentration here is high in absolute terms and materially lower than at any earlier point in the listed history. Named FY2026 work in the issuer’s own updates includes BHP’s Port Debottlenecking Project 2 at Nelson Point, Iluka Resources’ Eneabba rare-earths refinery and Chevron Gorgon modules — a large-cap counterparty set.
The order book
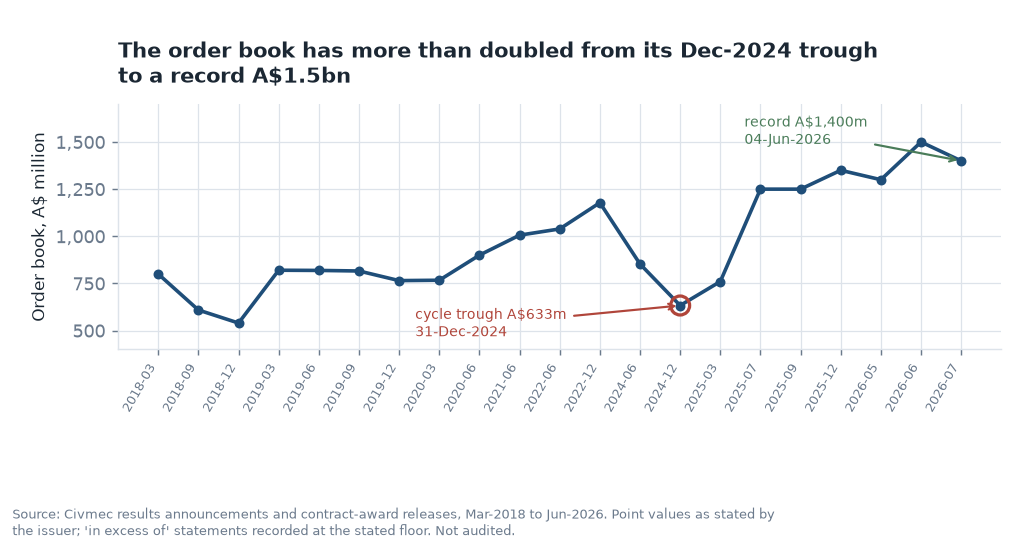
Civmec publishes a forward order book at most quarterly updates. It is an issuer-defined, unaudited disclosure, and it has been stated on at least three different bases: point values, “in excess of” floors, and — on 4 June 2026 — a figure including only Civmec’s participating interest in an alliance contract. That inconsistency is recorded here rather than smoothed over.
The order book troughed at A$633m at 31 December 2024, peaked at a record A$1.5bn on 4 June 2026, and was stated at A$1.4bn at 31 July 2026 with the FY2026 result — still 121% above the trough, and A$100m below the June peak. Part of the increase was acquired rather than won: the remaining SEA1180 programme entered the book with the Luerssen acquisition in July 2025. “In excess of” statements are plotted at the stated floor.
A fourth measurement basis appeared with this result. The FY2026 book is given “as at 31 July 2026” — a month after the balance-sheet date — and no 30 June 2026 point value is published anywhere in the results set. The FY2025 book was stated the same way, at 31 July 2025. That is now three inconsistencies in one series: point values against “in excess of” floors, participating-interest-only treatment of alliance work from 4 June 2026, and a measurement date that moves between 30 June and 31 July. Five observable pairs let the relationship between the book and the following year’s revenue be computed rather than asserted:
Order book at 30 June
Book (A$m)
Following year
Revenue (A$m)
Revenue ÷ opening book
FY2020
900
FY2021
674.2
0.75x
FY2021
1,006
FY2022
809.3
0.80x
FY2022
1,039
FY2023
830.9
0.80x
FY2024
853
FY2025
810.6
0.95x
FY2025 (at 31 Jul 2025)
1,250
FY2026
903.0
0.72x
FY2023 is excluded because no 30 June 2023 point value was published — the issuer said only “in excess of A$1 billion”. The FY2025 row uses the 31 July 2025 figure because no 30 June 2025 value was published either; it is one month of awards further on than the other rows and is labelled rather than adjusted. On that basis conversion has ranged 0.72x to 0.95x over five pairs. The issuer has published a conversion statement once, with the FY2020 results: of the A$900m book at 30 June 2020, “over half” was expected to be realised in FY2021. No conversion statement accompanies the A$1.4bn book; the company says only that it provides “visibility into FY27 and FY28”.
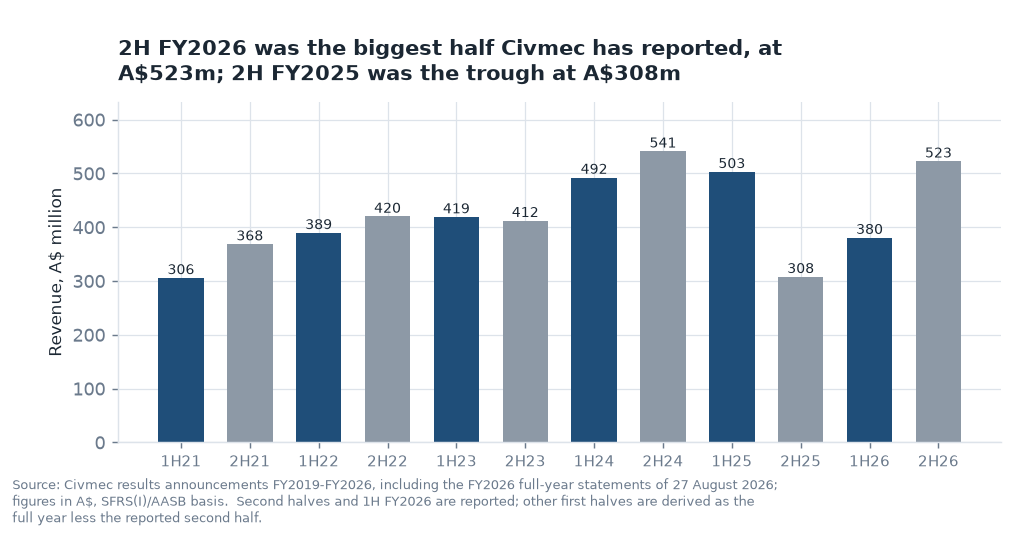
2H FY2026 is the largest half Civmec has reported, at A$522.5m — 69.8% above the A$307.7m trough half of 2H FY2025 and 37.4% above 1H FY2026. The year is heavily back-loaded: 57.9% of FY2026 revenue and 58.8% of its profit fell in the second half. Second halves and 1H FY2026 are reported; other first halves are derived as the full year less the reported second half.
The Q3 FY2026 business update of 15 May 2026 reported quarterly revenue of A$244.2m, nine-month revenue of A$624.7m, nine-month EBITDA of A$73.8m (11.8% margin) and nine-month net profit after tax of A$34.9m (5.6% margin), with earnings per share of 6.86 Australian cents for the nine months. The full year now brackets that update: subtracting the nine months from the reported year gives a fourth quarter of A$278.3m of revenue and A$17.2m of profit — the largest quarter on record and a 6.2% net margin, above the 5.6% of the preceding nine months. Both Q4 figures are derived by difference; the issuer does not report quarterly figures at the full year.
The programmes the company has named, and how their dates have moved
Named initiatives, with the dates as first announced and as most recently restated. Built from the issuer's own filings; where a figure has been published more than one way, every version is shown rather than one being chosen. Execution risk is the author's read and carries its basis in the cell.
Initiative
Timeline, as announced and as restated
Target given
Status and last filed milestone
Execution risk
SEA1180 Arafura-class offshore patrol vessels
Twelve vessels at award. Restated to six in FY2024. The updated National Defence Strategy of 16 April 2026 re-committed to all six and added A$1.0–1.5bn over ten years, primarily for sustainment.
No target published by the issuer. Civmec states a A$25bn funding envelope for the Henderson Defence Precinct, its characterisation of a government document not held in the pack.
Defence issued a suspension-of-payment letter on 21 March 2024 over late support-system delivery. A Project of Concern summit followed on 4 May 2026; Defence and Civmec Defence Industries had implemented a remediation plan and achieved OPV 1–3 milestones, with remaining challenges requiring sustained momentum.
High. The prime contract carries step-in rights, payment suspension, liquidated damages and termination remedies, and the programme has already been halved and placed under formal Defence oversight.
Civmec Defence Industries (Luerssen Australia)
Acquired 1 July 2025; renamed Civmec Defence Industries during 1H FY2026. No date has moved.
None given. The acquired contract liability of A$22.195m was not released at all in FY2026; the interim statements’ stated four-year straight-line policy was not applied and the release pattern is now “to be assessed”.
A$20.0m cash for 100% of the shares, A$17.5m net of a A$2.5m contribution from the Commonwealth recovered claim. Identifiable net assets equalled the net consideration, so no goodwill arose.
Medium. It makes Civmec prime on SEA1180, so its risk is that programme's risk. Acquired receivables of A$128.3m and payables of A$128.3m are exactly equal, which is worth watching as the balances unwind.
Perth Park alliance
Awarded through Main Roads Western Australia for the state's entertainment and sporting precinct. No restatement disclosed.
None. Civmec recognises only its portion of the participating interest in the alliance within the order book, so the headline order book understates the contract's gross value.
Delivered by an alliance of Civmec, Seymour Whyte and Aurecon. The Western Australian Parliament tabled an interim report on 18 June 2026 raising process and probity concerns about the procurement.
Medium. An alliance model shares risk but also dilutes control, and public procurement scrutiny can alter scope, certification and schedule.
Henderson assembly hall and site
Site extended by approximately seven hectares under a 2016 LandCorp lease for A$26.5m total consideration. Hall completed 2020.
80,000 tonnes of steel a year of stated throughput capacity at Henderson, against 25,000 at Newcastle.
The hall's size has been published four different ways: 29,000m² and a 53,470m² gross floor area in the same 26 April 2017 release, 53,000m² usable at the 2019 high-bay milestone, and 70,000m² usable in the FY2025 Annual Report — nine printed pages before the same report says 53,000m². Only the 2019 figure names its basis.
Low for delivery, but the disclosure is unreliable. The asset plainly exists and operates; the issuer has never reconciled its own published measurements, so no single area figure should be quoted from it.
What the balance sheet is made of
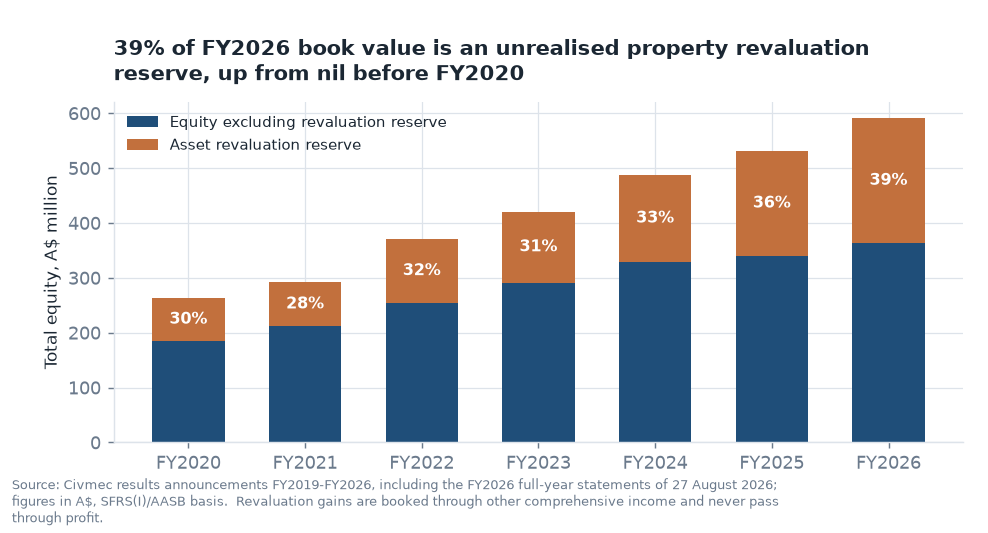
Civmec carries freehold land and buildings under the revaluation model, with gains taken to other comprehensive income and never through profit. The consequence compounds:
The asset revaluation reserve was nil before FY2020 and stood at A$228.5m of A$591.2m of total equity at 30 June 2026 — 38.7%, up from 35.8% a year earlier. FY2026 added a further A$54.8m gross revaluation gain on freehold land and buildings, none of it through profit. The associated deferred tax liability was A$104.1m.
This matters for anyone computing a return on equity or a price-to-book from screening data, because the denominator contains a large and growing amount of capital the operating business never earned or deployed:
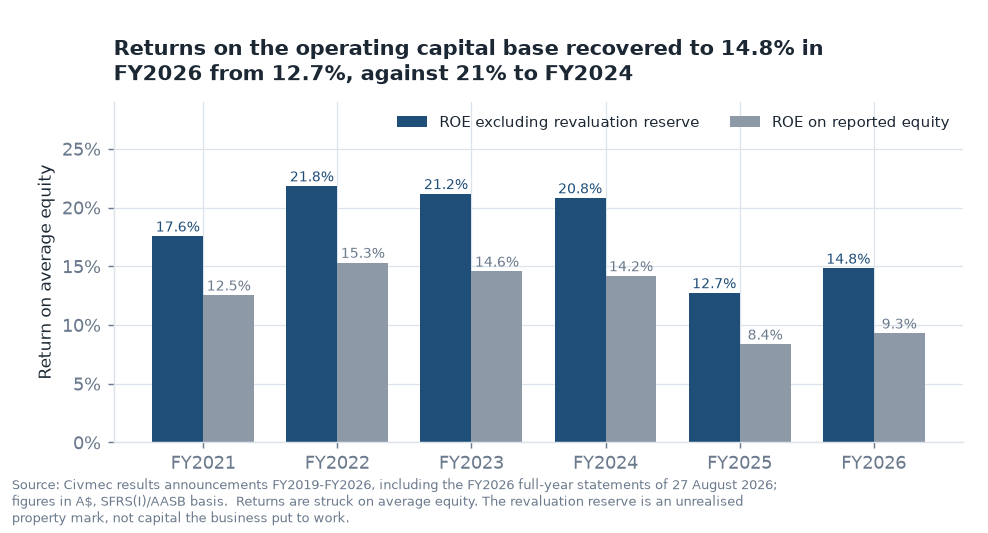
Return on average equity was 9.3% in FY2026 as reported, and 14.8% on equity excluding the revaluation reserve — against 8.4% and 12.7% in FY2025. The gap widens every year the reserve grows, and FY2026 widened it again.
Funding is modest but not disclosure-light, and FY2026 moved it. At 30 June 2026: cash was A$54.6m against A$102.9m a year earlier, borrowings A$60.0m unchanged, and lease liabilities A$66.4m against A$60.5m — giving lease-adjusted net debt of A$71.7m against A$17.6m, a A$54.2m increase in one year. On derived EBITDA that is 0.67x against 0.19x, with 11.4x EBITDA coverage of total finance costs against 9.5x. Leverage is still low in absolute terms; the direction is the fact.
The facility architecture is now one shared limit rather than the FY2025 structure this page previously described. The A$86m corporate-loan limit and its A$2m quarterly step-down were superseded during FY2026: the existing facilities were renegotiated and consolidated into a single revolving multi-option facility of A$160m (FY2025: A$156m) covering corporate market loans, letters of credit and bank guarantees together, so the quarterly limit reduction is no longer in effect. It was 39.0% utilised at 30 June 2026 (FY2025: 40.5%), leaving roughly A$97.6m of unused limit; interest ranged 4.49%–5.34% (FY2025: 4.98%–5.55%). The facility is secured by a general security deed over certain property, plant and equipment and investment properties. The issuer states all financial covenants — leverage, tangible net worth and debt-service cover — were met at 30 June 2026, and still does not publish their definitions, thresholds or numerical headroom. The facility expires on 31 January 2028, with a possible bank extension; draw conditions, minimum operating cash and the accessibility of secured cash remain incomplete in the public record. Because one limit now serves cash borrowing and bonding at once, unused limit is not the same thing as spare cash capacity.
Issued shares went from 500,985,000 at FY2020 to 509,625,000 at FY2026, a 1.7% increase over six years, entirely from the conversion of performance rights — 1,097,000 of them in FY2026. There have been no placements or rights issues in the Australian-dollar era.
Cash conversion
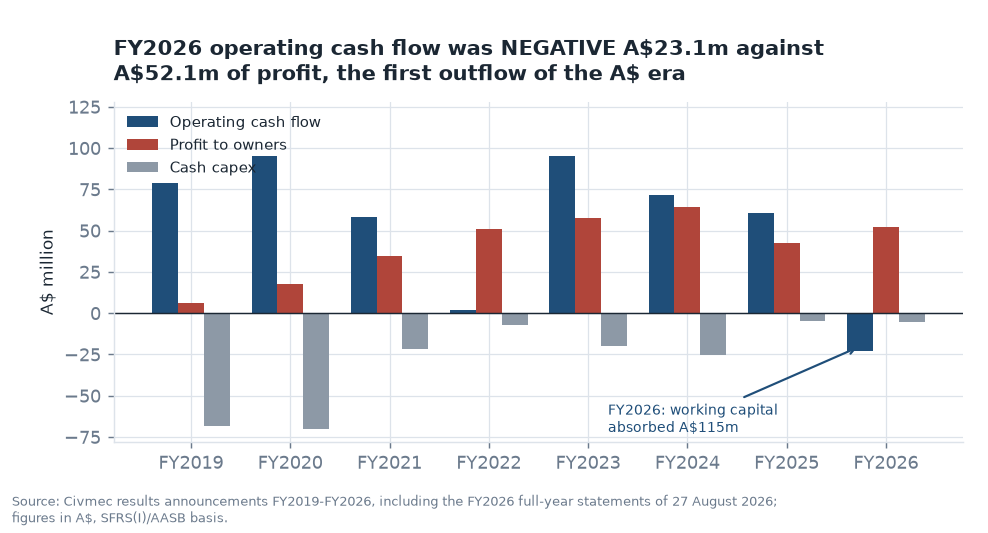
FY2026 produced negative A$23.1m of operating cash flow against A$52.1m of profit — the first operating outflow of the Australian-dollar era, and a A$84.0m swing on FY2025. FY2022 came close once before, at A$1.8m against A$50.8m. Single-year cash conversion is close to uninformative for this business model; two of the last five years make that point.
Cumulatively over FY2019–FY2026 the picture is still different from any one year: operating cash flow of A$438.5m against profit to owners of A$325.9m — a ratio of 1.35x, down from 1.69x on the FY2019–FY2025 window. Cash capex over the same period was A$222.1m, of which A$138.3m fell in FY2019 and FY2020 during the facility build-out. FY2026 cash capex of A$5.4m was 0.23x that year’s depreciation of A$23.7m — a second consecutive year at roughly a fifth of the depreciation charge.
What the FY2026 outflow is made of
The media release reports “operating cash flow before working capital movements” of A$107.2m, up 20.0%, and does not print the statutory figure. Both numbers are true and they are A$130m apart. The reconciliation is the issuer’s own, from the FY2026 statement of cash flows:
FY2026 operating cash flow, A$’000
Amount
Operating cash flow before working capital changes
107,158
… trade and other receivables
(159,330)
… contract assets
(122,699)
… other current assets
(642)
… trade and other payables
131,814
… contract liabilities
31,370
… provisions
4,174
Working capital absorbed
(115,313)
Cash used in operations
(8,155)
Interest received
1,815
Finance cost paid
(7,890)
Income tax refund
6,861
Income tax paid
(15,748)
Net cash used in operating activities
(23,117)
As reported. The statutory outflow is disclosed by the issuer — in the Listing Rule Appendix 7.2 commentary of the same document (“Operating cash flow was an outflow of A$23.1 million for FY2026”) — but not in the media release or the highlights page of the investor presentation, both of which carry the A$107.2m pre-working-capital figure instead.
Three separate things are inside the A$115.3m, and only one of them is a trading deterioration:
The pass-through. The Commonwealth receivable and the matching NVL payable acquired with Civmec Defence Industries move together and are the same size. They inflate the gross movements on both the receivable and the payable lines without being a net use of cash.
Genuine growth funding. Second-half revenue was A$522.5m against A$307.7m a year earlier — up 69.8%. A contractor that grows a half by that much funds the receivables and unbilled work that come with it, and the payables only partly offset the timing.
Unbilled work. Contract assets rose A$122.7m to A$277.7m, or 112 days of FY2026 revenue against 70 days a year earlier. The issuer attributes this to “the timing of progress claim billings and the measurement of project progress”. This is the line that carries recognition judgement, and it is the one the auditors singled out.
The dividend was not covered by the year’s cash. Free cash flow before dividends was negative A$28.0m (statutory operating cash flow less A$5.4m of capex plus A$0.6m of disposal proceeds), against A$30.6m of dividends paid. The gap was met from the opening cash balance and from the A$16.5m net cash that arrived with the acquisition — which is a one-off, not recurring free cash flow. Cash fell A$48.3m over the year and borrowings were unchanged at A$60.0m; the company drew A$132.8m and repaid A$132.3m on the revolver during the year, so the flat closing balance conceals heavy intra-year use.
What this does and does not establish. One year of negative operating cash flow in a contractor growing its second half by 70% is what growth funding looks like, and this business has produced A$438m of operating cash over eight years. It is not, on this evidence, a cash-quality failure. What it does establish is that the FY2026 profit increase was not converted to cash in FY2026, that the conversion now depends on collecting a receivable and contract-asset book that grew A$307.6m in twelve months, and that the next print — 1H FY2027, due around February 2027 — is the first place that collection becomes observable.
Where the cash went, FY2021–FY2026
Capital allocation, as filed. The point of the table is the third and sixth rows read together: cash capex has now run at 0.6% of revenue for two consecutive years while property, plant and equipment rises every year. The property base is carried at valuation, not at cost. Note 10 of the FY2026 condensed statements states that had the revalued freehold land and buildings been carried at historical cost their net book value would be A$201.0m against a revalued carrying amount of A$453.8m — an excess of A$252.8m, or 55.7% of the carrying amount (30 June 2025, from the same note: A$205.9m against A$414.0m, an excess of A$208.1m or 50.3%). FY2026 alone booked a A$54.8m gross revaluation gain against A$5.4m of cash spent. Committed forward capex is the issuer's only forward-looking capex disclosure and remains near zero; it is not disclosed before FY2024. Correction, 27 August 2026: an earlier version of this caption gave the 30 June 2025 excess as A$254.9m and 55.3% of the class. That figure could not be reproduced from the note's own two columns and both years are now stated on the FY2026 note's basis.
This section is SMID Research’s independent, unsolicited public credit analysis, prepared from public information. It is not a rating issued by S&P Global Ratings, Moody’s or any other credit-rating agency, and it does not copy proprietary agency grids, weights, mapping or thresholds. Regional-bank credit-research brevity and issue framing inform the presentation; no third-party Issuer Profile construct is used. The familiar letter-grade debate and scenario migration register sit only in the authenticated private vault.
Public credit conclusion, restated on the FY2026 accounts. Lease-adjusted leverage remains low at 0.67x derived EBITDA and finance-cost coverage improved to 11.4x, so debt-service capacity is not in question on these figures. Three things moved against the issuer in FY2026, all new since the last version of this section: operating cash flow was an outflow of A$23.1m, lease-adjusted net debt rose from A$17.6m to A$71.7m, and surety-bond utilisation rose from 45.9% to 67.7% of its limit. The prior constraints all stand: modest scale, Resources and customer concentration, fixed-price and cost-to-complete risk, lumpy working capital, contingent performance bonding, and incomplete disclosure of facility maturity, covenant and cash-accessibility terms.
Blue team and red team
Review lens
Conclusion
What carries the most weight
Blue team — S&P-style lens
Financial capacity is stronger than the overall business-risk view.
Net leverage still only 0.67x EBITDA, finance-cost cover improved to 11.4x, A$97.6m of unused facility limit, covenants stated as met, EBITDA up 17.0%, and a A$1.4bn order book.
Red team — Moody’s-style challenge
The present public evidence does not support a formal grade.
FY2026 turned cash flow negative, tripled net debt and took surety utilisation to 67.7%; cash accessibility, facility maturity and covenant thresholds remain unpublished; contract assets at 112 days and the auditors’ key audit matters on construction-contract accounting and on the recoverability of receivables and contract assets deserve more weight than the leverage ratio.
Resolved house treatment
Publish the factual credit analysis and neutral watchpoints; keep the letter-grade range private.
No instrument or recovery view without executed ranking, security and guarantee documents.
Lease-adjusted credit ratios
A$ million / x
FY2024
FY2025
1H FY2026 / Dec-25
FY2026
EBITDA
120.8
91.7
46.0
107.3
Adjusted gross debt — borrowings plus leases
121.3
120.5
124.5
126.4
Adjusted net debt — less cash
32.8
17.6
36.9
71.7
Gross debt / EBITDA
1.00x
1.31x
1.35x annualised
1.18x
Net debt / EBITDA
0.27x
0.19x
0.40x annualised
0.67x
EBITDA / total finance cost
12.60x
9.47x
10.30x
11.36x
Statutory CFO
71.4
60.9
(10.3)
(23.1)
FCF before dividends
46.1
56.1
(11.3)
(28.0)
The same gap persists at the full year. On borrowings alone Civmec is A$5.4m net debt at 30 June 2026 — A$54.6m of cash against A$60.0m drawn — having been A$42.9m net cash a year earlier. Including the A$66.4m of lease liabilities the figure is A$71.7m. The lease-inclusive number is the consistent creditor measure and it is the one that moved: A$54.2m of deterioration in twelve months, of which A$48.3m is the cash draw-down and A$5.9m the lease-liability increase from remeasurement and additions. FY2026 EBITDA is on the derived total-finance-cost basis and ties to the issuer’s published A$107.3m.
Cash waterfall — cash quality matters more than the EBITDA line
A$ million
FY2025
1H FY2026
FY2026
EBITDA
91.7
46.0
107.3
Operating cash before working capital
89.3
44.9
107.2
Working-capital movement
+8.5
(53.0)
(115.3)
Net interest and tax cash items
(36.9)
(2.2)
(15.0)
Statutory CFO
60.9
(10.3)
(23.1)
Cash capex
(4.8)
(1.1)
(5.4)
FCF before dividends
56.1
(11.3)
(28.0)
Dividends
(30.5)
(17.8)
(30.6)
Post-dividend FCF
25.6
(29.2)
(58.5)
FY2025’s A$97.8m “operating cash flow” in the results release is cash generated from operations before interest and tax; statutory CFO was A$60.9m. In 1H FY2026, about A$53.0m of working capital was absorbed and cash fell despite a A$16.5m net acquisition inflow. The full year absorbed A$115.3m and the outflow more than doubled to A$23.1m, so the second half consumed a further A$12.8m rather than reversing the first. That acquisition inflow is not recurring FCF: acquired cash arrived with A$22.2m of contract liabilities and A$128.3m each of receivables and payables, and those two are the opposite sides of one Commonwealth-to-vendor pass-through. The A$5.5m annual release of the acquired contract liability that the interim statements’ stated policy implied did not occur: note 13 of the FY2026 accounts recognises no release at all in FY2026 and leaves the carrying amount at A$22.195m. FY2026 earnings therefore need no adjustment for it, and the credit is still ahead of the company on an unstated schedule.
Liquidity, bonding and claims-quality lens
Cash and facilities. Cash was A$102.9m at June 2025, A$87.6m at December 2025 and A$54.6m at June 2026. The facility is now a single A$160m revolving multi-option limit, 39.0% utilised at 30 June 2026 (December 2025: 39.2%; June 2025: 40.5% of A$156m), leaving roughly A$97.6m unused. Gross unused limits are not treated as fully committed cash because one limit now serves cash borrowing, letters of credit and bank guarantees together, and draw conditions, maturity and security terms are incomplete. Total headline liquidity of roughly A$152m is therefore an upper bound, not a committed cash figure.
Sureties are capacity, not cash — and this is the FY2026 line that moved most. Surety-bond utilisation went from A$183.6m of a A$400m limit (45.9%) at June 2025 to A$282.3m of a A$417m limit (67.7%) at June 2026 — a 53.8% increase in bonds outstanding against a 4.3% increase in the limit. Undrawn bonding capacity fell from A$216.4m to A$134.7m. Bank guarantees are separately A$2.4m, so total off-balance-sheet performance obligations are A$284.7m against A$60.0m of drawn debt. The exposure is not funded debt, and rising utilisation is the normal consequence of a larger order book. It matters because bonding capacity is a real constraint on how much work a contractor can carry, and because a project dispute can produce a bond call at the same time as customer withholding, liquidated damages and working-capital stress. On the current trajectory the limit, not the balance sheet, is the binding constraint to watch.
Contract assets need collection evidence, and FY2026 raised the stakes. Contract assets were A$155.0m at June 2025, A$178.8m at December 2025 and A$277.7m at June 2026 — 112 days of revenue against 70 a year earlier. Net contract assets (contract assets less contract liabilities) rose from about A$83.5m to A$174.9m. This is not a misstatement allegation. It is why construction-contract accounting is the first of the auditors’ three key audit matters for FY2026 — the others are the recoverability of A$237.2m of trade and other receivables and A$277.7m of contract assets, and the valuation of property, plant and equipment and investment properties: A$786.8m of FY2026 revenue, 87% of the group total, is recognised on the cost-to-cost input method, and the audit procedures disclosed include challenging management’s judgement on variations and claims and assessing onerous-contract provisions on low- or negative-margin projects. EBITDA should be read alongside certification, ageing, collections and the judgement used for transaction-price adjustments.
Asset value is not immediate liquidity. FY2026 PP&E of A$619.6m supports operating capacity, but A$252.8m of the freehold carrying amount is revaluation above historical cost, the valuations are specialised Level 3 depreciated-replacement-cost marks, and the facility is secured by a general security deed over certain of those assets. All three require a material haircut in any recovery analysis.
Neutral credit watchpoints
One of these has now triggered. The previous version of this section said evidence would weaken if “negative operating cash flow persists alongside rising contract assets or receivables”. In FY2026 operating cash flow was negative for the full year, contract assets rose A$122.7m and receivables A$184.9m. That test is met on its own terms and is recorded as met, not reworded. What it does not yet establish is persistence: this is the first full-year outflow, it followed a 69.8% increase in second-half revenue, and the acquired pass-through inflates both the receivable and the payable side.
Evidence would strengthen if the receivable and contract-asset book converts in 1H FY2027 and rolling operating cash flow after working capital turns positive and covers reinvestment and dividends; if underlying margins hold as the acquired contract liability is eventually released; if customer concentration falls; and if facility and surety limits are extended ahead of order-book growth. Evidence would weaken if a second consecutive period of negative operating cash flow arrives alongside a still-rising contract-asset book; if surety utilisation continues toward its limit without the limit moving; if a material onerous-contract or bond-call event occurs; or if covenant and facility availability begin to constrain liquidity. The covenants are stated as met at 30 June 2026 and their thresholds remain unpublished, so covenant headroom cannot be tested from the public record in either direction.
Over the window Civmec returned +141.9% on a dividend-adjusted basis; the S&P/ASX 200 returned n/a and the median of the 3 listed comparisons +241.8%.
Click a quarter — on the chart or in the return strip under it — to read its filings beside its large moves.
Key: Civmec (CVL) as a solid line; S&P/ASX 200 rebased, dashed; peer median rebased, dotted; the peer median runs off scale from Nov 25 and is clipped there; filing ticks above the axis; ex-dividend ticks on it; numbered pins are moves with a written note; plain dots are other detected moves.
Key moves
The five largest moves over a day or up to two weeks, with no day counted twice.
Each move is shown next to the market over the same days (and peers, where shown). News listed with a move was published within its dates; that does not mean the news caused the move. The quarter view has all the news.
Index: S&P/ASX 200. Peers: the median of three listed companies used as a sector check; the notes name them and their limits.
Q3 2023
22 Aug 2023 – 29 Sep 2023 (part quarter)
CVL +1.1%ASX 200 −1.0%Peer median +6.7%Range A$0.88–A$0.95Close A$0.94
EBITDA rose 15.4% to A$109.1m and the net profit margin to 6.9% from 6.3%. Resources revenue rose 7.6% to A$678.6m with gross margin up to 13.2% from 11.3%; Energy rose 42.3% to A$43.0m; Infrastructure, Marine & Defence fell 26.2% to A$109.3m on the timing of revenue recognition. Cash generated from operations was A$122.8m (113% of EBITDA), borrowings fell to A$56.5m from A$74.0m and the group moved to net cash of A$13.9m from net borrowings of A$33.2m. The order book was A$1,149m at 30 June 2023, up 10.6%. Total dividends for the year were 5.0 cents against 3.0 cents.
Guidance: The company said the A$1.15bn order book secures the majority of revenue planned for the next 12 months, with part of it extending to 2029; labour availability remained constrained and the Navy surface-fleet analysis was expected by end-2023.Same session: CVL −1.1% · ASX 200 +0.7% · peers +0.7%
Q4 2023
2 Oct 2023 – 29 Dec 2023
CVL +5.8%ASX 200 +7.7%Peer median +5.0%Range A$0.89–A$1.03Close A$0.96
Civmec Australia Limited, incorporated on 26 October 2023, was to become the holding company by a Singapore scheme of arrangement, with the SGX and ASX listings transferred to it. The company gave three reasons: all of its 3,400-plus employees and facilities are in Australia; Australian clients and government departments increasingly apply local-content criteria that a Singapore incorporation may limit, including continuous naval shipbuilding after the 2023 Defence Strategic Review; and an Australian parent was expected to improve access to capital on the ASX. Market capitalisation was stated as about A$472m. The board unanimously recommended the scheme. Lodged after the close and not flagged price sensitive.
EBITDA rose 9.1% to A$28.9m and earnings per share to 3.01 cents from 2.82. Cash generated from operations was A$40.1m (139% of EBITDA) and the group ended the quarter with net cash of A$43.9m. The order book was A$1,102m at 30 September 2023. The Port Hedland maintenance facility was under construction and a development application had been lodged for a Gladstone facility. New term agreements included a three-year Albemarle lithium maintenance contract and a Fortescue inspection agreement. Lodged after the Australian close.
Record date 30 November 2023, paid 14 December 2023, approved at the AGM of 31 October 2023. The chart's return series is adjusted for it, so the ex-date step is not counted as a move.
Large price moves
124 Oct 2023 · +8% · index 0% · peers +1%
220 Nov 2023 · −7% · index 0% · peers 0%
323 Nov 2023 · +8% · index −1% · peers 0%
Q1 2024
2 Jan 2024 – 28 Mar 2024
CVL −3.6%ASX 200 +4.0%Peer median +0.6%Range A$0.87–A$0.94Close A$0.91
EBITDA rose 12.6% to A$59.6m but the EBITDA margin slipped to 12.1% from 12.6% and the net margin to 6.5% from 6.7%. Cash generated from operations was A$111.2m, up 32.2%, and net cash reached A$83.1m from A$12.8m a year earlier. The order book was A$1,002m at 31 December 2023 against A$1,102m at 30 October. The Port Hedland facility structure was complete, Iron Bridge construction works were finished and a first Main Roads WA road contract was secured. On the redomicile the company said it was still working with regulators in both countries before a shareholder vote.
EBITDA rose 15.2% to A$31.6m but the EBITDA margin fell to 12.2% from 14.6%. Nine-month revenue was A$750.7m, up 23.7%, with NPAT of A$49.0m, up 14.2%; net cash was A$35.9m. The company said it had completed its supply scope for six Offshore Patrol Vessels, redeployed the shipbuilding workforce to other contracts, and that the reduced OPV count would have no material effect on FY24 revenue or profit. New work included Pilbara Minerals' P1000 expansion and Chevron Gorgon CCS modules; priced opportunities were put at approaching A$10bn. The order book fell from A$1,002m at 31 December 2023.
The shiploader is to be manufactured and assembled offsite at Henderson and shipped by heavy-lift vessel. The balance is maintenance work under existing term contracts (shiploader bogie changeout, wharf remediation, inspection services and shutdowns) and additional scopes under existing manufacturing and construction contracts. Plans for an east-coast maintenance hub in Gladstone were said to be progressing.
The intended JV would contract directly with the Commonwealth and build in the assembly hall at Civmec's Henderson facility. The company said details remained to be worked through, including expanding its Henderson footprint so that resources, energy and infrastructure work was not affected. Not flagged price sensitive.
Of 84 shareholders voting in person or by proxy on 1 August 2024, 79 voted for. The companion EGM resolutions also passed. The scheme still required Singapore High Court approval.
EBITDA rose 10.7% to A$120.8m. Resources revenue rose 29.2% to A$876.5m, Infrastructure, Marine & Defence 15.2% to A$126.0m, and Energy fell 27.7% to A$31.0m. Gross profit rose 9.0% to A$119.0m, but second-half gross profit of A$58.7m was 2.6% below the first half on revenue 9.9% higher. Cash generated from operations fell 21.1% to A$96.9m (80% of EBITDA) on the timing of contract-asset conversion, capex was A$25.2m, borrowings rose to A$64.0m and net cash was A$24.5m. The order book fall was attributed to the timing of a major resources award. Bojan Cica was appointed CFO from 1 September 2024, succeeding COO Kevin Deery in the acting role. The final dividend was conditional on the scheme, sanctioned by the court on 28 August, completing.
Guidance: No forecast given; the company said tendering was targeted given labour constraints, that OEM materials-handling demand exceeded 30 machines over ten years in Australia, and that the LAND8710 JV opened potential participation in over A$25bn of future work.Same session: CVL +5.0% · ASX 200 +0.6% · peers +1.1%
The court order was lodged with ACRA on 4 September 2024. The existing directors joined the NewCo board and its three incorporation directors resigned. ASX CDIs last traded on 30 August 2024 (suspension lodged 7:00pm that day) and the new shares were reinstated at 9:09am on 5 September, initially on a deferred-settlement basis, with normal settlement from 11 September. From this date ASX is the primary venue; before it CVL.AX was a Foreign Exempt CDI line against the SGX listing.
Luerssen Australia's sole business is the six Arafura-class OPVs for the Royal Australian Navy, built at Osborne South and at Civmec's Henderson facility. The transfer was subject to Commonwealth consent, due diligence and conditions precedent, with a target date of 31 December 2024. No consideration was stated. Lodged after the close.
EBITDA rose 1.0% to A$29.2m and earnings per share were 2.99 cents. The order book at 30 September 2024 was above A$800m against A$853m at 30 June. Awards included BHP car-dumper cells CD4 and CD6, a Tianqi Lithium panel and Orora glass-furnace refractory work; bridge accreditation was raised to B4. Independent directors Chong Teck Sin, Wong Fook Choy Sunny and Douglas Owen Chester were to retire on 30 October 2024 under SGX tenure rules, with Ong Beng Hong, Gary Gray and Ambrose Law nominated; all three were elected at the AGM the next day. Lodged after the close.
The design-and-construct shiploader for a Western Australian port, due for handover in 2028, was described as not a material contract for ASX purposes. The company said tendering remained at historically high levels but that key project awards had slipped from H1 FY25 into H2 FY25, and that the order book remained above A$800m. This was the first statement in the window that activity would fall.
Guidance: Lower levels of activity during Q3 FY25 and potentially Q4 FY25 because of delays to key project awards.Same session: CVL −1.5% · ASX 200 +0.4% · peers +0.4%
Q1 2025
2 Jan 2025 – 31 Mar 2025
CVL −26.6%ASX 200 −3.9%Peer median +7.8%Range A$0.91–A$1.35Close A$0.92
Due diligence was described as positive and the parties were working with the Commonwealth on consent. The service-level agreement between Civmec Construction & Engineering and Luerssen Australia runs until the ownership transfer or the end of its term.
EBITDA fell 11.2% to A$52.9m and the EBITDA margin to 10.5% from 12.1%; gross profit fell 7.5% to A$55.8m (gross margin 11.1%) and administrative expenses rose 18.3%, which the company attributed to company fees, consultant fees and stamp duty for the change of domicile and a reclassification of support costs. Cash generated from operations was A$0.7m against A$111.2m on the timing of payments on key projects, with A$104.1m received from debtors in January 2025; operating activities used A$22.7m, cash fell to A$37.0m from A$88.5m and borrowings to A$60.0m from A$64.0m. The interim dividend was held at 2.5 cents. Priced opportunities were put at nearly A$12bn.
Guidance: A shift in market conditions delaying key awards was expected to produce lower activity in 2H FY25, with the potential to extend into 1H FY26; the Luerssen transfer was set for on or before 1 July 2025.Same session: CVL −13.1% · ASX 200 +0.2% · peers +0.6%
The Port Waratah shiploader (design, fabrication, preassembly, shipping and installation at the Kooragang Terminal) is due for handover in 2028, with a separate refurbishment of an existing shiploader during 2025. The Iluka contract covers 30 field-erected tanks and more than 11,000 cubic metres of concrete at the Eneabba rare-earths refinery, to complete in 2026. The maintenance work was secured in Q3 FY25.
Q3 EBITDA was A$19.2m at a 12.1% margin and the net margin was 5.1%. Nine-month revenue was A$661.3m with EBITDA of A$72.1m (10.9%) and NPAT of A$34.6m (5.2%); nine-month earnings per share were 6.8 cents. Net assets were A$505.8m, or 99.4 cents a share. The company said the delays it had flagged had materialised, and called 2H FY25 a transition period after several major projects completed earlier in the calendar year. Priced opportunities were put above A$13bn. The release printed no prior-year quarterly comparatives.
Guidance: Q4 revenue and earnings consistent with Q3; reduced activity in Q3 and Q4 with the potential to continue into 1H FY26.Same session: CVL +8.8% · ASX 200 +0.5% · peers +0.5%
Plant and equipment was valued at A$3.6m with no external valuation. NVL retains responsibility for liabilities, defects and claims up to the transfer date and keeps milestone payments earned before completion; a pre-agreed level of working capital stays in the business, and NVL supports the SEA1180 programme under a service-level agreement and a non-compete. Conditions include Commonwealth consent to the change of control, assignment of licences and IP, and no material adverse change. The business was to be renamed Civmec Defence Industries, and the company said it would deliver five OPVs over the next 3.5 years. ASX confirmed Listing Rule Chapter 11 did not apply.
The purchase was funded from existing cash. The workforce, engineering and training systems and supply chain transferred with the business to support the SEA1180 OPV programme, with a structured handover and technical collaboration from NVL.
Other awards were Rio Tinto's Cape Lambert Port A high-density-ores upgrade of six balance machines, to be installed across eight shutdowns in 2026; civils and SMPE&I for Fortescue's Christmas Creek Green Iron project; and preferred-proponent status, with Seymour Whyte and Aurecon, for the planning and design of the Perth Sporting and Entertainment Precinct, of which only the design stage was recognised in the order book. Lodged after the close; the reaction session is 24 July.
EBITDA was A$91.7m at an 11.3% margin and gross margin was steady at 11.5% on gross profit down 21.9% to A$92.9m. The second half was the trough: 2H revenue of A$307.7m was 38.8% below the first half and 2H NPAT was A$16.0m. Resources revenue fell 26.8% to A$641.2m with gross profit down 49.4% to A$48.9m; Energy more than doubled to A$65.2m; Infrastructure, Marine & Defence fell 17.3% to A$104.2m but its gross profit doubled to A$35.9m on profit recognised at completion of the Boorloo Bridge. Administrative expenses rose 10% on listing fees and domicile-related tax consulting. Cash generated from operations was A$97.8m, capex A$4.8m, cash A$102.9m and borrowings A$60.0m. The remaining SEA1180 work entered the order book with the Luerssen acquisition. Lodged after the close.
Guidance: Reduced activity in 1H FY26 remained the company's view, with an uplift in activity heading into 2H FY26; the Luerssen acquisition was expected to increase activity in the Infrastructure and Defence segment.Next session (29 Aug): CVL +3.4% · ASX 200 −0.1% · peers +0.8%
Large price moves
1524 Jul 2025 · +8% · index 0% · peers 0%
1615 Sep 2025 · +11% · index 0% · peers 0%
Q4 2025
1 Oct 2025 – 31 Dec 2025
CVL +6.9%ASX 200 −1.5%Peer median +17.8%Range A$1.34–A$1.48Close A$1.46
EBITDA was A$23.1m at a 12.1% margin. The release printed no prior-year comparatives; the Q1 FY25 update had reported revenue of A$262.7m and NPAT of A$15.2m. Luerssen Australia was renamed Civmec Defence Industries on 1 October 2025; the second OPV, NUSHIP Eyre, was accepted by the Commonwealth on 12 September and shipbuilding moved exclusively to Henderson, with the third vessel to launch on 31 October. The company said the Austal JV under the LAND8710 MOU was unlikely to proceed if the programme was built outside Civmec's Henderson facilities. Awards included the CSBP sodium cyanide project, a balance-machine upgrade running to end-2027 and a Fortescue process water tank.
Guidance: The previously expected reduction in activity in 1H FY26 was materialising, with an uplift in activity heading into 2H FY26 through early contractor involvement.Same session: CVL −1.4% · ASX 200 −0.5% · peers +1.7%
Large price moves
1722 Oct 2025 · +7% · index −1% · peers −2%
Q1 2026
2 Jan 2026 – 31 Mar 2026
CVL −0.4%ASX 200 −2.7%Peer median +4.4%Range A$1.43–A$1.75Close A$1.43
The PDP2 package covers earthworks, piling, dewatering and concrete for the sixth car dumper, which Civmec is also manufacturing at Henderson, and follows a roughly 700-tonne structural-steel package for the same project. Fortescue awarded charger facilities and pit power infrastructure at Eliwana and Flying Fish, and further maintenance contracts were secured in Port Hedland and Gladstone. The issuer document is dated 2 January 2026; the ASX lodgement was pre-open on 5 January.
EBITDA was A$46m and the net margin 5.6% against 5.3%; earnings per share were 4.21 cents. Group gross profit was A$44.9m, an 11.8% gross margin against 11.1%. Resources revenue fell to A$222.7m from A$406.9m, Energy rose to A$59.6m from A$28.1m and Infrastructure, Marine & Defence rose to A$98.1m from A$67.8m in the first half to consolidate Civmec Defence Industries, accounted for as a business combination at A$20.0m cash consideration. Cash was A$87.6m against A$102.9m at 30 June 2025 with A$60.0m of corporate market loan drawn; the bank facilities were consolidated into a A$160m revolving multi-option facility, 39.2% utilised, with all covenants met. Net assets were A$534.6m (A$1.05 a share). The interim dividend was held at 2.5 cents, fully franked, payable 10 April 2026.
Q3 EBITDA was A$27.8m. Nine-month revenue was A$624.7m with EBITDA of A$73.8m (11.8% margin), NPAT of A$34.9m (5.6%) and earnings per share of 6.86 cents. The order book figure includes the Perth Park alliance award for Main Roads WA. Awards in the quarter included a Chevron DE-PMP follow-on module package, the Woodside Blakemere manifold and the Yara 26 plant turnaround. The company noted that the National Defence Strategy of 16 April 2026 re-committed to all six Arafura-class OPVs, added A$1.0-1.5bn over ten years mainly for sustainment and confirmed a A$25bn envelope for the Henderson Defence Precinct. Kevin Deery retired from the board and as Chief Operating Officer after 17 years, staying on in an advisory capacity; the company described the handover as a completed multi-year succession.
The Iluka award extends Civmec's Eneabba rare-earths refinery scope from tanks and civils to the multidisciplinary installation works across the plant, supporting commissioning from mid-2027. The Civmec, Seymour Whyte and Aurecon alliance was awarded the major construction contract for Perth Park, expected to be substantially complete in late 2027; only Civmec's participating interest is recognised and it was already in the 15 May order-book figure. Further maintenance panel extensions and orders were secured in Port Hedland and Gladstone. The issuer document is dated 4 June 2026.
CVL −1.0%ASX 200 +3.5%Peer median +3.9%Range A$1.70–A$1.93Close A$1.93
Large price moves
261 Jul 2026 · −6% · index −1% · peers 0%
Notes and sources
Share price record
How this section was built
The detector flagged 26 large moves in the window — 20 single sessions and 6 weekly windows — before any news was read. 4 sector moves; 22 are left over after both controls, unexplained by them. Of those, 8 coincided with one in the same session or week and 14 have nothing filed against them beyond routine notices and are recorded as unexplained rather than explained away.
This section records the 36-month price history of the ASX line (CVL.AX, the primary listing since the change of domicile; the SGX line P9D trades the same company) and puts every large move through two subtractions and reports what is left over, not what caused it: first the S&P/ASX 200, then the median of three ASX-listed operating comparisons — Monadelphous, NRW Holdings and Southern Cross Electrical. “Left over” is what survives both controls, and it is the only column that can carry something the market and sector controls do not explain; it does not by itself say what caused the move.
Each quarter panel pairs two records. Key developments are the filings that carry information — results, quarterly updates, order-book and contract announcements, the change of domicile, the Luerssen acquisition, board and dividend events — with the figures as filed, the guidance given, the close on the day and how the reacting session traded against both controls; a filing lodged after the 10:00 open is read against the next session. Large price moves are the threshold-detected sessions from the price-driver register, each put through both controls.
How to read the tags.Market-wide and Sector-wide mean the index or the peer median moved with the share over the same session or week; Residual means the move is still large after both are subtracted. A residual is what is left over, not a cause: it does not establish that the company’s own news moved the price, and an unchanged or thinly traded price is not proof that no information arrived. Returns use the dividend-adjusted close; a filing released after the open is read against the next session.
Prices are a market-data vendor's daily series for CVL.AX (761 sessions from 22 August 2023 to 21 August 2026) on the dividend-adjusted close; the traded close is shown. Announcement dates, lodgement times and price-sensitivity flags are from the ASX company-announcement register for CVL, queried by year for 2023 to 2026 and cross-read against the issuer's announcement archive.
Limitations bound every row above. The announcement register enumerates the ASX company-announcement tape for CVL, queried by year for 2023 to 2026 and complete on that venue for 22 August 2023 to 21 August 2026, with the exchange lodgement time and price-sensitivity flag on every row; it was cross-read against the issuer's own announcement archive, which files releases under the document date rather than the lodgement date and omits exchange housekeeping. Civmec was SGX-primary with an ASX Foreign Exempt CDI line until the change of domicile took effect on 4 September 2024, so ASX rows before that date are re-lodgements of SGX releases, typically one calendar day later and often after the Australian close; the SGX release timestamps were not checked, and an SGX-only release with no ASX re-lodgement would not appear here. The acquired subsidiary Civmec Defence Industries (formerly Luerssen Australia) has no standalone filing stream, so only group disclosures and Commonwealth Defence programme releases are visible, and no channel beyond the exchange register and issuer archive was examined: broker research, substantial-holder crossing data and index-membership changes were not enumerated, which matters because six of the fourteen unexplained moves in the price-driver map fall on empty Civmec tape days at 4x to 22x median turnover. The sector control is three ASX peers (Monadelphous, NRW Holdings, Southern Cross Electrical); a three-name mean is moved by any single peer event, as on 15 June 2026 when SXE rose 19.9% on its own placement, so per-peer returns rather than the mean are used to decide a sector call.
A quarter shows only the columns it has. An empty developments column means: No filings beyond routine disclosures this quarter. An empty moves column means: No session cleared the large-move threshold this quarter.
The full move register — every large move and its market and sector controls
Every threshold-detected move in the window with its market and sector controls, dispositioned in the price-driver register; rows with a written note carry a numbered pin on the chart.
#
Session
CVL
ASX 200
Peers
Left over
Control result
What the evidence supports
1
24 Oct 2023
+7.7%
+0.2%
+0.6%
+7.1%
Residual
No announced cause identified. Civmec lodged no announcement on 23 or 24 October 2023; the ASX benchmark was +0.19% and the peer set +1.01% over the same session. Turnover was 17,941 shares, 0.26x the trailing median. Monadelphous +2.4 · NRW +0.0 · SCEE +0.6
2
20 Nov 2023
−7.1%
+0.1%
−0.4%
−6.7%
Residual
No announced cause identified. The nearest Civmec lodgements were the 2023 AGM minutes, a conversion of vested performance rights and an application for quotation of securities, all released after the close on 17 November 2023 and none flagged price sensitive. The benchmark returned +0.13% and the peer set -0.28% over the same window. The shares recovered to A$0.985 by 23 November 2023. Monadelphous +1.8 · NRW −0.4 · SCEE −2.2
3
23 Nov 2023
+7.7%
−0.6%
+0.0%
+7.7%
Residual
No announced cause identified. Civmec lodged no announcement between 17 November and 1 December 2023. The benchmark returned -0.62% and the peer set +0.04% over the same session, and turnover was 0.97x the trailing median. The close of A$0.985 returned the shares to within half a cent of the 17 November 2023 close. Monadelphous +0.7 · NRW +0.0 · SCEE −0.6
4
19 Jul 2024
+10.9%
−0.8%
−0.2%
+11.1%
Residual
No announced cause identified. Civmec lodged no announcement on 18 or 19 July 2024. The benchmark returned -0.81% and the peer set +1.02% over the same session. Turnover was 3.76x the trailing median. The Austal / Civmec LAND8710 Phase 2 memorandum of understanding was lodged five sessions later, on 24 July 2024, a session on which the shares closed 4.4% higher. Monadelphous −0.2 · NRW +4.1 · SCEE −0.9
5
week to 19 Jul 2024
+12.9%
+0.1%
−1.2%
+14.0%
Residual
No announced cause identified. No Civmec announcement was lodged between 12 and 19 July 2024. The benchmark returned +0.15% and the peer set +0.82% over the same week. Monadelphous −2.1 · NRW +5.8 · SCEE −1.2
6
8 Aug 2024
−7.6%
−0.2%
−0.2%
−7.4%
Residual
No announced cause identified. The only Civmec lodgement in the window was a procedural update on the second court hearing date for the change-of-domicile scheme, released at 2:34pm on 7 August 2024 and not flagged price sensitive. The benchmark returned -0.23% and the peer set -0.75% over the same session. Monadelphous −0.2 · NRW +0.6 · SCEE −2.7
7
9 Aug 2024
+6.7%
+1.2%
+1.3%
+5.4%
Residual
No announced cause identified. Civmec lodged no announcement on 8 or 9 August 2024. The benchmark returned +1.25% and the peer set +2.04% over the same session, and turnover was 0.73x the trailing median. Monadelphous +0.8 · NRW +1.3 · SCEE +4.0
8
week to 9 Aug 2024
−11.9%
−2.1%
−3.2%
−8.7%
Residual
No announced cause identified. The week covers the global volatility episode of 5 August 2024: the benchmark returned -2.08% and the peer set -3.54%, against -11.90% for the shares. The only Civmec lodgements in the window were change-of-domicile scheme procedural items, none flagged price sensitive. Monadelphous −3.2 · NRW −4.6 · SCEE −2.9
9
14 Feb 2025
−13.1%
+0.2%
+0.6%
−13.7%
Residual
The session coincided with the release of Civmec's 1H FY2025 results, lodged with ASX at 8:19am AEDT on 14 February 2025 and flagged price sensitive. The release disclosed an order book of A$633 million at 31 December 2024. The shares closed 13.1% lower on 22.68x the trailing median volume, against a benchmark return of +0.19% and a peer set return of -0.05%. Monadelphous +1.2 · NRW +0.6 · SCEE −2.0
10
week to 14 Feb 2025
−18.1%
+0.5%
−1.7%
−16.4%
Residual
The week coincided with the release of Civmec's 1H FY2025 results on 14 February 2025. The shares fell 18.2% over the week against a benchmark return of +0.52% and a peer set return of -1.30%. Monadelphous +1.4 · NRW −1.7 · SCEE −3.5
11
7 Apr 2025
−7.2%
−4.2%
−5.8%
−1.5%
Sector-wide
The shares tracked a broad market fall. The benchmark returned -4.23% and the three peers -6.50%, -5.77% and -3.34% over the same session. Civmec lodged no announcement between 7 March and 6 May 2025. The close of A$0.835 is the low of the 36-month window. Monadelphous −6.5 · NRW −5.8 · SCEE −3.3
12
8 Apr 2025
+6.0%
+2.3%
+2.5%
+3.5%
Sector-wide
The shares tracked a broad market rebound. The benchmark returned +2.27% and the three peers +3.69%, +2.45% and +2.52% over the same session, against +5.99% for the shares. Turnover was 1.22x the trailing median and Civmec lodged no announcement in the period. Monadelphous +3.7 · NRW +2.4 · SCEE +2.5
13
9 May 2025
+8.8%
+0.5%
+0.5%
+8.3%
Residual
The session coincided with the release of Civmec's Q3 FY25 business update, lodged with ASX at 8:20am AEST on 9 May 2025 and flagged price sensitive. Three sessions earlier, on 6 May 2025, Civmec announced A$285 million of order-book additions. The shares closed 8.8% higher on 4.56x the trailing median volume, against a benchmark return of +0.48% and a peer set return of +0.37%. Monadelphous −0.1 · NRW +0.7 · SCEE +0.5
14
week to 9 May 2025
+15.9%
−0.1%
+2.7%
+13.2%
Residual
The week coincided with two price-sensitive Civmec releases: A$285 million of order-book additions announced on 6 May 2025 and the Q3 FY25 business update on 9 May 2025. The shares rose 15.9% over the week against a benchmark return of -0.08% and a peer set return of +2.93%. Monadelphous +2.4 · NRW +3.7 · SCEE +2.7
15
24 Jul 2025
+8.0%
−0.3%
+0.3%
+7.7%
Residual
The session coincided with Civmec's announcement that its order book had strengthened by over A$600 million, lodged with ASX at 7:26pm AEST on 23 July 2025 and flagged price sensitive. The shares closed 8.0% higher on 5.52x the trailing median volume, against a benchmark return of -0.32% and a peer set return of +0.36%. Monadelphous −0.9 · NRW +0.3 · SCEE +1.7
16
15 Sep 2025
+10.9%
−0.1%
+0.0%
+10.9%
Residual
No announced cause identified. Civmec lodged no announcement between 28 August and 30 September 2025. The benchmark returned -0.13% and the peer set +1.19% over the same session, and turnover was 12.52x the trailing median. The close of A$1.475 was 27% above the A$1.16 close on the day the FY2025 results were released. Monadelphous +0.0 · NRW +0.0 · SCEE +3.6
17
22 Oct 2025
+7.2%
−0.7%
−1.8%
+9.0%
Residual
No announced cause identified. The only Civmec lodgement on 22 October 2025 was the pre-AGM answers to shareholder questions, released at 6:59pm AEDT after the close of that session. The benchmark returned -0.71% and the peer set -1.77% over the same session, and turnover was 22.25x the trailing median. Monadelphous −1.8 · NRW −1.4 · SCEE −2.1
18
5 Jan 2026
+8.9%
+0.0%
+1.8%
+7.1%
Residual
The session coincided with Civmec's announcement of more than A$400 million of new contracts and extensions, lodged with ASX at 9:12am AEDT on 5 January 2026 and flagged price sensitive. The underlying issuer document is dated 2 January 2026. The shares closed 8.9% higher on 17.24x the trailing median volume, against a benchmark return of +0.01% and a peer set return of +1.24%. Monadelphous +1.8 · NRW +2.4 · SCEE −0.4
19
week to 9 Jan 2026
+14.0%
−0.1%
+2.3%
+11.7%
Residual
The week coincided with Civmec's announcement of more than A$400 million of new contracts and extensions on 5 January 2026. The shares rose 14.0% over the week against a benchmark return of -0.11% and a peer set return of +0.75%. Monadelphous +2.3 · NRW +3.1 · SCEE −3.2
20
6 Feb 2026
−6.2%
−2.0%
−3.9%
−2.3%
Sector-wide
The shares tracked a falling market and sector. The benchmark returned -2.03% and the three peers -3.85%, -4.58% and -2.60% over the same session, against -6.15% for the shares. Civmec lodged no announcement between 5 January and 13 February 2026. Monadelphous −3.9 · NRW −4.6 · SCEE −2.6
21
20 Feb 2026
+6.4%
−0.1%
−0.7%
+7.2%
Residual
No announced cause identified. Civmec lodged no announcement between 13 February and 15 May 2026. Over the same session the benchmark returned -0.05% and the three peers +3.43%, -0.75% and -1.45%. Turnover was 14.63x the trailing median. The week containing this session is recorded separately as MV022. Monadelphous −0.7 · NRW +3.4 · SCEE −1.4
22
week to 20 Feb 2026
+11.2%
+1.8%
+16.8%
−5.6%
Sector-wide
The week tracked a sharp sector re-rating. The benchmark returned +1.84% and the three peers +4.63%, +16.79% and +19.72%, against +11.22% for the shares - a return below the peer average. Civmec's 1H FY2026 results had been released before the week opened, on the morning of 13 February 2026, a session on which the shares closed 0.3% higher. Monadelphous +4.6 · NRW +16.8 · SCEE +19.7
23
29 Apr 2026
+5.3%
−0.3%
−0.5%
+5.8%
Residual
No announced cause identified. Civmec lodged no announcement between 13 February and 15 May 2026. The benchmark returned -0.27% and the peer set +0.55% over the same session, and turnover was 5.73x the trailing median. Monadelphous −0.6 · NRW −0.5 · SCEE +2.8
24
15 May 2026
+6.5%
−0.1%
+0.5%
+6.0%
Residual
The session coincided with the release of Civmec's Q3 FY26 business update, lodged with ASX at 8:18am AEST on 15 May 2026 and flagged price sensitive, which disclosed an order book of A$1.3 billion. The shares closed 6.5% higher on 4.02x the trailing median volume, against a benchmark return of -0.11% and a peer set return of +0.63%. Monadelphous +0.5 · NRW +1.9 · SCEE −0.5
25
16 Jun 2026
+5.0%
+0.0%
+0.3%
+4.7%
Residual
No announced cause identified. Civmec lodged no announcement between 5 June and 7 August 2026. The benchmark returned +0.04% over the session; among the peers SXE rose 19.90% on its own new-works and equity-raising announcements, while MND fell 1.93% and NWH rose 0.28%. Turnover in Civmec was 20.08x the trailing median. The window high of A$1.995 was set the following session, on 17 June 2026. Monadelphous −1.9 · NRW +0.3 · SCEE +19.9
26
1 Jul 2026
−5.6%
−0.6%
+0.4%
−6.0%
Residual
No announced cause identified. Civmec lodged no announcement between 5 June and 7 August 2026. The benchmark returned -0.64% over the session and the peers +0.61%, +0.40% and -5.56%. Turnover was 6.26x the trailing median. The session was the first of the Australian financial year beginning 1 July 2026. Monadelphous +0.6 · NRW +0.4 · SCEE −5.6
27 Oct 2023 · Proposed change of domicile: implementation agreement to move the parent from Singapore to a new Australian company on a 1-for-1 share exchange, targeted for June 2024.Corporate actionReaction (next session, 30 Oct): CVL +3.8% · ASX 200 −0.8% · peers −1.2% · 0.5× median volumeSource: ASX announcement, 27 Oct 2023 (re-lodgement of the SGX release, 20:30 AEDT)
30 Oct 2023 · Q1 FY24 business update: revenue up 7.3% to A$245.1m and NPAT up 7.3% to A$15.2m; order book A$1.1bn, up 17.9%.Business updateReaction (next session, 31 Oct): CVL +3.6% · ASX 200 +0.1% · peers −1.6% · 1.3× median volumeSource: ASX announcement, 30 Oct 2023 (re-lodgement of the SGX release, 20:16 AEDT)
10 May 2024 · Q3 FY24 business update: revenue up 37.6% to A$258.3m and NPAT up 16.9% to A$17.1m; order book down to about A$821m after the Navy cut its OPV requirement from 12 to six.Business updateReaction (same session): CVL +3.4% · ASX 200 +0.4% · peers +0.7% · 9.8× median volumeSource: ASX announcement, 10 May 2024 (issuer release dated 9 May 2024)
2 Jul 2024 · Contract awards: approximately A$174m of contracts and scope extensions, led by a new shiploader for the Dalrymple Bay Terminal.Contracts / order bookReaction (same session): CVL +0.0% · ASX 200 −0.4% · peers −0.2% · 7.9× median volumeSource: ASX announcement, 2 Jul 2024 (issuer release dated 1 Jul 2024)
24 Jul 2024 · LAND8710 Phase 2: memorandum of understanding with Austal to form a joint venture to tender for the Army's Landing Craft Heavy programme.Corporate actionReaction (same session): CVL +4.4% · ASX 200 −0.1% · peers +0.7% · 10.9× median volumeSource: ASX announcement, 24 Jul 2024
2 Aug 2024 · Scheme meeting: the change-of-domicile resolution passed with 99.91% of shares voted in favour (299,041,436 for, 254,864 against).Corporate actionReaction (same session): CVL +1.6% · ASX 200 −2.1% · peers −2.7% · 5.6× median volumeSource: ASX announcement, 2 Aug 2024 (meeting held 1 Aug 2024)
7 Aug 2024 · Scheme timetable: the court hearing for approval of the scheme was re-fixed to 28 August 2024 from 3 September 2024.Corporate actionThe 7 August PDF in the pack is an image without extractable text; the re-fixed date is taken from the 27 August record-date notice, which restates it.Source: ASX announcement, 7 Aug 2024 · Notice of record date, ASX, 27 Aug 2024
15 Oct 2024 · Luerssen Australia: non-binding heads of agreement with NVL to transfer 100% of the SEA1180 Offshore Patrol Vessel prime contractor to Civmec.Corporate actionReaction (next session, 16 Oct): CVL +0.0% · ASX 200 −0.4% · peers −3.0% · 3.3× median volumeSource: ASX announcement, 15 Oct 2024 (20:19 AEDT)
29 Oct 2024 · Q1 FY25 business update: revenue up 7.2% to A$262.7m and NPAT flat at A$15.2m; order book over A$800m; all three independent directors to retire at the AGM.Business updateReaction (next session, 30 Oct): CVL +2.6% · ASX 200 −0.8% · peers +0.7% · 3.4× median volumeSource: ASX announcement, 29 Oct 2024 (20:23 AEDT) · Results of AGM, ASX, 30 Oct 2024
14 Nov 2024 · Shiploader award of A$90-100m and FY25 outlook: delays to key awards expected to lower activity in Q3 FY25 and potentially Q4 FY25.Business updateReaction (same session): CVL −1.5% · ASX 200 +0.4% · peers +0.4% · 5.0× median volumeSource: ASX announcement, 14 Nov 2024 (issuer release dated 13 Nov 2024)
13 Jan 2025 · Luerssen Australia: transfer date revised to on or before 1 July 2025; service-level agreement lets Civmec start shipbuilding work on the OPVs on a do-and-charge basis.Corporate actionReaction (same session): CVL −0.8% · ASX 200 −1.2% · peers −2.1% · 0.9× median volumeSource: ASX announcement, 13 Jan 2025 (issuer release dated 10 Jan 2025)
6 May 2025 · Order book bolstered by approximately A$285m: a new Port Waratah shiploader, Iluka Eneabba tanks and civils, and over A$40m of maintenance work.Contracts / order bookReaction (same session): CVL +2.9% · ASX 200 −0.1% · peers +1.8% · 2.2× median volumeSource: ASX announcement, 6 May 2025 (issuer release dated 5 May 2025)
9 May 2025 · Q3 FY25 business update: quarterly revenue A$158.5m and NPAT A$8.0m; order book over A$760m, a net rise of A$127m in the quarter.Business updateReaction (same session): CVL +8.8% · ASX 200 +0.5% · peers +0.5% · 2.0× median volumeSource: ASX announcement, 9 May 2025 (issuer release dated 8 May 2025)
26 Jun 2025 · Binding agreement to acquire 100% of Luerssen Australia for A$20m cash, funded from existing reserves, with completion targeted for 1 July 2025.Corporate actionReaction (same session): CVL +4.3% · ASX 200 −0.1% · peers −0.2% · 2.7× median volumeSource: ASX announcement, 26 Jun 2025
2 Jul 2025 · Luerssen Australia acquisition completed on 1 July 2025; the business becomes Civmec Defence Industries.Corporate actionReaction (same session): CVL +4.9% · ASX 200 +0.7% · peers −1.0% · 3.2× median volumeSource: ASX announcement, 2 Jul 2025 (issuer release dated 1 Jul 2025)
23 Jul 2025 · Order book strengthened by over A$600m, including the remaining SEA1180 programme added after the Luerssen acquisition.Contracts / order bookReaction (next session, 24 Jul): CVL +8.0% · ASX 200 −0.3% · peers +0.3% · 3.5× median volumeSource: ASX announcement, 23 Jul 2025 (19:26 AEST)
28 Aug 2025 · FY2025 results: revenue down 21.6% to A$810.6m and NPAT down 34.0% to A$42.5m; dividend held at 6.0 cents; order book over A$1.25bn at 31 July 2025 from A$0.6bn in January.ResultsReaction (next session, 29 Aug): CVL +3.4% · ASX 200 −0.1% · peers +0.8% · 6.8× median volumeSource: ASX announcement, 28 Aug 2025 (Appendix 4E lodged 19:12 AEST) · Media release, 28 Aug 2025
30 Oct 2025 · Q1 FY26 business update: revenue A$190.4m and NPAT A$10.5m (5.5% margin); order book over A$1.15bn at 30 September 2025.Business updateReaction (same session): CVL −1.4% · ASX 200 −0.5% · peers +1.7% · 1.8× median volumeSource: ASX announcement, 30 Oct 2025 (issuer release dated 29 Oct 2025)
5 Jan 2026 · Contract awards exceeding A$400m, to be delivered across 2H FY26 and FY27, led by BHP's Port Debottlenecking Project 2 civils at Nelson Point.Contracts / order bookReaction (same session): CVL +8.9% · ASX 200 +0.0% · peers +1.8% · 6.3× median volumeSource: ASX announcement, 5 Jan 2026 (issuer release dated 2 Jan 2026; lodged 09:12 AEDT)
15 May 2026 · Q3 FY26 business update: quarterly revenue A$244.2m and NPAT A$13.5m; order book A$1.3bn against A$760m a year earlier; COO Kevin Deery retires from the board.Business updateReaction (same session): CVL +6.5% · ASX 200 −0.1% · peers +0.5% · 1.7× median volumeSource: ASX announcement, 15 May 2026
5 Jun 2026 · Order book reaches a record A$1.5bn on new awards for delivery across FY27 and FY28, including the Iluka Eneabba SMPE&I package and the Perth Park construction contract.Contracts / order bookReaction (same session): CVL +0.9% · ASX 200 −0.7% · peers −2.3% · 2.9× median volumeSource: ASX announcement, 5 Jun 2026 (issuer release dated 4 Jun 2026)
What you can watch yourself
Every other test on this page waits for the company to file. These do not. Each row is a series you can look up yourself, free, today — with its latest recorded value and date, source, and limitations. Market-price context is not a company-specific operating trigger.
Read the Iron Ore headline and the observation date in its summary, in USD per metric tonne. The publisher describes a CFD tracking a 62% Fe China-import CFR Tianjin reference; this is not an official SGX or CME settlement. Trading Economics (CFD-based market reference)
Last recorded
97.24 US$/t, 2026-09-23
Threshold status
No calibrated operating threshold; No verified historical comparison retained.
How often to look
weekly (the series prints daily)
What it points to. Iron ore prices provide context for resource clients' prospective capital spending. They do not establish whether a client will approve a project or award work to Civmec.
Direction only — this pack does not carry a coefficient from this series to reported earnings.
What it cannot tell you. Civmec is a contractor, not an iron ore producer. This quote does not measure client price decks, financing, project approvals, contract cancellations or conversion of the order book into cash. It is not a direct indicator for defence and infrastructure work. The 10 September 2026 correction withdraws the former watch/alert bands because their benchmark and client-capex calibration were not established; assess new awards and the next order-book disclosure instead.
Settled by the next quarterly order-book update, due 2026-11-30. Lead time: long and uneven: a capex decision reaches an award over quarters, and an award reaches revenue over years.
Watchlist reviewed on 2026-09-24; each observation has its own date above. This watchlist date does not change the company research cutoff. A series moving past a level is a reason to re-read the case, not a recommendation. The same series across every company covered: what you can watch.
Notes and sources
Questions the filings do not answer
How large was the FY2025 Boorloo Bridge recognition release? Management names the cause and never sizes it. Without it, the FY2025 earnings base cannot be put on a comparable footing with FY2024 or FY2026.
How much of the order book converts within twelve months? One statement exists, from FY2020, and it is qualitative (“over half”). No conversion profile has been published since, and the definitional basis has changed at least twice.
What are the exact facility maturities, covenant definitions and available cash? Public filings state that covenants are met and disclose gross limits and utilisation, but not a complete maturity ladder, numerical covenant headroom, minimum operating cash or all draw and security conditions.
What is the fixed-versus-variable split of the Henderson cost base? Resources revenue fell 26.8% in FY2025 and its gross profit fell 49.4%. How much of that gearing is structural is not derivable from the disclosure.
What does steel now cost Civmec, as a share of the job? The 2012 prospectus disclosed steel at 23.8%, 20.0% and 28.6% of total cost of sales in FP2010, FY2011 and 1Q2012, with concrete a further 1–6% and labour about 32%. The issuer stopped disclosing this after listing. For a fixed-price contractor that is a material input exposure which can no longer be tracked from the accounts, and it is a candidate partial explanation for margin movements the commentary attributes to activity levels alone.
What is Civmec’s disclosed role in SEA3000? The company now owns the OPV prime contractor. Australia’s general-purpose frigate programme is the obvious adjacency, and the filings say nothing about it.
On what pattern will the A$22.195m acquired contract liability be released? The interim statements said straight-line over four years from acquisition. The FY2026 accounts recognise none of it, leave the carrying amount unchanged, and say management “will continue to assess the appropriate timing and pattern of release as the contract progresses”. No basis, trigger or expected profile is given. This is a known future non-cash credit of A$22.195m whose timing is now entirely undisclosed, against FY2026 profit to owners of A$52.1m.
How much of the A$514.9m receivable and contract-asset book is the Commonwealth pass-through, at 30 June 2026? A$128.315m of receivables and the identical amount of payables came in with the acquisition, and A$92.8m of the payable was still outstanding at 31 December 2025. The FY2026 accounts disclose A$125.278m receivable from the Commonwealth and A$81.371m payable to NVL at 30 June 2026; their A$43.907m difference is a balance-sheet difference, not by itself a cash loss or an explanation of operating cash flow. Without it the working-capital movement cannot be split between pass-through gross-up and genuine trading absorption, and that split is the whole question raised by a negative operating cash flow.
How is “net tangible asset backing per ordinary security” computed? Item 9 of the Appendix 4E gives 135.42 cents at 30 June 2026 and 121.52 cents at 30 June 2025. Both exceed net asset value per share on the same dates — 116.06 and 104.37 cents — which a tangible-assets measure struck off the same equity cannot do. The figure appears to add back deferred tax, but the issuer publishes no definition and it does not reconcile to the balance sheet. It is recorded here as disclosed and is not used anywhere on this page.
Why is the order book measured at 31 July? Neither the FY2025 nor the FY2026 result publishes a 30 June order book; both give a figure a month later. The comparison the reader most wants — closing book against closing balance sheet — is therefore not available in either year, and the A$1.4bn at 31 July 2026 is A$100m below the A$1.5bn stated on 4 June 2026 without the movement being explained.
Download
A print-ready PDF of this page, for reading away from the screen: Civmec evidence library (PDF). It carries the same content as this page — as-filed history, segment economics, the order book, the balance sheet, cash conversion, the credit view and open questions — and the same omissions: no rating, no fair value, no forecast.
This page is built from Civmec’s own filings: fifteen annual reports covering FY2012 to FY2026 (complete since listing), the full-year and half-year results announcements from FY2012 to FY2026, the 1H FY2026 Appendix 4D and media release of 12 February 2026, the Q3 FY2026 business update of 15 May 2026, the order-book announcement of 4 June 2026, the Luerssen Australia acquisition announcements of 26 June and 1 July 2025, and the complete FY2026 results set dated 27 August by the issuer and lodged on the ASX tape at 07:45 AEST on 28 August 2026 — Appendix 4E, condensed statements for the six months and full year, audited report of the directors and financial statements, media release, investor presentation and notice of record date.
Retrieval notes. The FY2013 annual report is served as a zero-byte file by the issuer’s own website; it was recovered from the Internet Archive instead. The 2012 IPO prospectus was also recovered from the Internet Archive (359 pages) after an earlier attempt failed against an archive.org outage; its disclosures are used in the concentration and input-cost sections above.
A separate revision and methodology note records in full how this page was built, every error found in the first two versions, how each was found, and what was corrected. It contains no investment opinion.
Update and corrections, 28 August 2026 — the FY2026 result. Civmec’s issuer documents are dated 27 August 2026; the official ASX tape lodged them at 07:45 AEST on 28 August. This page was refreshed against the complete primary package. Every table, chart and ratio above now carries FY2026; the information cutoff moved from 20 August to the 28 August ASX lodgement. Three published statements changed, and all three are recorded rather than quietly overwritten:
The acquired contract liability was not released. The interim statements’ stated four-year straight-line policy was not applied in FY2026. The derived A$5.5m annual credit, and the A$2.8m restatement of the 1H FY2026 gross margin published here on 18 August, are both withdrawn. Set out in full in the acquisition section above.
The freehold revaluation excess is restated on the note’s own basis. The 30 June 2025 excess over historical cost was published here as A$254.9m and 55.3% of the class. That could not be reproduced from the note’s two columns; both years are now given on the FY2026 note’s basis — A$252.8m and 55.7% at 30 June 2026, A$208.1m and 50.3% at 30 June 2025.
The facility description was out of date. This page still described an A$86m corporate-loan limit stepping down A$2m a quarter alongside a separate A$70m multi-option facility. Those were consolidated during FY2026 into one A$160m revolving multi-option limit with no step-down, which the 1H FY2026 statements had already disclosed. Corrected in the funding section.
Two things this page said before the result, and which the result confirmed, are left standing with their original dates so they can be scored: that the FY2025 Resources margin of 7.6% was “a trough, not a new level” (it came in at 11.5%), and that the Infrastructure, Marine & Defence segment’s underlying margin was near 11.6% against the 34.5% FY2025 print (it came in at 11.0%). One neutral credit watchpoint — negative operating cash flow alongside rising contract assets or receivables — triggered, and is recorded as triggered in the credit section.
The 90-second video summary above predates the result and has not been re-recorded. The price-and-developments section below carries filings to 4 June 2026 and does not yet include the FY2026 package lodged on 28 August 2026.
Corrections made after publication. This page was first published on 17 August 2026 and revised on 18 August 2026 following an independent blind review of the underlying pack, which returned 37 findings including six of the highest severity. Each was verified against the primary filing before correction. The material changes to this page were: the order-book trough (published as A$760m at 31 March 2025, corrected to A$633m at 31 December 2024, and the increase from 97% to 137%); the EBITDA basis (the profit-and-loss finance-cost line excluded lease interest booked in cost of sales, understating FY2025 EBITDA by A$3.8m and overstating interest cover); a statement that the Luerssen purchase-price allocation had not been disclosed, when it had been on 12 February 2026; and the FY2018 implied exchange rate. The 1H FY2026 segment note and the acquisition note were added, having been overlooked in the first build.
Second round of corrections, 18 August 2026. A further independent review — this one guided rather than blind, meaning the reviewer was pointed at the areas the author believed weakest — returned sixteen findings, two of the highest severity. Both were re-derived from the primary filing before acceptance and both held. The changes affecting this page were:
The single-facility claim was wrong. This page described Civmec as operating “nearly all of it out of one 79,000 m² facility”. The issuer discloses a 70,000 m² hall on a 200,000 m² site at Henderson rated at 80,000 tonnes a year, plus a 227,000 m² facility at Tomago near Newcastle rated at a further 25,000 tonnes, with newer sites at Port Hedland and Gladstone. Corrected above.
The segment-assets statement was too absolute and the note was misquoted. Corrected in section 2, with the correction stated there rather than only here.
Free float. Where a derived figure of roughly 60% was used, the issuer’s own statement is that approximately 54% of issued shares are in public hands (AR-FY2025, printed p114). The issuer figure is now used.
Board turnover now carries the issuer’s stated reason. The simultaneous retirement of all three independent non-executive directors on 30 October 2024 was described without their explanation. The FY2025 directors’ report states the retirements were “to ensure compliance with tenure requirements under the SGX Listing Rules” and that a transitional period existed during which the incoming independent directors had already joined the Board. That materially changes how the event reads, and it should have been quoted the first time.
A joint-auditor change was never disclosed here. Moore Australia Audit (WA) and Moore Stephens LLP were appointed joint auditors following the change of domicile, with FY2025 fees of A$313,000. It is now stated.
Depreciation. An average quoted as A$18.4m is A$18.1m across FY2021–FY2025; A$18.4m was a single year’s figure carried into a sentence about an average.
1H FY2026 margin. The half-year gross margin of 11.8% was described as achieved without a one-off. It was restated here as including approximately A$2.8m of release from the acquired Luerssen contract liability, giving approximately 11.1% excluding it. That restatement has itself been withdrawn on 27 August 2026: the FY2026 accounts recognise no release of that liability in FY2026, so the 11.8% stands as reported. See the correction in the acquisition section above.
Two of these — the facility description and the board-turnover framing — had been published on this page and were read by anyone who visited before 18 August 2026. Neither reviewer is independent of the author’s model family, which is a real limitation on how much assurance these passes provide, and is stated rather than argued away.
Corrections made during the build. Five transcription errors were caught by arithmetic identity checks before publication and corrected against the filings: a missing share-of-joint-venture line in FY2018, a missing other-expenses line in FY2019, a missing other-credits line in FY2023, an income-tax-receivable balance attributed to the wrong year across FY2024/FY2025, and a wrong non-controlling-interest balance in FY2022. Each was re-derived from the filing’s own subtotals. They are listed with their evidence in the working pack.
This page is an evidence library with independent public credit analysis. It contains no public letter rating, fair value, forecast or scenario migration register, and it is not a recommendation or personalised financial advice. Figures labelled derived are computed from reported figures with the computation stated.
Reader questions & corrections
Ask about this company, challenge a source or suggest a factual correction. Only selected questions that SMID Research has reviewed and answered are published.
Submissions are private by default. Your email is encrypted and never published. Please do not send confidential or inside information, allegations about individuals, promotions, or requests for personalised investment advice.
Behind the lock
A complete private working view of this company exists beyond this page: the full initiation note as a PDF, the extended financial and credit model workbook with live formulas, the presentation deck, the private shadow credit band and scenario migration work, and the independent-review artifacts. It is maintained in the author's vault for the author's own records — not published, and not available for sharing. This page carries everything that is public.
These bounded retrospective corrections clarify specific published facts or calculations. They retain each report's existing research cutoff and do not represent a full refresh or a finding that all possible issues are resolved.
Civmec Limited
Verified Fact. FY2026 disclosures identify an A$125.278m Commonwealth receivable and A$81.371m payable to NVL at 30 June 2026, and a facility expiry of 31 January 2028 subject to possible bank extension. Source basis: FY2026 audited filing notes 11, 20 and 21. Limitation: The balance difference does not by itself establish a cash loss or covenant headroom.
Transcripts
Find available event transcripts in the transcript library.
· Admission and Commencement of Quotation - Civmec Australia Limited · SGX
· Updates in Relation to the Proposed Change of Domicile of the Head Company of the Group from Civmec Limited (Domiciled in Singapore) to Civmec Australia Limited (Domiciled in Australia) · SGX
· Civmec Results of Shareholder Scheme Meeting · SGX
· Civmec executes Memorandum of Understanding (MOU) in support of Australian Army's future LAND8710 Phase 2, Landing Craft Heavy (LC-H) project · SGX
· Civmec Awarded A$174 million of Contracts and Scope Extensions · SGX
· Condensed Interim Financial Statements for the Six Months Ended 31 December 2023 · SGX
· The Proposed Change of Domicile of the Head Company of the Group from Civmec Limited (Domiciled in Singapore) to Civmec Australia Limited (Domiciled in Australia) · SGX
Titles are from the linked SGX filing, with common words abbreviated. Summaries are written by AI and may contain inaccuracies; refer to the original announcement. Items after 28 August 2026 are not reflected in this page's analysis; earlier items are listed for reference, may not be discussed in it, and may have been updated by later announcements.