Singapore · Co-living, hospitality and property operations
SGX: W8W · Information cut-off 28 August 2026
Investor snapshot
Business model
Coliwoo earns room rent from owned and master-leased sites and fees from managed properties, with very different capital risk beneath each model.
Latest figures
At 30 June 2026 it had 3,568 secured rooms, 2,547 operating rooms and 93.7% reported occupancy; at 31 March bank debt was S$265.4m, lease liabilities S$33.4m and group cash equivalents S$80.0m.
Main risk
The central risk is that refurbishment spending, secured debt and an undisclosed ten-year Middle Road rent consume more cash than occupancy growth produces.
Next proof
The next test is final Middle Road lease economics plus the opening cost and occupancy ramp of Loyang and Changi.
What mattersOpened rooms and like-for-like occupancy test demand; cash and lease terms decide resilience. Secured rooms more than doubled since FY2022, but 1,021 of the 3,568 secured rooms were still under renovation at 30 June 2026. Growth has also raised property capex and debt. The proposed Middle Road sale supports the asset evidence, while the undisclosed 10-year rent prevents a clean read-through to recurring cash flow.
Secured rooms3,5682,547 operating; 1,021 under renovation
Bank debtS$265.4m31 Mar 2026; excludes S$10m holdco amount
Group cash equivalentsS$80.0mafter restricted deposits; upstreamability unproven
Middle RoadS$134mproposed sale price
Evidence balance
The live questionDo rooms opened under owned and master-leased models generate enough after-rent cash to service the debt and head rent that funded them?Revenue rose in 1HFY2026 and occupancy by operating model was reported for 3QFY2026, yet the undisclosed Middle Road rent that follows the proposed sale keeps the after-rent cash effect unreadable from filed evidence.
What improved
In 1HFY2026 revenue rose 16.6% to S$26.9m and adjusted PATMI rose 13.9% to S$8.6m; secured rooms stood at 3,568 with 2,547 operating, and 3QFY2026 occupancy was 95.0% on leased and 99.6% on managed properties.
What became more demanding
At 31 March 2026 bank debt was S$265.4m and lease liabilities S$33.4m against S$231.2m of equity, while 1,021 of the 3,568 secured rooms were still under renovation and owned-property occupancy was 80.8% in 3QFY2026.
Strongest alternative explanation
The low owned reading could be ramp timing rather than model economics: the owned book had reported 94.7% in FY2025 and the fall reflects the March opening of the 212-room Midtown property, which the issuer said had reached close to 90% in July, consistent with an incomplete opening ramp.
The decisive missing fact
The initial annual rent, escalation formula and fixed-charge covenant under the Middle Road master lease, plus final capex, opening timetable and expected occupancy ramp for Loyang and Changi, would settle it.
Drawn from the evidence on this page: the improvement, the constraint, the benign reading and the fact that would settle it. It states no view on the shares.
About the private research record
Also on file behind the private view 🔒 (author-only): retained sources, an editable integrated equity/credit model, private valuation, committee deck and verification logs. No rating, fair value, expected return or forecast is reproduced on this public page.
On this page
Business anatomy · where revenue and profit come from
One stay experience, three different property-risk models
Coliwoo refurbishes and operates accommodation, but ownership, master leases and management contracts put capital and fixed-charge risk in different hands.
Compare the business or contract models; each card names its operating role and economic consequence.
Contract modelOwned property
Buy, refurbish, operate
What happensColiwoo acquires and finances a property, converts it into rooms and retains the underlying asset risk.
Risk and returnResidents pay room rent; Coliwoo carries property capital and operating costs.
Contract modelMaster lease
Lease, fit out, fill
What happensA landlord supplies the building; Coliwoo commits to head rent, fits out the site and fills the rooms.
Risk and returnRoom rent is earned after the fixed head-rent obligation.
Contract modelManagement contract
Run the owner’s site
What happensThe owner keeps more property capital at risk while Coliwoo supplies the brand and operating platform.
Risk and returnThe property owner pays a management fee or agreed share.
Revenue driverCommon front end
Sell the stay
What happensAcross all three models, the operating work is to refurbish, market, fill and service accommodation for residents.
Revenue driverOccupancy and room yield drive revenue, but the risk beneath that revenue differs by contract.
Original SMID Research comic. AI-assisted, analyst-directed monochrome artwork depicts the evidenced operating steps of Coliwoo Holdings Limited; deterministic captions and dated mix figures state the economics using issuer disclosures available to 2026-08-28. The drawings are representative—not issuer artwork, an exact product or site design, a statement of scale, or a company forecast.
Investor translation
What matters after the operating picture
Four questions connect the business model to cash and balance-sheet risk. This is a factual reading aid, not a valuation or recommendation.
Value lever
Occupancy and room yield, with more earnings from management contracts that use less property capital.
Cash bottleneck
Property purchases, fit-out and fixed head rent arrive before new rooms mature.
Balance-sheet pressure
Cash after lease payments and committed funding cannot carry the development and room pipeline.
Next proof
Mature-site occupancy, room yield, owner cash and returns by owned, leased and managed model.
Text version of this comic
Contract model · Buy, refurbish, operate Coliwoo acquires and finances a property, converts it into rooms and retains the underlying asset risk. Risk and return: Residents pay room rent; Coliwoo carries property capital and operating costs.
Contract model · Lease, fit out, fill A landlord supplies the building; Coliwoo commits to head rent, fits out the site and fills the rooms. Risk and return: Room rent is earned after the fixed head-rent obligation.
Contract model · Run the owner’s site The owner keeps more property capital at risk while Coliwoo supplies the brand and operating platform. Risk and return: The property owner pays a management fee or agreed share.
Revenue driver · Sell the stay Across all three models, the operating work is to refurbish, market, fill and service accommodation for residents. Revenue driver: Occupancy and room yield drive revenue, but the risk beneath that revenue differs by contract.
1. What the business is
Coliwoo sources underused properties, refurbishes them into furnished rooms, attracts tenants through direct digital channels, agents and online travel platforms, and operates the accommodation. At 30 June 2026, 1,136 rooms were owned, 1,907 were master-leased and 525 were managed. Owned rooms carry property and financing risk; leased rooms carry fixed head-rent risk; managed rooms are fee-led and less capital intensive.
Model
Rooms
How it earns
Principal risk
Owned
1,136
Room rent plus potential property value uplift
Acquisition debt, refurbishment and fair-value volatility
Leased
1,907
Room revenue less master-lease rent and operating costs
Fixed-charge operating leverage and renewal terms
Managed
525
Management fees
Lower revenue per room and contract retention
2. Operating evidence
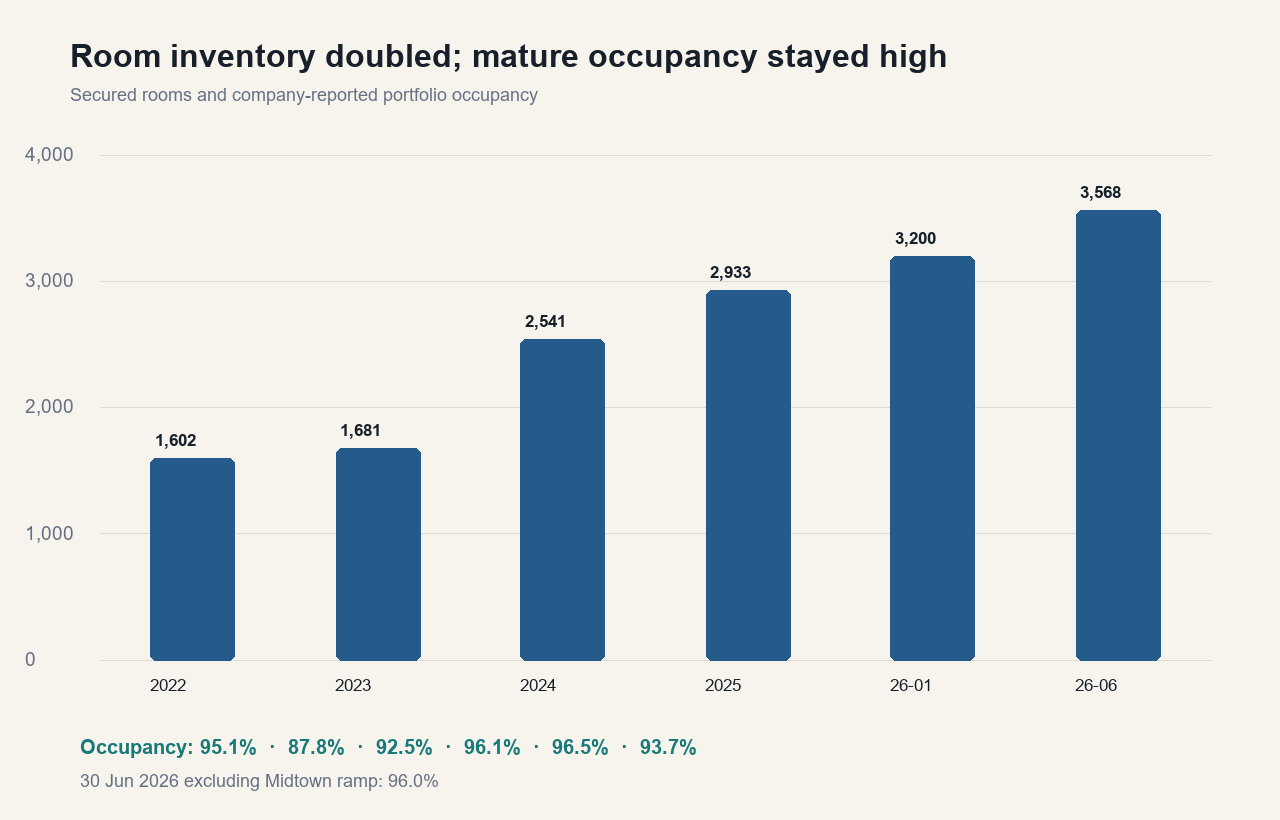
Secured room count increased from 1,602 in FY2022 to 3,568 by June 2026. Of the June total, 2,547 rooms were in operation and 1,021 were under renovation. Portfolio occupancy was 93.7%, or 96.0% excluding the ramp-up at the newly opened 212-room Midtown property. These measures are not directly comparable: renovation rooms are excluded from the occupancy denominator, while the prospectus assigns 100% occupancy to specified fixed-fee managed and third-party fixed-rent categories.
Source: prospectus and 3QFY2026 business update.Source: prospectus, FY2025 annual report and results release. Core PATMI is company-defined.
3. Financial history and earnings quality
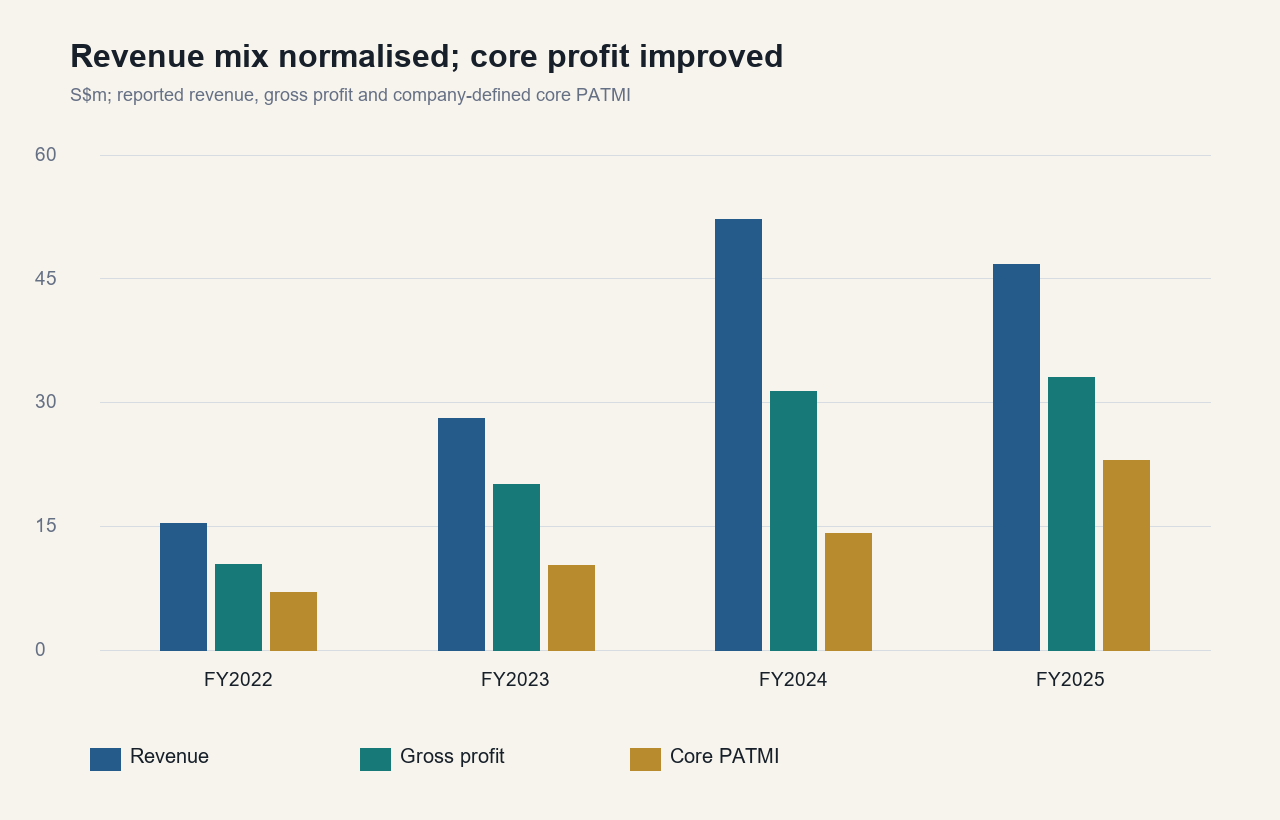
FY2025 revenue fell 10.4% to S$46.7m because a one-off, low-margin facilities retrofit did not repeat. Gross profit nevertheless rose 5.5% to S$33.1m and company-defined core PATMI rose 62.6% to S$22.9m. Reported PATMI was S$15.0m after investment-property revaluation losses and listing expense. In 1HFY2026, revenue rose 16.6% to S$26.9m and adjusted PATMI rose 13.9% to S$8.6m.
Reported profit needs normalization: investment-property revaluations, gains from finance subleases, disposal gains, listing expense and joint-venture revaluations can dominate the statutory line. Operating cash flow was positive at S$24.8m in FY2025 and S$11.5m in 1HFY2026, but expansionary property investment was much larger.
4. Capital structure and credit evidence
Source: FY2025 annual report and 1HFY2026 filing.
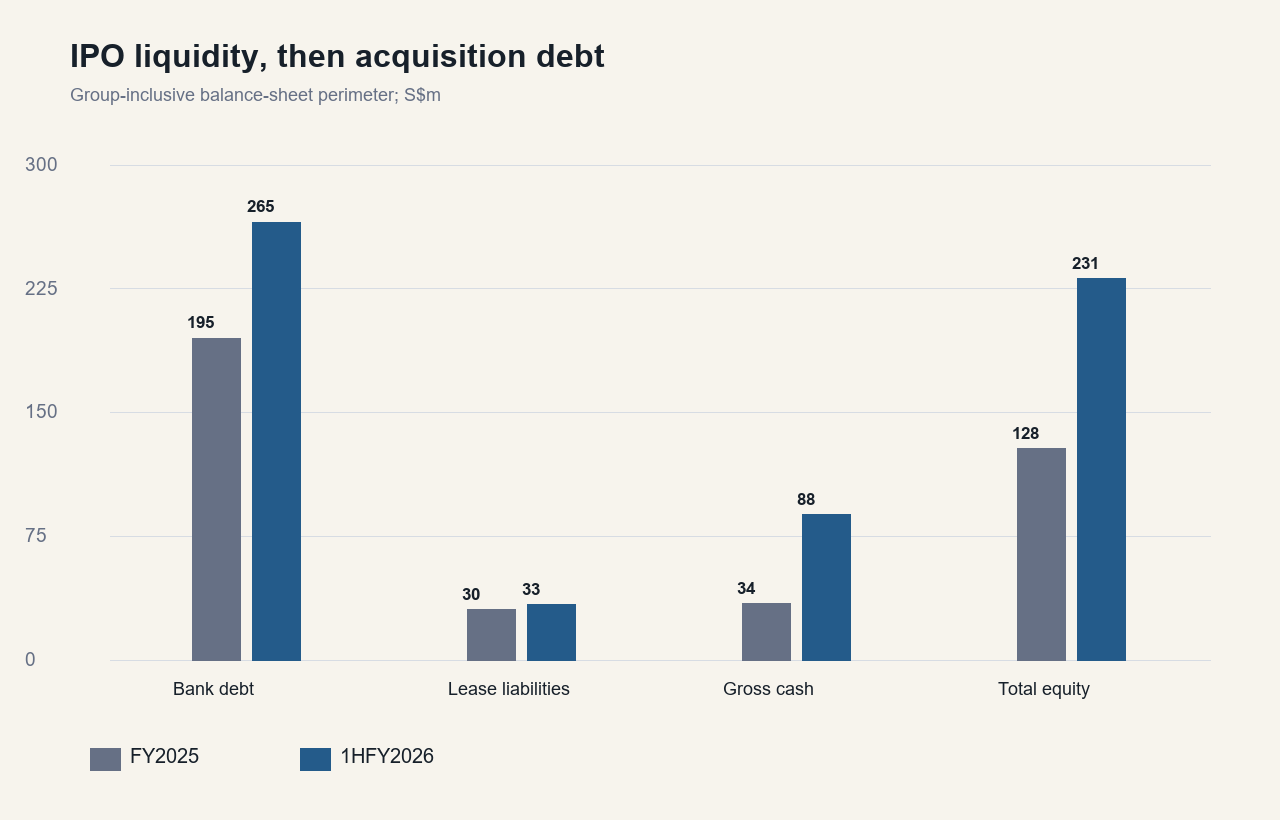
At 31 March 2026, bank debt was S$265.4m, lease liabilities were S$33.4m and an additional S$10.0m was due to the immediate holding company, against S$231.2m of equity. Group cash equivalents were S$80.0m after excluding restricted deposits; legal-entity accessibility and upstreamability are not disclosed. About S$363.3m, or 84.8%, of investment property was mortgaged. An indicative adjusted interest-cover calculation is about 5.8x after removing fair-value, disposal and associate/JV items; future Middle Road rent is not included.
The public evidence is mixed: IPO liquidity, positive operating cash flow and property collateral sit against acquisition and refurbishment cash needs, a large secured creditor perimeter, parent guarantees during transition and undisclosed covenant thresholds. Covenant headroom cannot be calculated from the filed information.
5. Middle Road is the hinge transaction
Coliwoo proposes to sell the 212-room property for S$134m and lease it back for ten years. The March 2026 book value was S$124.5m; the company estimates a S$9.2m gross gain and S$41m of net proceeds after expenses and debt repayment. Shareholder approval and other conditions remain outstanding at the cut-off. The buyer disclosed annual rent indexation from the second anniversary, but not the initial rent, indexation formula or fixed-charge coverage; the recurring cash-flow effect therefore cannot yet be evaluated from public evidence.
6. What comes next
Project
Rooms
Status / issuer guidance
Model
159 Jalan Loyang Besar
380
Operations commenced July 2026
master lease
2 Changi Business Park Avenue 1
368
1QFY2027 guidance as at 25 Aug 2026
owned leasehold
1 King George's Avenue
153
4QFY2027 guidance as at 25 Aug 2026
50:50 joint venture
50 Armenian Street
120
1QFY2028 guidance as at 25 Aug 2026
owned
The company aims to add at least 800 rooms a year over three years. Delivery—not secured inventory—is the key observable: opening date, final capex, rooms available and occupancy ramp.
7. Risks and disconfirming evidence
Middle Road rent or escalation leaves fixed-charge cover weaker than the debt reduction implies.
Loyang or Changi opens late, above budget or at a slow occupancy ramp.
Portfolio occupancy falls below 90% for more than one reporting period.
Restricted cash, entity ring-fencing or covenant definitions make consolidated liquidity less available than it appears.
Property cap rates rise, reversing fair-value gains and reducing collateral cover.
Management contracts and related-party support prove less durable outside the parent ecosystem.
8. Questions that would change the view
What are the initial annual rent, escalation formula and fixed-charge covenant under the 10-year Middle Road master lease?
How much of the S$93m difference between sale price and net proceeds is debt repayment versus transaction cost and tax?
Please disclose covenant definitions, thresholds and tested headroom by facility.
What is the final capex and opening timetable for Loyang and Changi, and what occupancy ramp is expected in the first six months?
How much cash is unrestricted and freely upstreamable at each material borrowing entity?
9. How the listed group was assembled
Coliwoo Holdings was incorporated in September 2020, but the listed perimeter was assembled immediately before the November 2025 IPO. On 27 August 2025 the company acquired Coliwoo Property Management from LHN Group for a deemed S$0.797m, paid with 796,777 new shares. It also acquired Coliwoo Investments and two subsidiaries for a deemed S$17.533m, paid with 17,533,351 shares. One day earlier, S$45.0m of loans owed to the immediate holding company had been converted into 45.0m shares. The resulting 63,330,129 shares were subdivided into 312.5m shares on 26 September without changing share capital; the company became a public company on 8 October and began trading on the SGX Mainboard on 6 November 2025.
This sequence matters when reading the historical accounts. The operating businesses and properties existed before the listing, but the pre-IPO statements are combined statements for a perimeter reconstructed under common control. They are not the unbroken consolidated history of a listed company that had always held the same subsidiaries. The IPO then issued 168.3m new shares, taking the post-offering count to 480.8m; LHN Group retained the entire 312.5m pre-IPO block.
Source: 1HFY2026 financial statements, Note 1.1 and Note 16; FY2025 annual report, Note 1; Coliwoo final prospectus dated 28 October 2025.
10. Secured rooms, operating rooms and occupancy are different measures
The six reported checkpoints show that the secured portfolio grew in steps rather than at a steady rate. The count rose from 1,602 rooms at September 2022 to 2,933 at September 2025, then to 3,200 in January 2026 and 3,568 by March. It did not increase in the June quarter. Renovation inventory, however, rose from 714 rooms at September 2025 to 865 in January and 1,021 by March, where it also remained in June. The gap between secured and operating rooms therefore widened even as the headline portfolio expanded.
Portfolio bridge as filed
Reporting date
Secured rooms
Rooms under renovation
Operating rooms
What changed
30 Sep 2022
1,602
not stated here
not rebuilt
15 properties
30 Sep 2023
1,681
not stated here
not rebuilt
17 properties
30 Sep 2024
2,541
not stated here
not rebuilt
25 properties
30 Sep 2025
2,933
714
2,219
25 properties
31 Jan 2026
3,200
865
2,335
27 properties
31 Mar 2026
3,568
1,021
2,547
28 properties
30 Jun 2026
3,568
1,021
2,547
unchanged from March
Operating-model occupancy shows where the ramp sits. In 3QFY2026, owned properties reported 80.8% occupancy, leased properties 95.0% and managed properties 99.6%, producing the 93.7% portfolio average. The owned book had reported 94.7% in FY2025; the subsequent fall reflects the March opening of the 212-room Midtown property, which the issuer said had reached close to 90% in July. Renovation rooms are excluded from the occupancy denominator. The prospectus also assigns 100% occupancy to specified fixed-rent third-party and fixed-fee managed properties, so the portfolio average is not simply occupied resident rooms divided by every secured room.
Average occupancy by operating model
Period
Owned
Leased
Managed
Portfolio
FY2022
73.0%
97.3%
n.a.
95.1%
FY2023
86.6%
88.0%
n.a.
87.8%
FY2024
87.9%
93.4%
90.5%
92.5%
FY2025
94.7%
95.6%
99.0%
96.1%
3QFY2026
80.8%
95.0%
99.6%
93.7%
Source: final prospectus, p.155; FY2025 results release, pp.2-3; 1QFY2026 and 3QFY2026 business updates. Operating rooms are derived as secured rooms less rooms under renovation where both figures were filed.
11. Four revenue streams explain the FY2025 comparison
The 10.4% fall in FY2025 revenue was not a broad fall in room demand. Facilities-services revenue dropped 77.2% because a one-time retrofit contract did not recur. At the same time, rental income from leased properties increased 4.9%, rental from owned properties increased 23.9%, and management-services revenue rose from S$0.569m to S$3.485m. The disappearance of a lower-margin retrofit also helped reported gross margin rise to 71% from 60%.
Revenue by analytical operating stream — S$000
Stream
FY2024
FY2025
Change
1HFY2025
1HFY2026
Change
Leased-property rental
30,933
32,434
+4.9%
15,999
19,144
+19.7%
Owned-property rental
6,024
7,461
+23.9%
3,772
3,716
-1.5%
Facilities services
14,612
3,330
-77.2%
1,665
1,683
+1.1%
Management services / fees
569
3,485
more than 100%
1,606
2,314
+44.1%
Other
16
23
+43.8%
11
13
+18.2%
Total
52,154
46,733
-10.4%
23,053
26,870
+16.6%
In the March 2026 half, leased rental and management fees carried the increase. Owned-property rental slipped despite the much larger owned-room count because newly secured owned rooms were still being refurbished or were only beginning to operate. These four streams are useful analytical categories from the issuer's revenue note; they are not presented here as four IFRS reportable segments.
Source: FY2025 results release, p.2; 1HFY2026 financial statements, Note 5 and financial review, p.17. Percentage changes are derived from the filed amounts unless the issuer printed the percentage.
12. Reported profit moves with property values and changing definitions of core
Property revaluation and non-operating items are large enough to change the direction of reported profit. FY2022 profit before tax of S$34.647m included a S$14.470m fair-value gain on investment property and S$12.082m of associate and joint-venture results. FY2023 carried a S$0.926m fair-value loss and a S$0.652m share of losses. FY2024 then carried a S$14.936m fair-value gain on investment property.
The issuer's FY2025 core-PATMI bridge started from S$22.920m, deducted a S$6.684m net fair-value loss, S$1.149m of IPO expenses and a S$0.040m disposal loss, and arrived at reported PATMI of S$15.047m. The prior year ran in the opposite direction: core PATMI of S$14.093m plus a S$16.880m fair-value gain produced S$30.973m of reported PATMI. In 1HFY2026 the investment-property line swung to a S$5.876m gain from a S$5.468m loss a year earlier, while the prior half's S$7.432m finance-sublease gain did not repeat.
The issuer also changed its adjusted definition. The 1HFY2026 business update excluded fair-value movements, the disposal gain and IPO expense, and amortised a finance-sublease gain over three years for comparability. That makes the disclosed adjusted series useful, but not identical through time and not a proxy for owner cash. The sharpest illustration is Middle Road: the transaction announcement says that the asset produced S$14.1m of net profit in the six months to March 2026, of which S$14.0m was fair-value movement.
Per-share evidence on changing share counts
Measure
Earlier period
Later period
Reading
Basic EPS, 1HFY2025 to 1HFY2026
2.99 cents
2.80 cents
PATMI rose, but weighted-average shares increased from 312.5m to 480.8m
FY2025 basic EPS
9.91 cents FY2024
4.82 cents FY2025
Both use the pre-offering 312.5m basis in the issuer comparison
Group NAV per share
40.30 cents Sep 2025
47.32 cents Mar 2026
Period-end measure on the then-current share base
Source: final prospectus, pp.109-110; FY2025 results release, p.1; 1HFY2026 financial statements, Notes 6 and 11; Middle Road transaction announcement dated 6 August 2026.
13. Gross interest, capitalised interest and cash location
The finance-cost line is net of interest capitalised into investment property. In 1HFY2026, gross interest was S$3.689m: S$3.007m on bank borrowings, S$0.444m on lease liabilities and S$0.238m on amounts owed to the holding company and non-controlling interests. S$1.344m was capitalised, leaving S$2.345m in the income statement. A cover ratio based only on the expensed line therefore omits 36% of the period's gross interest. The page's indicative 5.8x adjusted cover uses the net finance cost and also excludes the future Middle Road master rent, which had not been filed.
At 31 March 2026, group cash and deposits totalled S$87.894m before deducting S$7.936m of restricted and pledged balances, leaving S$79.958m of cash equivalents. The company-only balance sheet showed S$55.0m of fixed deposits and S$7.528m of cash at the listed parent, plus S$100.975m due from subsidiaries. This narrows the location question: a substantial part of reported liquidity sat at the parent on that date. It does not establish what cash was reserved by facility conditions, what subsidiaries could upstream, or how much of the intercompany receivable could be collected on demand. The proceeds table separately identifies S$2.889m placed into a debt-servicing reserve as a banking-facility condition precedent.
Source: 1HFY2026 financial statements, pp.4 and 7 and Notes 8 and 18. The 36% figure is S$1.344m divided by S$3.689m.
14. IPO proceeds: allocation and use by 6 May 2026
The IPO raised S$100.980m gross; the prospectus estimated S$96.213m after listing expenses. By the date of the 1HFY2026 filing, S$46.717m had been used and S$54.263m remained. The contrast between the two growth buckets is important: S$24.954m of the S$34.0m owned-and-joint-venture allocation had been used, while only S$4.687m of the S$40.0m leased-growth allocation had been used.
IPO proceeds at 6 May 2026 — S$000
Purpose
Allocated
Used
Balance
Leased-property growth
40,000
4,687
35,313
Owned and joint-venture growth
34,000
24,954
9,046
Loan repayment
12,000
6,848
5,152
Working capital
10,213
5,461
4,752
Listing expenses
4,767
4,767
0
Total
100,980
46,717
54,263
Of the S$5.461m working-capital use, S$2.889m funded the debt-servicing reserve, S$1.897m funded manpower and S$0.675m funded lease payments. The allocation table proves deployment, not the returns on that deployment; subsequent room openings, occupancy, cash rent and property cash flow are the tests.
15. The last complete facility map is the IPO snapshot
The final prospectus listed fifteen facilities with lender, borrower, guarantor, purpose, limit, utilisation, rate and maturity profile. At its latest practicable date, aggregate facilities were S$246.762m, S$206.969m was used and S$39.064m was unused. The schedule showed a recurring structural feature: contractual maturities were commonly three to seven years while some repayment profiles extended to 25 years. The difference creates refinancing events even when scheduled amortisation is long.
That is not a current maturity ladder. At 31 March 2026 the interim filing showed S$22.205m of bank borrowings due within one year and S$243.164m after one year, but did not repeat the fifteen-facility schedule. The filing therefore supports the current-versus-non-current split and the old facility architecture, not a claim that the old lender-by-lender headroom still applied.
The FY2025 annual report discloses the security and covenant types. Major borrowings with a carrying amount of S$163.612m were subject principally to minimum loan-to-value ratios for the respective properties and minimum net worth at group and relevant-subsidiary level. Security comprised mortgages over investment properties, corporate guarantees, assignment of rental proceeds and, where applicable, personal guarantees from non-controlling shareholders of partly owned subsidiaries. Interest rates ranged from 2.00% to 5.83% in FY2025. The thresholds are not filed, so tested covenant headroom cannot be reconstructed.
Borrowings, leases and disclosed security
Measure
30 Sep 2025
31 Mar 2026
Evidence limit
Bank borrowings due within one year
11.168m
22.205m
Current classification, not a daily liquidity schedule
Bank borrowings after one year
159.434m
243.164m
No current lender-by-lender maturity table
Lease liabilities
30.308m
33.386m
Recognised present value only
Mortgaged investment property
236.570m
363.271m
Carrying value, not recovery proceeds
The guarantor perimeter was also in transition. LHN Group guaranteed S$237.284m of subsidiary facilities and S$16.718m of associate and joint-venture facilities at FY2025. By 26 November 2025, S$49.945m of facilities had changed corporate guarantor from LHN Group to Coliwoo. The March interim note then described Coliwoo Holdings itself as the "immediate holding company" providing a guarantee, an apparent drafting anomaly because Coliwoo is the reporting issuer. The page records the wording rather than resolving it.
Source: final prospectus, pp.102-105; FY2025 annual report, Notes 29 and 33; 1HFY2026 financial statements, Notes 14 and 18.
16. Lease cash flows sit beside bank debt
Master-leased rooms were 53.4% of the June 2026 portfolio, so recognised lease debt is part of the operating model rather than an incidental accounting line. At FY2025, S$30.308m of lease liabilities was the present value of S$31.476m of gross minimum payments. Total cash outflow for leases was S$10.790m, up from S$9.611m. The group also disclosed S$33.120m of additional minimum undiscounted payments under extension options that were not included in lease liabilities because exercise was not considered reasonably certain.
Some properties also carry variable rent based on revenue above a threshold. Those payments are expensed when incurred and were S$0.787m in FY2025. Sublease income on right-of-use assets was S$30.619m. These numbers show why gross rental revenue, lease liability, cash rent and sublease income must not be treated as one measure. Any Middle Road master rent would enter the same fixed-charge stack, but its initial level, escalation, security and repair allocation were not in the transaction announcement.
17. Investment property is both the asset base and the largest accounting judgement
PwC issued an unmodified FY2025 audit opinion and identified valuation of investment properties as the sole key audit matter. Investment properties of S$283.507m, comprising S$236.570m of owned property and S$46.937m of leased right-of-use property, and a S$43.5m held-for-sale property represented 81% of FY2025 total assets, before the group's share of joint-venture property. The auditor noted that values depend on capitalisation and discount rates, market rents, occupancy and other assumptions.
Investment-property roll-forward — S$000
Movement
FY2025
1HFY2026
Opening balance
332,859
283,507
Property additions
6,887
115,337
Capitalised expenditure
19,664
23,525
Lease modifications
6,258
0
Derecognition to finance leases
(5,479)
0
Reclassified to held for sale
(43,500)
0
Disposal of subsidiary
(25,800)
0
Net fair-value movement
(7,382)
5,876
Closing balance
283,507
428,245
The accounting policy requires valuations at least annually based on highest and best use, using direct comparison, discounted cash flow, income capitalisation and residual-value methods. The significant inputs are developed in consultation with management and tested by external valuers. This does not make the valuations arbitrary; it does mean that reported profit, collateral value and leverage can move together when property assumptions change.
Source: FY2025 annual report, independent auditor's report and Note 14; 1HFY2026 financial statements, Note 14. The FY2025 movement columns sum to the filed closing balance.
18. Middle Road: what the filed contract establishes
On 6 August 2026, 80%-owned Coliwoo (TK) agreed a put-and-call arrangement to sell 141 Middle Road to DBS Trustee, as trustee of a trust wholly owned by CapitaLand Ascott Trust. Coliwoo Midtown would lease the property back for ten years after completion. The property is a six-storey, 212-room building with a basement car park on a 99-year lease that began in May 1978. Coliwoo acquired it in May 2024 and opened it in March 2026.
Savills valued the property at S$130.0m on 1 August 2026. The negotiated price was S$134.0m excluding GST, 3.1% above that valuation. The purchaser was to pay a 1% option fee and a further 4% deposit, together S$6.7m. If Building and Construction Authority approval for chiller-replacement works had not arrived by completion, the purchaser could retain 1.5% of the price until approval.
The conditions precedent were substantive: Coliwoo shareholder approval; Minister for Law approval under the Residential Property Act; remission of additional buyer's stamp duty and the residential-versus-non-residential buyer's-stamp-duty difference; seller's-stamp-duty remission; completion of repair and rectification work; and a Certificate of Statutory Completion. The buyer could also terminate for compulsory acquisition affecting at least 5% of the land, an unsatisfactory legal-requisition reply or material damage reducing value by more than 5% of the price.
Why the disposal required shareholder approval
SGX Rule 1006 basis
Relative figure
Filed input
Net asset value disposed / group NAV
53.9%
S$124.5m asset NAV at 31 Mar 2026
Net profit disposed / group net profit
80.2%
S$14.1m asset profit, including S$14.0m fair-value movement
Consideration / market capitalisation
53.9%
S$134.0m price against S$248.8m market capitalisation on the filed basis
All three tests exceeded the 20% major-transaction threshold. The announcement estimated S$41m of net proceeds after expenses and debt repayment and a S$9.2m gross gain, but it did not split the S$93m difference between sale price and net proceeds. More importantly, it did not disclose the initial master rent, indexation formula, deposit and security, maintenance and capital-expenditure allocation, early-termination liability or renewal terms. The disposal evidence is detailed; the recurring lease economics are not. Until the latter is filed, a lower property-debt balance cannot be translated into an after-rent cash benefit.
Source: proposed sale-and-leaseback announcement and clarification dated 6 August 2026. The 3.1% premium is derived as S$134m divided by S$130m less one.
19. Pasir Panjang shows what capital recycling means operationally
Middle Road was not the first sale-and-leaseback. The group agreed to dispose of Sky Bow Properties, owner of 404 Pasir Panjang Road, on an agreed property value of S$43.9m plus adjusted net asset value. The term sheet was signed in July 2025, the share sale agreement in December and completion occurred on 12 January 2026. The FY2025 annual report estimated a net gain of about S$0.3m; the interim accounts later recorded S$0.356m and S$15.584m of disposal proceeds.
The address then appeared in the June 2026 list of leased properties. Economically, an owned property left the balance sheet while the operating site remained in the room portfolio under a lease. That is the cleanest observable description of capital recycling here: asset-sale cash arrives once, while room income and a contractual head-rent obligation continue.
20. The LHN perimeter remains visible in operating costs and guarantees
Coliwoo continues to buy property-management, facilities, rental, renovation and financing inputs from entities connected with its controlling shareholder or with shareholders of partly owned subsidiaries. In 1HFY2026, a non-controlling shareholder charged S$4.781m of renovation work, up from S$2.628m a year earlier. The controlling shareholder charged S$0.654m of management fees and S$0.226m of interest; an associate of the controlling shareholder charged S$1.130m of facilities fees. Loans advanced to associates and joint ventures were S$7.299m.
The interested-person-transaction table names the operating counterparties, including LHN Properties Investments, Industrial & Commercial Facilities Management, LHN Group, Greenhub Suited Offices and Four Star Industries. Renovation spending is especially relevant because it is capitalised into investment property before that property is independently valued. The existence of an external valuation is an important control, but it does not remove the need to read the related-party cost base and valuation inputs together.
Control is concentrated. LHN Group owns 312.5m shares, exactly 65.0% of Coliwoo, and the FY2025 shareholder register said the public held about 34.95%. The top twenty shareholders held 95.65%. The five-person board was appointed on listing day; it includes LHN's executive chairman and LHN's chief financial officer. The guarantee migration described above and the FY2025 disclosure that chief-executive remuneration had been charged through the LHN management fee show why legal separation at listing did not immediately produce an economically self-contained cost and funding perimeter.
Source: FY2025 annual report, directors, shareholder and related-party notes; 1HFY2026 financial statements, Note 20 and interested-person-transaction table.
21. Dividends and management's own operating claims
The company has no fixed dividend policy. Its IPO statement was a non-binding intention to distribute at least 40% of profit attributable to shareholders after adding back listing expense and excluding fair-value movements, impairments and one-off items for FY2025 and FY2026. The FY2025 final dividend of 2.0 cents cost S$9.616m, about 42% of the S$22.920m company-defined core PATMI. A 1.0-cent interim dividend followed for 1HFY2026. Principal-bank covenants may restrict dividends without consent or waiver, so the stated intention is not the same as demonstrated distributable capacity.
At the January 2026 AGM, management said master-lease fit-out capital was typically recovered within three to four years, acquisitions were held over roughly ten to fifteen years, and master leases commonly ran in multiples of three years up to fifteen. These are issuer statements, not independently verified property-level returns. The same answers described total weighted cost of capital as "around 2.5%", while the annual report's bank-interest range was 2.00% to 5.83%. Different scopes may explain the difference; the filings do not provide the calculation needed to reconcile them.
Management also said it had considered ASEAN expansion but deferred it because Singapore-dollar strength made overseas entry less attractive, and that a REIT could be a longer-term progression with no immediate plan. Those statements help frame the strategy, but the next evidence remains property-level: actual fit-out spend, opening date, occupancy ramp, cash rent and financing terms.
Source: final prospectus, dividend section; FY2025 annual report, Note 31; 1HFY2026 financial statements, dividend note; minutes of the 29 January 2026 AGM published 27 February 2026.
22. The project pipeline has to be read against delivery
The November 2025 results release guided Midtown's 212 rooms for 2QFY2026 and Loyang's then-382 rooms for 3QFY2026. Midtown opened in March 2026, within the guided quarter. Loyang, now described as 380 rooms, began operations in July, one quarter later than the original label. The August update still displayed 3QFY2026 in its project table while the accompanying text said operations had commenced in July. The page records both filed statements rather than smoothing the timing difference.
Pipeline: earlier filing versus August 2026 update
Property
Earlier room count
Earlier timing
August room count
August status / issuer guidance
141 Middle Road
212
2QFY2026
212
opened March 2026
159 Jalan Loyang Besar
382
3QFY2026
380
operations commenced July 2026
2 Changi Business Park Avenue 1
more than 250
not in Nov table
368
1QFY2027 issuer guidance
1 King George's Avenue
to be confirmed
not stated
153
4QFY2027 issuer guidance
50 Armenian Street
120
1QFY2028
120
1QFY2028 issuer guidance
Changi shows why secured-room growth is not the same as completed capacity. The acquisition option was priced at S$101m for a property described as having more than 250 rooms and a 30-year renewal option. By August, the issuer said it was intensifying the site from 251 to 368 rooms before opening. King George's Avenue sits in a 50:50 joint venture that agreed to acquire the REHAU Building for S$40m, supported by S$35.7m of bank facilities with Coliwoo providing a proportionate guarantee. For each site, the useful reconciliation is acquisition or lease commitment to final spend, rooms opened, occupancy and cash contribution.
Source: FY2025 results release; FY2025 annual report, subsequent-events note; 1QFY2026 and 3QFY2026 business updates. Future dates are issuer guidance, not SMID forecasts.
23. One reportable segment, four analytical streams
The issuer reports one operating segment: co-living in Singapore. It does not publish separate model-level profit, assets, liabilities or capital expenditure, and it presents no geographical segment because the business is principally domestic. Owned, leased, managed and facilities-services rows on this page are therefore analytical revenue streams, not IFRS segments. Occupancy by operating model is the deepest recurring operating disaggregation in the filed set.
The segment note does disclose customer concentration. The largest customer contributed about 8.1% of pre-SFRS(I) 16 revenue in 1HFY2026, down from 10.2% a year earlier; the five largest contributed 17.7%, down from 21.5%. The issuer stated that no director, associate or shareholder with at least 5% had a beneficial interest in those five customers. This evidence bounds direct customer concentration, but it does not allocate customers or economics across the three property-risk models.
Source: 1HFY2026 financial statements, Notes 3 and 4.
24. Positive operating cash flow did not fund the property build
Operating cash flow was positive in each reported annual period: S$8.676m in FY2022, S$18.631m in FY2023, S$15.354m in FY2024 and S$24.800m in FY2025. The March 2026 half produced S$11.483m. That operating record sits beside much larger property cash flows. Cash additions to investment property were S$118.940m in FY2024, S$13.941m in FY2025 and S$121.661m in 1HFY2026, with another S$9.090m of refundable GST on the Changi acquisition in the half.
1HFY2026 cash bridge — S$000
Cash-flow line
Amount
Reading
Net cash from operations
11,483
positive operating inflow
Net cash used in investing
(122,633)
dominated by investment-property additions
IPO share proceeds
100,980
external equity funding
New bank borrowings
116,367
external debt funding
Bank-debt repayment
(21,794)
gross drawdown and repayment both matter
Lease principal
(6,314)
financing cash outflow
Interest paid
(2,015)
cash interest, separate from expensed finance cost
Dividends paid
(9,616)
FY2025 final dividend
Repayment to holding company
(10,000)
related-party financing outflow
Net increase in cash
51,883
after S$163.033m net financing inflow
The half therefore shows a growth balance sheet plainly: operating cash was positive, but investment outlay was financed primarily with IPO proceeds and new bank drawdowns. At 31 March a further S$7.929m of contracted capital expenditure had not yet been recognised. The question is not whether the business can report positive operating cash flow; it is whether opened properties can generate enough after-rent cash to service the enlarged fixed-charge stack without recurring external capital.
Source: final prospectus cash-flow history; FY2025 and 1HFY2026 cash-flow statements; 1HFY2026 Note 19. Annual operating-cash-flow figures are reported; explanatory comparisons are derived.
What you can watch yourself
Every other test on this page waits for the company to file. These do not. Each row is a series you can look up yourself, free, today — with the level this reading was built against, the levels that would put it in question, and what the series cannot tell you.
portfolio demand and ramp — nothing public to watch
Searched Singapore rental, hotel and serviced-apartment statistics for a free series at Coliwoo's perimeter. None separates flexible co-living rooms, renovation exclusions, fixed-fee managed occupancy or Coliwoo's project mix. National hotel or private-rental data would imply a transmission the issuer evidence does not support; the first honest observable is the company's own room and occupancy update.
sale-and-leaseback economics — nothing public to watch
Searched the transaction announcement, buyer disclosure and public property material for the Middle Road master-lease rent, escalation and fixed-charge terms. No external series can recover a private contract payment; the issuer's circular or completion disclosure is the resolving evidence.
Watchlist reviewed on 2026-08-28; each observation has its own date above. This watchlist date does not change the company research cutoff. A series moving past a level is a reason to re-read the case, not a recommendation. The same series across every company covered: what you can watch.
Download
A print-ready PDF of this page, for reading away from the screen: Coliwoo Holdings evidence library (PDF). It carries the same content as this page — the operating evidence, financial history and earnings quality, the capital structure and credit evidence, the Middle Road transaction, the pipeline, risks and open questions — and the same omissions: no rating, no fair value, no forecast.
The evidence library covers all 53 issuer-newsroom rows visible through pagination offsets 0, 20 and 40, plus the IPO prospectus, FY2025 annual report, 1HFY2026 financials, 3QFY2026 update and relevant LHN parent disclosures. Primary PDFs were retained and hashed. Load-bearing pages were read in full and spread into a shared equity-credit model. Market price, ratings, valuation and forecasts are deliberately absent from this public page.
Download the historical tables (CSV) or JSON. Research is AI-assisted and source-controlled. This is general research, not personal investment advice.
Reader questions & corrections
Ask about this company, challenge a source or suggest a factual correction. Only selected questions that SMID Research has reviewed and answered are published.
Submissions are private by default. Your email is encrypted and never published. Please do not send confidential or inside information, allegations about individuals, promotions, or requests for personalised investment advice.
Behind the lock The private vault contains the integrated working model, private committee conclusion, retained filing library and independent review records. It remains access-controlled and is not reproduced on this public page.
These bounded retrospective corrections clarify specific published facts or calculations. They retain each report's existing research cutoff and do not represent a full refresh or a finding that all possible issues are resolved.
Coliwoo Holdings Limited
Verified Fact. The S$283.507m investment-property balance comprises S$236.570m of owned property and S$46.937m of leased right-of-use property; the Middle Road lease has second-anniversary annual indexation. Source basis: FY2025 annual report note 14 and CapitaLand Ascott Trust release, 6 August 2026. Limitation: Initial rent and the escalation formula remain undisclosed.
Price & events
No dedicated price & events section is published on this company page.
Transcripts
Find available event transcripts in the transcript library.
· Proposed Disposal of Coliwoo RV1 and RV2 and Leaseback of 298 and 288 River Valley Road · SGX
· Completion of the sale of the Property at 141 Middle Road · SGX
· Proposed sale and leaseback - Exercise of option — AI summary: Purchaser exercised the Call Option on 29 September 2026 · SGX
· Poll Results of the EGM Held on 25 September 2026 · SGX
Earlier announcements, before 28 August 2026 (27)
· Coliwoo Maintains Resilient Occupancy Across Its 3,568-Room Portfolio in 3QFY2026; Recycles Capital via the Proposed Sale & Leaseback of Coliwoo Midtown · SGX
· Clarificatory Announcement in Relation to the Proposed Sale and Leaseback of the Property Located at 141 Middle Road Singapore 188976 · SGX
· Coliwoo Announces Proposed S$134 Million Sale and Leaseback of Coliwoo Midtown · SGX
· The Proposed Sale and Leaseback of the Property Located at 141 Middle Road Singapore 188976 · SGX
· Condensed Interim Financial Statement for the 6 Months Ended 31 March 2026 · SGX
· Profit Guidance for the Six Months Ended 31 March 2026 · SGX
· Completion of Acquisition of the Hotel Strata Lot Located at 2 Changi Business Park Avenue 1, Singapore 486015 — AI summary: Acquisition has been completed on 27 March 2026 · SGX
· Acquisition of the Hotel Strata Lot Located at 2 Changi Business Park Avenue 1, Singapore 486015 · SGX
· Coliwoo Secures Option to Acquire S$101 Million Hotel Asset for Co-living Expansion · SGX
· Acquisition of the Hotel Strata Lot Located at 2 Changi Business Park Avenue 1, Singapore 486015 · SGX
· Completion of Disposal of 80% Stake in Coliwoo Pp Pte. Ltd. · SGX
· Completion of Acquisition of Property by Joint Venture Company · SGX
· Coliwoo Announces Disposal of Subsidiary and Leaseback Arrangement · SGX
· Disposal of 80% Stake in Coliwoo Pp Pte. Ltd. · SGX
Titles are from the linked SGX filing, with common words abbreviated. Summaries are written by AI and may contain inaccuracies; refer to the original announcement. Items after 28 August 2026 are not reflected in this page's analysis; earlier items are listed for reference, may not be discussed in it, and may have been updated by later announcements.