Emperor Watch & Jewellery buys finished European luxury watches as a dealer and designs its own gold jewellery, then sells both from sixty-nine shops in Hong Kong, the Chinese Mainland, Macau, Singapore and Malaysia.
Latest figures
Revenue for the six months to 30 June 2026 rose 5.0% to HK$2,934.0m and profit attributable to owners rose 58.0% to HK$310.4m on a gross margin of 33.0% against 30.1%, while inventories rose to HK$3,488.7m, or 321 days of cost of sales, against HK$1,564.7m of net cash and no bank borrowings.
Main risk
The central risk is that 3.11 percentage points of the first-half margin gain has no disclosed cause and no territory split is published at the half year, so the largest single driver of the reported profit cannot be checked against anything the Group has filed.
Next proof
The next test is the FY2026 results announcement expected in March 2027, which carries the full-year gross margin, the inventory write-down inside cost of sales and the first territory margin split since Other Asia Pacific revenue fell 75.2%.
No public letter rating, no valuation.
Information cut-off: 3 September 2026. The latest financial statement in scope is the interim results announcement of 20 August 2026, for the six months to 30 June 2026; the 2026 interim report had not been filed at the cut-off, and the last audited accounts are those for the year to 31 December 2025.
Evidence balance
The live questionWhat lifted gross margin on brand-allocated watches and own-brand gold jewellery, and does the growing shelf stock still convert to cash?In the six months to 30 June 2026 the margin gain is the largest single movement in the half-year accounts, yet the issuer attributes it only to overall sales performance and publishes no territory split.
What improved
Revenue for the six months to 30 June 2026 rose 5.0% to HK$2,934.0m and profit attributable to owners rose 58.0% to HK$310.4m on a gross margin of 33.0% against 30.1%; stripping the shrinking territory, the three continuing territories grew segment profit 50.4%.
What became more demanding
Inventory rose HK$410.5m in the half against HK$140.4m of revenue growth, taking closing inventory from 282 to 321 days of cost of sales, while the Other Asia Pacific territory, previously the highest-margin one, fell 75.2%; no half-year cash-flow statement is filed.
Strongest alternative explanation
The build could be stocking new space rather than stalled turnover: the Group opened one Hong Kong multi-brand store and eight Mainland jewellery stores in the half, and a Rolex boutique on its own Canton Road building shortly after, so an investment reading is well supported though not proved.
The decisive missing fact
Territory gross margins at the half year, an ageing of the HK$3,488.7m inventory balance and any write-down by territory would settle it, together with a sentence on what the Other Asia Pacific business was and why it fell 75.2%.
Drawn from the evidence on this page: the improvement, the constraint, the benign reading and the fact that would settle it. It states no view on the shares.
About the private research record
Also on file for this company, and not published here: a separate access-controlled working record holding the analyst judgments, the forecast and valuation work, the review artifacts and the full source register. It remains private, access-controlled and outside this public page.
On this page
Business anatomy · from inputs to customer value
Allocated watches and bought gold become cash only when a shopper walks in
The Group owns no watch brand and makes no watch. It funds the stock, holds it on prime retail streets, and earns the difference between what the shelf cost and what the shopper pays.
Follow the operating chain from demand or inputs to customer outcome and cash.
InputsDealer supply
Buy the stock
What happensEuropean brands allocate watches to the Group as a dealer; gold is bought for its own jewellery brand.
Capital at workAllocation is granted by the brand, never bought outright.
Route to marketPrime streets
Stock the shops
What happensSixty-nine shops in Hong Kong, the Mainland, Macau, Singapore and Malaysia hold the stock on prime streets.
Revenue triggerRent and salespeople are fixed; the shelf turns about once a year.
Customer outcomeOver the counter
Sell to the shopper
What happensResidents and Mainland tourists buy a watch at the brand price, or jewellery priced off gold plus workmanship.
Who paysGross margin is set by the metal cost and the discount given.
Cash conversionTill to shelf
Turn stock into cash
What happensTakings settle supplier and gold-loan balances, fund new stock and new stores, and leave a dividend.
Cash triggerCash returns only as the shelf sells; a write-down destroys it.
Original SMID Research comic. AI-assisted, analyst-directed monochrome artwork depicts the evidenced operating steps of Emperor Watch & Jewellery; deterministic captions and dated mix figures state the economics using issuer disclosures available to 2026-09-03. The drawings are representative—not issuer artwork, an exact product or site design, a statement of scale, or a company forecast.
Investor translation
What matters after the operating picture
Four questions connect the business model to cash and balance-sheet risk. This is a factual reading aid, not a valuation or recommendation.
Value lever
Revenue per shop and the gross margin on brand-allocated watches and own-brand gold jewellery.
Cash bottleneck
Inventory: about a year of cost of sales sits on the shelf before a shopper buys it.
Balance-sheet pressure
No bank borrowings; gold loans and pledged deposits are the only funded lines.
Next proof
FY2026 results in March 2027: full-year gross margin, the write-down and the store count.
Text version of this comic
Inputs · Buy the stock European brands allocate watches to the Group as a dealer; gold is bought for its own jewellery brand. Capital at work: Allocation is granted by the brand, never bought outright.
Route to market · Stock the shops Sixty-nine shops in Hong Kong, the Mainland, Macau, Singapore and Malaysia hold the stock on prime streets. Revenue trigger: Rent and salespeople are fixed; the shelf turns about once a year.
Customer outcome · Sell to the shopper Residents and Mainland tourists buy a watch at the brand price, or jewellery priced off gold plus workmanship. Who pays: Gross margin is set by the metal cost and the discount given.
Cash conversion · Turn stock into cash Takings settle supplier and gold-loan balances, fund new stock and new stores, and leave a dividend. Cash trigger: Cash returns only as the shelf sells; a write-down destroys it.
What Emperor Watch & Jewellery does
Emperor Watch & Jewellery is a shopkeeper. It buys finished European luxury watches as an authorised dealer and resells them at retail; it designs and sells gold and gem-set jewellery under its own ‘Emperor Jewellery’ brand; and it does both from its own shops in Hong Kong, the Chinese Mainland, Macau, Singapore and Malaysia. It owns no watch brand and makes no watch. Rolex, Patek Philippe, Tudor and Cartier are the four brands the issuer names. Almost everything else on this page follows from that: the scarce assets are the dealerships and the prime-street leases, and the capital is the stock.
Revenue splits by product as well as by place. In FY2025, the year to 31 December 2025, watch retail supplied HK$3,492.4m and watch commission income HK$36.2m — 61.2% of group revenue between them. Jewellery retail supplied HK$2,123.6m and a new wholesale line to Mainland franchisees HK$113.2m, 38.8% together. The jewellery half is where the Group moves one step upstream: it owns the brand and designs the product. It is also the thinner half, priced off the gold price plus a workmanship charge, and it is where the store network is being rebuilt.
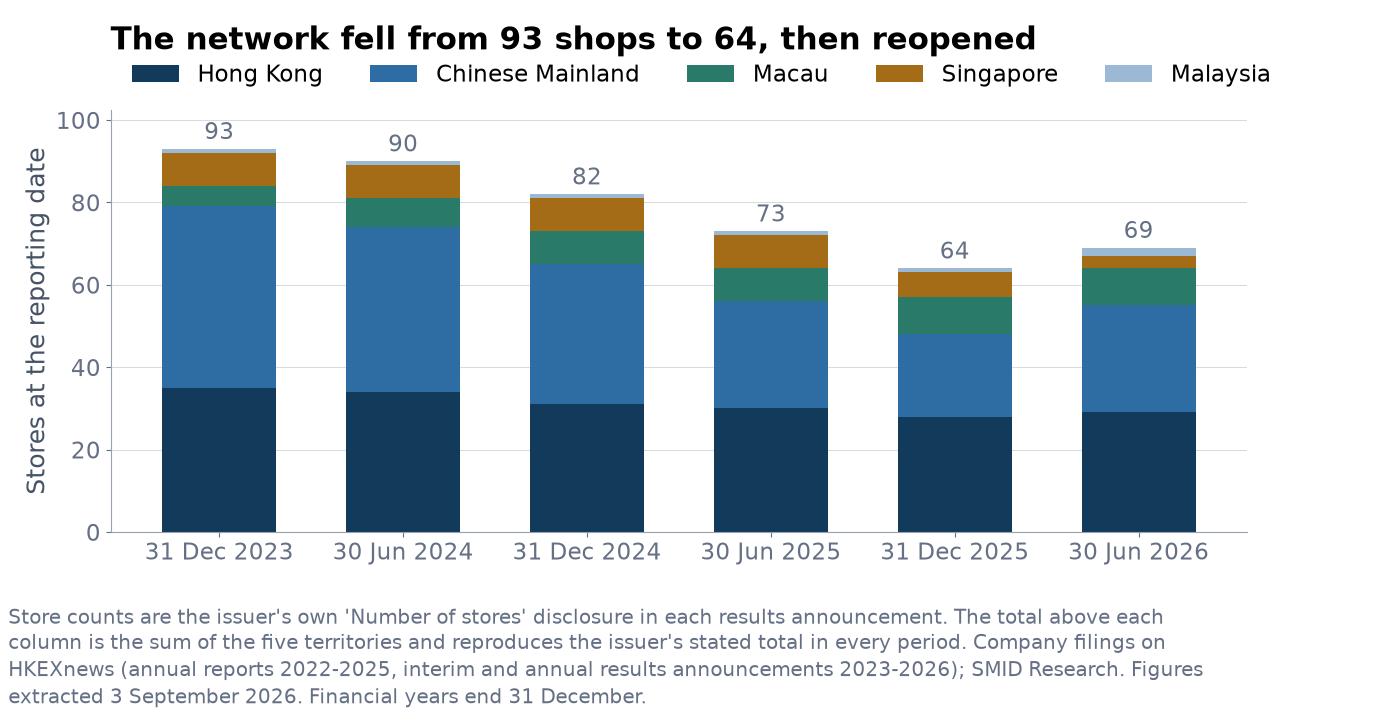
At 30 June 2026 the Group operated 69 shops: 29 in Hong Kong, 26 in the Chinese Mainland, nine in Macau, three in Singapore and two in Malaysia. Sixteen of the 26 Mainland stores are jewellery stores and nine of those sixteen are franchised. The Mainland jewellery business sits inside a joint venture formed in April 2025 in which the Group holds 51% and an outside partner, Xiaoduocai, holds 49%. Hong Kong includes a self-owned five-storey retail complex at 4–8 Canton Road, Tsim Sha Tsui, whose upper floors the Group bought from its controlling shareholder’s property arm in 2025.
Operating disclosure gap. The filings do not give revenue by brand, same-store sales, store-level profitability, the split of Mainland revenue between watch and jewellery or between own and franchised stores, or the terms and renewal dates of the watch dealerships that produce three-fifths of revenue. Growth therefore cannot be decomposed into volume, price and mix from the public record.
The four-year record, and what is not comparable in it
Revenue has risen in each of the last three years, from HK$3,684.3m in FY2022 to HK$5,765.3m in FY2025, a 56.5% increase. FY2022 itself was a fall: revenue was HK$3,926.6m in FY2021. Profit attributable to owners more than doubled over the same three years, from HK$222.1m to HK$458.4m, and the store network shrank from 93 shops at the end of FY2023 to 64 at the end of FY2025. Revenue per average store rose from HK$59.8m in FY2024 to HK$79.0m in FY2025 on that shrinking base.
HK$m unless stated, years to 31 December
FY2022
FY2023
FY2024
FY2025
Revenue
3,684.3
4,823.2
5,230.3
5,765.3
Gross profit
1,177.3
1,450.3
1,480.9
1,779.5
Gross margin
31.95%
30.07%
28.31%
30.87%
Inventory write-down inside cost of sales
—
—
122.7
50.0
Other gains and losses
(21.3)
(16.4)
(25.2)
(85.1)
Profit before taxation
277.2
367.7
317.0
531.4
Profit for the year
222.1
299.2
256.7
431.3
Profit attributable to owners
222.1
299.2
256.7
458.4
Basic earnings per share
3.28c
4.41c
3.79c
6.34c
Dividends declared per share
1.00c
1.32c
1.10c
1.69c
Payout of basic earnings
30.5%
29.9%
29.0%
26.7%
Net cash from operating activities
605.6
403.6
772.4
1,096.7
Inventories at 31 December
2,703.4
3,060.3
3,003.4
3,078.2
Cash, time deposits and pledged deposits
664.4
619.6
949.8
1,805.8
Gold loans
—
—
—
207.7
Equity attributable to owners
4,845.1
5,046.7
5,214.1
5,617.4
Stores at 31 December
—
93
82
64
Sources: annual reports 2022 to 2025 and the annual results announcements for FY2023, FY2024 and FY2025, all filed on HKEXnews. Figures are as reported. Dividends declared per share are the interim and final dividends declared for that financial year added together; the payout line divides that total by basic earnings per share and is arithmetic on the two rows above it. The inventory write-down is disclosed inside cost of sales for FY2024 and FY2025 only; dashes mark figures the filings read for this page do not carry. Profit for the year and profit attributable to owners diverge from FY2025 onwards because non-controlling interests appear for the first time in that year.
Three things in that table are not what they look like. FY2025’s two profit lines diverge for the first time. Profit for the year is HK$431.3m and profit attributable to owners is HK$458.4m, because non-controlling interests took a HK$27.1m loss — the outside 49% of the Mainland jewellery joint venture formed in April 2025. Before FY2025 there were no material non-controlling interests and the two lines were identical. FY2024 is a write-down year. HK$122.7m of inventory write-down sits inside that year’s cost of sales and 1.49 percentage points of the FY2025 margin improvement is simply its absence. And the FY2025 balance sheet moved for reasons that are not trading. Cash, time deposits and pledged deposits nearly doubled, but HK$210.5m of that is the outside partner’s subscription for its 49% of the joint venture and HK$79.3m is the net proceeds of a share placing; both are financing, not operating cash.
The first half of 2026: what the print actually says
The six months to 30 June 2026 are the most recent evidence on this page, and they are the reason the record above reads better at the profit line than at the revenue line.
HK$m unless stated, six months to 30 June
1H2025
1H2026
Change
Revenue
2,793.6
2,934.0
+5.0%
Gross profit
840.4
968.8
+15.3%
Gross margin
30.08%
33.02%
+2.94pp
Other gains and losses
(14.4)
24.5
+38.9
Profit before taxation
240.8
389.8
+61.9%
Profit for the period
194.3
317.7
+63.5%
Non-controlling interests
(2.2)
7.3
—
Profit attributable to owners
196.5
310.4
+58.0%
Basic earnings per share
2.73c
4.28c
+56.8%
Interim dividend per share
0.55c
0.90c
+63.6%
Stores at 30 June
73
69
−4
Source: interim results announcement of 20 August 2026 and the comparatives it carries. Percentage changes are arithmetic on the two columns. The 1H2025 comparative for basic earnings per share is the weighted average of 7,203,973,322 shares used in the 2026 announcement, not the 7,256,708,129 printed as the denominator in the 2025 announcement; see the corrections section below.
A quarter of the increase in profit before taxation is one line. Other gains and losses swung from a HK$14.4m loss to a HK$24.5m gain, a HK$38.9m swing against a HK$149.0m increase in profit before taxation. Of the HK$24.5m gain, HK$11.9m is a fair value gain on gold loans and HK$13.9m is a net exchange gain. Strip the whole line from both halves and profit before taxation grew 43.1% rather than 61.9%. Neither component is a trading result and neither is disclosed as recurring.
The issuer told the market a month early, and the market moved then. A positive profit alert filed on 21 July 2026 said net profit for the half would be not less than HK$310m; the reported figure was HK$317.7m, 2.5% above the stated floor. An alert filed on 27 January 2026 did the same thing for FY2025: a HK$420m floor against HK$431.3m reported, 2.7% above. Both alert figures, and both reported comparisons, are total profit for the period including non-controlling interests — that is the measure the alerts use, and it is not the measure the profit-attributable-to-owners line uses. The two reconcile through the non-controlling-interest line, which was a HK$7.3m profit in the half and a HK$27.1m loss in FY2025, so profit attributable to owners sits below total profit in the half and above it in FY2025.
Where the revenue comes from, and what stopped
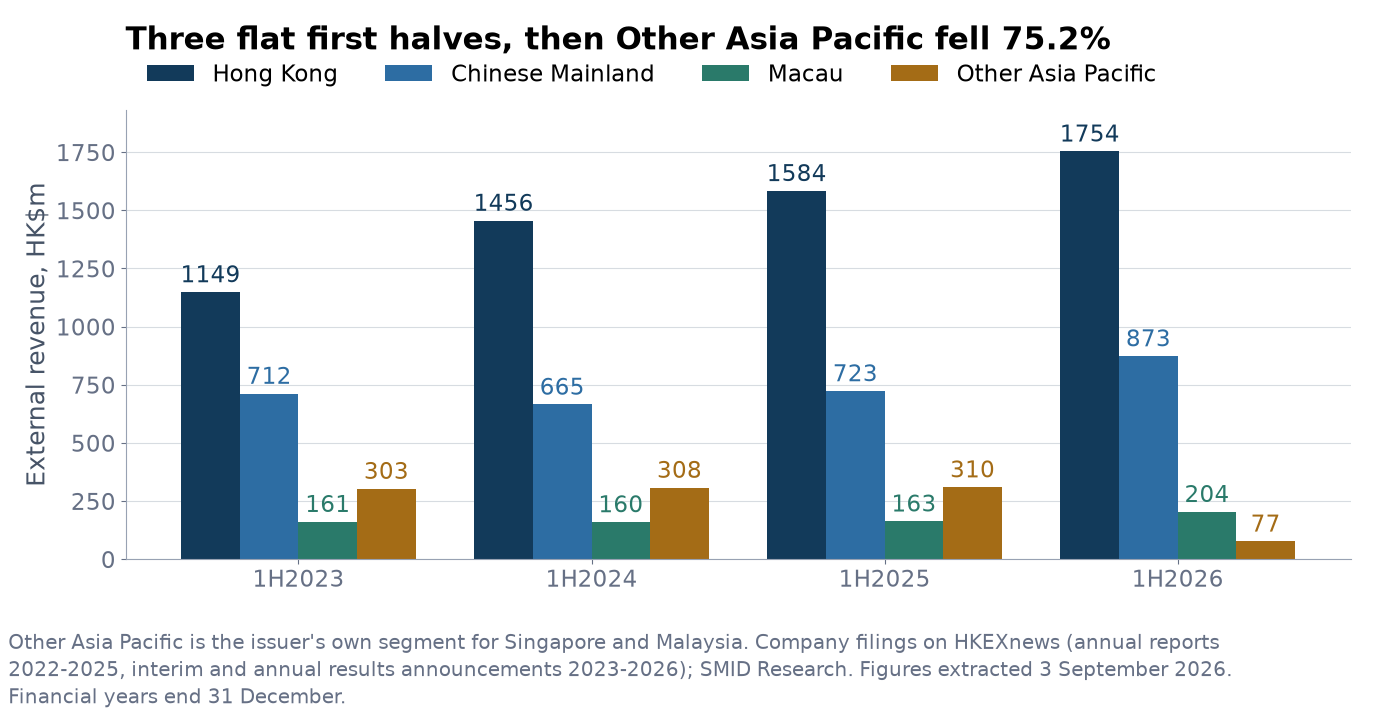
Three first halves within 2.2% of each other, then a 75.2% fall. External revenue by reported territory, six months to 30 June, HK$m. Other Asia Pacific is the issuer’s own segment for Singapore and Malaysia. Source: interim results announcements 2023–2026.
The Group reports four territories. Three of them grew in the first half of 2026 and one of them almost disappeared.
Six months to 30 June, HK$m
External revenue 1H2025
External revenue 1H2026
Change
Segment profit 1H2025
Segment profit 1H2026
Change
Hong Kong
1,583.7
1,753.8
+10.7%
215.2
285.2
+32.5%
Chinese Mainland
723.0
873.3
+20.8%
83.8
147.3
+75.7%
Macau
163.0
203.8
+25.1%
31.5
64.7
+105.5%
Other Asia Pacific
309.7
76.7
−75.2%
52.6
5.5
−89.5%
Total
2,779.3
2,907.6
+4.6%
383.2
502.8
+31.2%
Source: segment note, interim results announcement of 20 August 2026. External segment revenue of HK$2,907.6m plus commission income of HK$26.5m reconciles exactly to group revenue of HK$2,934.0m. Segment profit is the issuer’s own segment result before unallocated corporate expenses. Percentage changes are arithmetic on the two columns.
Take Other Asia Pacific out of both halves and the three continuing territories grew segment profit 50.4% year on year, against the 31.2% the total shows. That is the arithmetic reason the reported group figures understate what the continuing business did, and it is also the reason the history is not a clean base.
What makes the fall worth a section rather than a footnote is what came before it. The same segment produced HK$302.98m, HK$307.64m and HK$309.67m of external revenue in three consecutive first halves — a 2.2% spread across three years — on eight or nine stores, at full-year segment margins of 17.4% to 19.4% in FY2022 to FY2024 against Hong Kong’s 9.3% to 10.9% over the same three years. It was the Group’s highest-margin territory. Singapore went from eight stores at 30 June 2025 to three a year later; Malaysia went from one to two.
Hold every comparison to FY2024, the last full year before the fall, so that none of it is a mixed-period effect. Other Asia Pacific earned HK$70.9m of external revenue per average store that year: 2.0 times the Chinese Mainland’s HK$34.6m and 1.5 times Macau’s HK$48.9m, though below Hong Kong’s HK$88.0m. It earned it on HK$11.9m of non-current assets against Hong Kong’s HK$1,599.1m — HK$54 of revenue for every dollar of fixed asset, against Hong Kong’s HK$1.83 — and carried FY2024 right-of-use depreciation of HK$10.8m against Hong Kong’s HK$203.4m. It is the asset intensity, not the revenue per store, that does not read like shop-floor retail.
A network rationalised, then rebuilt in a different place. Stores by territory at each reported disclosure date. The Mainland count fell by 24 shops over two years and then added six in the six months to 30 June 2026, of which the issuer attributes eight openings to jewellery. Source: ‘Number of stores’ disclosure in each results announcement, 2023–2026.
Evidence boundary. Four annual reports, three interim reports and the corporate-action filings retrieved for this page contain no sentence explaining what the Other Asia Pacific business was, why it fell, whether the fall is an exit, a loss of supply or a loss of a customer channel, or whether any part of it moved elsewhere in the Group. The remaining rows of the 196-row 2022–2026 announcement tape were enumerated by title and classified rather than opened, so what is recorded here is an absence across what was read, not across the whole tape. Five ESG reports on that tape carry territory headcount and were not retrieved.
Margin, and the write-down inside it
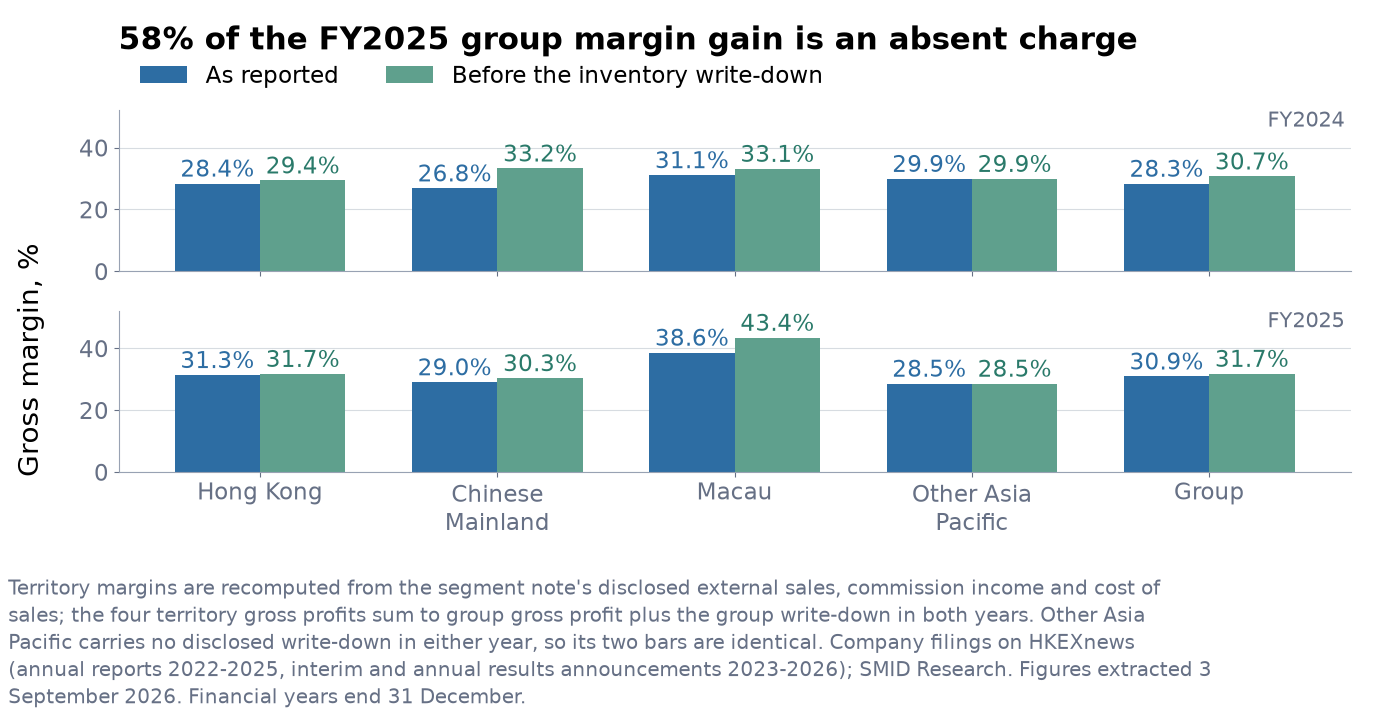
The reported margin and the margin before the write-down move in different directions. Territory margins are recomputed from the segment note’s disclosed external sales, commission income and cost of sales; the four territory gross profits sum to group gross profit plus the group write-down in both years, which is the arithmetic check that the decomposition is right. Source: segment note and cost-of-sales note, annual reports 2024 and 2025.
FY2025’s reported gross margin rose 2.55 percentage points to 30.87%. The inventory write-down inside cost of sales fell from HK$122.7m to HK$50.0m over the same period. Before write-downs the margin rose 1.07 percentage points, from 30.66% to 31.73%. The difference — 1.48 of the 2.55 points, or 58% of the headline improvement — is the absence of a FY2024 charge rather than anything the shops did.
The segment note discloses cost of sales by territory, which lets the same split be done one level down. Against external sales plus commission income, FY2025 margins before write-downs were Hong Kong 31.70%, Macau 43.39%, the Chinese Mainland 30.32% and Other Asia Pacific 28.54%, against FY2024’s 29.37%, 33.12%, 33.24% and 29.87%.
The Mainland margin fell 2.92 points before write-downs while its reported margin rose 2.19 points, because the Mainland write-down fell from HK$87.0m to HK$21.5m. Gold jewellery is a thinner business than watches, and the Mainland is where it is being scaled. The direction of that recomputed series is the opposite of the direction the reported series shows, and it is not visible anywhere in the headline numbers.
The first half of 2026 is a different case. The margin rose 2.94 points while the write-down moved the other way — HK$5.1m against nil — so the underlying gain is 3.11 points and is not a write-down effect. It is also not geographic mix: removing Other Asia Pacific from both halves leaves 2.86 of the 2.94 points intact. The issuer attributes the improvement to ‘the remarkable performance of the Group’s overall sales’ and says nothing further. Territory margins are not disclosed at the half year, so the largest single movement in the half-year accounts is also the least explained.
Evidence boundary. There is no half-year territory margin split, no disclosure of the write-down by territory at the half year, and no explanation of the 3.11 points of underlying margin gain. One external observation is on the record and belongs beside it rather than inside it: the COMEX front-month gold future settled at US$4,519.6 an ounce on 3 September 2026, against a calendar-2025 average of US$3,447.3 over 252 sessions, a premium of 31.1%. That is context, not a cause: the sign is not obvious either, since a gold-denominated liability marked at a higher gold price should produce a loss, yet the half booked a HK$11.9m gold-loan fair value gain while the gold-loan balance fell from HK$207.7m to HK$137.1m.
The balance sheet: about a year of stock, and no bank borrowings
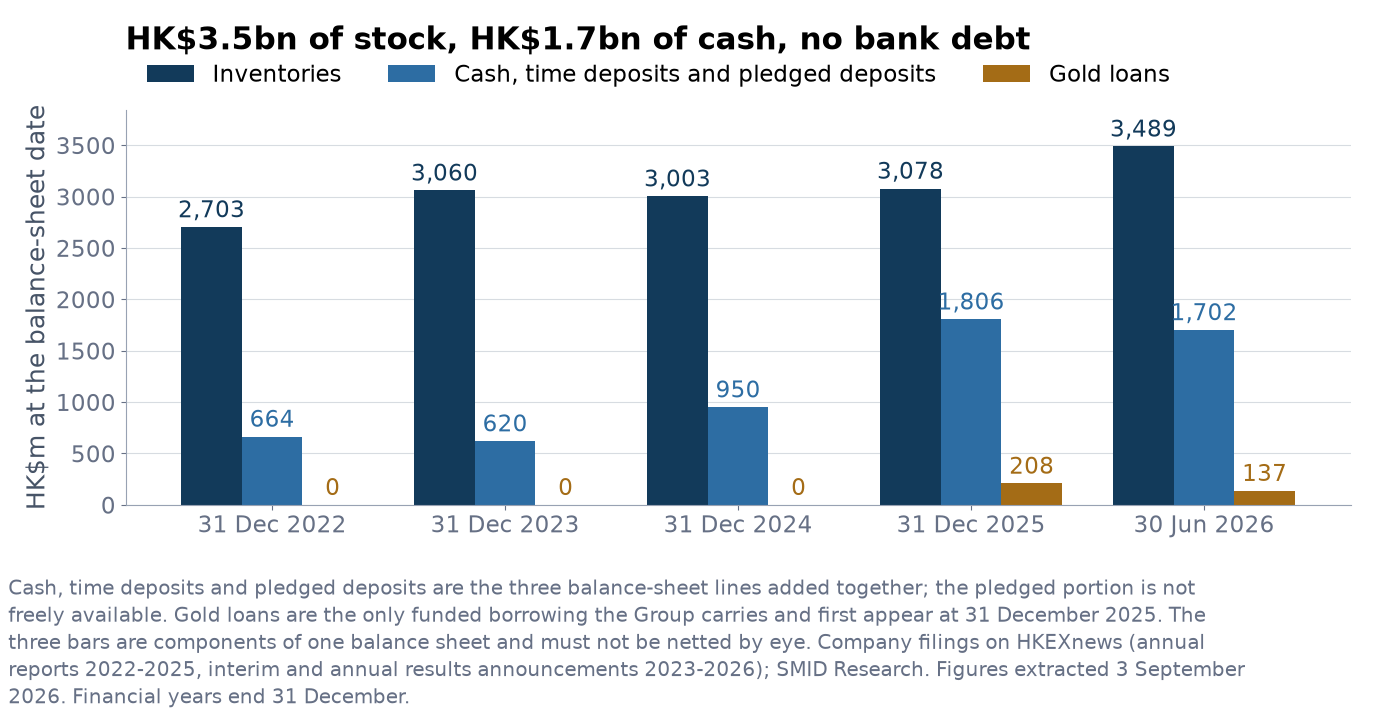
The stock is the business, and it is funded by the balance sheet rather than by a bank. The three bars are components of one balance sheet and must not be netted by eye; the pledged portion of the deposits is not freely available. Source: balance sheets in the annual reports 2022–2025 and the interim results announcement of 20 August 2026.
At 30 June 2026 the Group held HK$1,505.0m of cash and cash equivalents, HK$68.0m of time deposits with an original maturity over three months and HK$128.9m of pledged bank deposits, against HK$137.1m of gold loans and no bank borrowings. Net cash on the issuer’s own definition is HK$1,564.7m, which reproduces the HK$1,565m stated in the management discussion to within HK$1m. Undrawn banking facilities were HK$219m, against HK$150m at 31 December 2025.
At the balance-sheet date, HK$m
31 Dec 2025
30 Jun 2026
What it is
Inventories
3,078.2
3,488.7
Watches and jewellery on the shelf and in the warehouse
Cash and cash equivalents
1,292.1
1,505.0
—
Time deposits over three months
318.2
68.0
Outside cash and cash equivalents on the balance sheet
Pledged bank deposits
195.5
128.9
Security for banking facilities; not freely available
Gold loans
207.7
137.1
Twelve-month fixed-rate RMB loans whose fair value gain or loss runs through profit or loss
Bank borrowings
—
—
None reported at either date
Lease liabilities, current and non-current
405.7
410.4
Shop leases capitalised under HKFRS 16
Trade receivables
23.1
22.1
Against HK$2,934.0m of half-year revenue
Equity attributable to owners
5,617.4
5,876.3
—
Net cash, issuer definition
1,598.0
1,564.7
Cash plus time and pledged deposits less gold loans
Sources: balance sheet and notes, annual report 2025 and interim results announcement of 20 August 2026. Net cash on the issuer’s definition is recomputed from the four balance-sheet lines above it and reproduces the figure stated in the management discussion to within HK$1m in both periods. Lease liabilities are the current and non-current lines added together.
Per share, on the 7,256,708,129 shares in issue at 30 June 2026, net cash is HK$0.2156, inventory is HK$0.4808 and book value attributable to owners is HK$0.8098. Those three are components of one balance sheet and must not be added together. They are given separately because each answers a different question, and none of them is a statement about what the shares are worth.
Inventory rose HK$410.5m in the half against HK$140.4m of revenue growth, taking closing inventory from 282 to 321 days of cost of sales. The Group opened one Hong Kong multi-brand store and eight Mainland jewellery stores in the half, and a multi-storey Rolex boutique on its own Canton Road building shortly after it, so an investment reading is well supported by what the filings say. It is not proved by them. The write-down inside first-half cost of sales is disclosed — HK$5.1m against nil a year earlier — and notes 8 and 9 carry ageing analyses of trade receivables and trade payables, but nothing in the announcement breaks the inventory balance down by age or the write-down down by territory, and no post-balance-sheet sell-through is given.
Evidence boundary. The interim results announcement carries the condensed statements, the segment note and the significant-accounting notes, but no cash-flow statement, so first-half operating cash flow cannot be read from it. The 2026 interim report, which historically follows in the second week of September and adds the share-option and directors’-interests notes, had not been filed at this page’s cut-off.
Control, related parties and where the capital went
A discretionary trust vehicle associated with the Yeung family holds 4,393,970,000 shares, 60.55% of the company, down from 64.813% before a January 2025 placing. Five other Hong Kong-listed companies sit under the same discretionary trusts, and at least two of them transact with this one.
The recurring cost of those dealings is small, and saying so plainly matters more than implying otherwise. FY2025 related-party charges were about HK$26m in total — HK$18.0m of information-system and administrative service charges, plus lease interest, variable lease payments and advertising — against HK$531.4m of profit before taxation, roughly 5%. Lease liabilities owed to related companies were HK$45.6m of the HK$405.7m total at 31 December 2025.
The sequencing is the observation. On 9 January 2025 the Company placed 477,250,000 new shares at HK$0.167 through Emperor Securities Limited, a related company, raising HK$79.24m net from independent third parties, stated to be for retail-network expansion and working capital. On 28 February 2025 it agreed to buy the upper floors of 4–8 Canton Road from a wholly-owned subsidiary of Emperor International Holdings for about HK$79.8m, completing in August 2025. The two amounts match to within HK$0.6m and are seven weeks apart. The purchase went to independent shareholders with an independent valuation of HK$80.3m and was approved; the Group held about HK$950m of cash and deposits at the end of FY2024 and did not need the placing to fund it. Both readings survive the evidence, and the page records the sequence rather than choosing between them. What is not in doubt is who bore the dilution: the controlling trust did not subscribe, and its stake fell 4.26 percentage points.
The Mainland joint venture is the other place the capital went. In April 2025 the Group put its Mainland jewellery business into companies owned 51% by it and 49% by Xiaoduocai, an independent third party, and received HK$210.5m for the 49% interest, booked in financing activities and directly in equity with no gain in profit or loss. The PRC vehicle, Emperor Jewellery (Jiangsu), produced HK$161.7m of FY2025 revenue against HK$222.6m of expenses and a total comprehensive loss of HK$55.8m. Two features of the agreement are easy to miss: the first RMB540.0m of accumulated joint-venture losses is borne one-third by Xiaoduocai and two-thirds by the Group, against a 51/49 equity split, so in the loss-making phase the Group carries more than its ownership share; and the FY2025 accounts allocate HK$26.1m, or 46.7%, of the Jiangsu comprehensive loss to the 49% interest, which is neither one-third nor 49%. The filings do not reconcile the two.
In December 2025 the Yeung-family consignment arrangement was renewed with the annual cap raised from HK$35m to HK$50m, on the stated expectation of significantly increased consignment activity from the family. Historical consignment value over the eleven months to November 2025 was HK$30.5m.
Evidence boundary. The filings do not disclose what sits inside the joint venture’s HK$219.3m of non-current liabilities, do not break the non-controlling-interest line out by vehicle at the half year, and do not explain the 46.7% loss allocation. Whether the non-controlling-interest line turning from a HK$27.1m loss in FY2025 to a HK$7.3m profit in the half reflects Jiangsu or another vehicle is not decidable from the public record until the FY2026 annual report.
The share price and what came with its moves
Over the window Emperor Watch & Jewellery returned +96.1% on a dividend-adjusted basis; the Hang Seng Index returned +33.8% and the median of the 4 listed comparisons +48.9%.
Click a quarter — on the chart or in the return strip under it — to read its filings beside its large moves.
Key: Emperor Watch & Jewellery (0887) as a solid line; Hang Seng Index rebased, dashed; peer median rebased, dotted; the peer median runs off scale Jul 24–Apr 25 and is clipped there; filing ticks above the axis; ex-dividend ticks on it; numbered pins are moves with a written note; plain dots are other detected moves.
Key moves
The five largest moves over a day or up to two weeks, with no day counted twice.
Each move is shown next to the market over the same days (and peers, where shown). News listed with a move was published within its dates; that does not mean the news caused the move. The quarter view has all the news.
Index: Hang Seng Index. Peers: the median of four listed companies used as a sector check; the notes name them and their limits.
Q3 2023
4 Sep 2023 – 29 Sep 2023 (part quarter)
0887 −2.5%HSI −5.5%Peer median −1.4%Range HK$0.17–HK$0.19Close HK$0.17
Beauty Royal, an indirect wholly-owned subsidiary, renewed the tenancy of Shop No. 16 on the ground and lower ground floors of New World Tower, 16-18 Queen's Road Central, for three years from 1 March 2024 to 28 February 2027. The aggregate rent over the term is about HK$104.5 million inclusive of rates, service charges and other outgoings, with a deposit of about HK$8.8 million and a right-of-use asset of about HK$87.6 million. The company said the landlord and its ultimate beneficial owners are independent third parties. One or more percentage ratios exceed 5% but are below 25%, so the renewal is a discloseable transaction exempt from shareholders' approval.
The board accepted the resignation, which the announcement attributed to Mr Ng pursuing his other personal developments; he also ceased to sit on the executive committee and to be a director of relevant subsidiaries, and confirmed no disagreement with the board. No appointment of a chief executive was announced on the tape at the time; the company later disclosed, in its 3 February 2025 board announcement, that Leung Ho Cheong, Larry had joined as chief executive officer in June 2024.
Q1 2024
2 Jan 2024 – 28 Mar 2024
0887 +7.2%HSI −3.0%Peer median +0.8%Range HK$0.17–HK$0.20Close HK$0.18
Ms Chan had been an independent non-executive director since May 2017 and chaired the remuneration committee while sitting on the audit and nomination committees. Her death left five directors, three executive and two independent, so the company did not meet Rule 3.10(1) on the minimum number of independent non-executive directors, Rule 3.21 on audit committee membership or Rule 3.25 on remuneration committee composition. The company said it was endeavouring to identify a candidate to fill the vacancy as soon as practicable.
Hong Kong revenue was HK$2,510.0 million, 52.0% of the group, and mainland China HK$1,372.9 million, 28.5%. By product, watches were HK$3,480.4 million, 72.2% of revenue, and jewellery HK$1,342.8 million, 27.8%, against 18.1% a year earlier. Gross profit rose 23.2% to HK$1,450.3 million, adjusted EBITD 25.0% to HK$470 million and basic earnings per share to HK4.41 cents. A final dividend of HK0.56 cent was recommended. The group ended the year with 93 stores, HK$619.6 million of bank balances and cash on hand, no bank borrowings and a zero net gearing ratio. The company attributed the revenue growth to the full resumption of travel and a revival of consumption sentiment.
Guidance: The company said economists had generally lowered world growth forecasts around the beginning of 2024 and consumer confidence remained weak, and that it would keep expanding in the Hong Kong and mainland China markets, step up online promotion, and adjust its strategies and product mix 'in order to maintain stable business performance'.Next session (20 Mar): 0887 −7.5% · HSI +0.1% · peers −0.3%
Mr Law, aged 63, fills the casual vacancy created by the late Ms Chan Wiling, Yvonne, chairs the remuneration committee and sits on the audit and nomination committees, for a director's fee of HK$220,000 a year. The company said the appointment met the minimum one-third requirement for independent non-executive directors and re-complied with Rules 3.21 and 3.25.
Large price moves
15 Jan 2024 · +8% · index −1% · peers 0%
2week to 5 Jan 2024 · +11% · index −3% · peers −2%
38 Jan 2024 · +5% · index −2% · peers −1%
49 Jan 2024 · −6% · index 0% · peers +2%
520 Mar 2024 · −8% · index 0% · peers 0%
6week to 22 Mar 2024 · −11% · index −1% · peers −4%
Q2 2024
2 Apr 2024 – 28 Jun 2024
0887 −2.0%HSI +7.1%Peer median −15.3%Range HK$0.17–HK$0.19Close HK$0.17
Under the agreement dated 3 May 2024 and running to 31 December 2026, the group pays a referral fee on a per-sale basis when an associate group member introduces a customer who buys eligible merchandise, mainly jewellery. Referral fees actually paid to associate group members were about HK$18,000 in 2021, nil in 2022 and about HK$5,000 in 2023. The counterparties are connected persons, so the arrangement is a continuing connected transaction subject to announcement, annual review and reporting requirements but exempt from independent shareholders' approval.
The dividend was declared with the FY2023 results on 19 March 2024 and approved by shareholders on 21 May 2024. The record date was 29 May 2024 and payment was made on 20 June 2024.
Large price moves
73 May 2024 · +6% · index +2% · peers +2%
Q3 2024
2 Jul 2024 – 30 Sep 2024
0887 +10.4%HSI +19.3%Peer median +3.3%Range HK$0.15–HK$0.18Close HK$0.18
Jewellery revenue rose 77.4% to HK$965 million, 37.2% of the group, while watch revenue fell to HK$1,632 million from HK$1,786 million and its share fell to 62.8% from 76.7%. Hong Kong revenue was HK$1,465 million, 56.4% of the group, and mainland China HK$665 million, 25.6%. Gross profit rose 7.6% to HK$780 million and basic earnings per share was HK2.72 cents against HK2.74 cents. Stores fell to 90 from 93 at the year end even though four jewellery stores opened in Macau and mainland China during the period; bank balances and cash rose to HK$733 million with no bank borrowings. The same announcement moved Fan Man Seung, Vanessa onto the remuneration committee from 1 October 2024 in place of Wong Chi Fai, and replaced company secretary Chung Ho Ying with Fung Pui Ling from 2 September 2024.
Guidance: The company said the timetable for an interest rate cut remained uncertain and that it might take time for the property and stock markets to recover, which could affect consumer sentiment for luxury products, while the expanded Individual Visit Scheme and government initiatives would help tourism; it said it would continue expanding in the China and Southeast Asia markets but would be 'cautious in the course of footprint expansion'.Next session (22 Aug): 0887 +8.1% · HSI +1.4% · peers +0.8%
The dividend was declared with the 2024 interim results on 21 August 2024. The record date was 6 September 2024 and payment was made on 20 September 2024.
The tenant accepted an offer letter for Shop A on the ground floor, the whole of the first floor and a ground-floor storeroom at Shanghai Commercial Bank Tower, 12 Queen's Road Central, for retail use over five years from 3 March 2025 to 2 March 2030. Aggregate rent over the term is about HK$91.2 million excluding management fee, rates, government rent and utility charges, with a deposit of about HK$5.5 million and an unaudited right-of-use asset of about HK$80.43 million. One or more percentage ratios exceed 5% but are below 25%, so the tenancy is a discloseable transaction exempt from shareholders' approval.
The company said H Cinematic is a Hong Kong cinema operator unrelated to the operations of the group, and that because the liquidation began within 12 months of Ms Fan ceasing to be its director the matter had to be disclosed under Rules 13.51B(2) and 13.51(2)(l) of the Listing Rules.
Large price moves
1018 Oct 2024 · +6% · index +4% · peers +3%
Q1 2025
2 Jan 2025 – 31 Mar 2025
0887 +22.2%HSI +15.3%Peer median +7.6%Range HK$0.17–HK$0.21Close HK$0.20
The company agreed after trading hours on 9 January 2025 to place the shares on a best-efforts basis, to independent third parties, through Emperor Securities Limited for a fixed fee of HK$300,000. The price is a 1.76% discount to the HK$0.17 close on the day and a 0.12% premium to the HK$0.1668 average close of the previous five trading days. Gross proceeds would be about HK$79.70 million and net proceeds about HK$79.24 million, a net price of about HK$0.1660 a share, to be applied to expansion of the retail network and general working capital. Issued shares would rise from 6,779,458,129 to 7,256,708,129, taking the substantial shareholder Emperor W&J Holdings from 63.41% to 59.24%.
Mr Leung, aged 44, joined the company as chief executive officer in June 2024 and takes a seat on the executive committee at a director's fee of HK$100,000 a year. Mr Wong also leaves the executive committee; the announcement attributed his retirement to his wish to devote more time to personal interests and affairs on reaching retirement age, and recorded that he had no disagreement with the board.
Emperor W&J (HK & Macau), a direct wholly-owned subsidiary, agreed after trading hours on 28 February 2025 to buy from Emperor Property Investment the entire equity interest in the company holding the property, together with the sale loan of about HK$138.4 million owed to the vendor as at 31 January 2025, for a consideration determined by formula and estimated at about HK$79.8 million subject to adjustment. The formula takes the agreed HK$80.3 million value of the property, a preliminary independent valuation as at 13 February 2025, plus about HK$0.1 million of other tangible assets less about HK$0.6 million of liabilities. The property is the 2/F to 4/F and the advertising space of a five-storey building whose ground and first floors the group already owned. The company said it had identified a potential top-notch luxury watch brand to open a mega flagship store there. The transaction required independent shareholders' approval.
Hong Kong revenue rose 16.5% to HK$2,923.2 million, 55.9% of the group, while mainland China slipped to HK$1,350.8 million, 25.8%. Jewellery revenue rose 41.0% to HK$1,893.0 million, which the company attributed mainly to an increase in revenue from gold products, and watch revenue fell to HK$3,337.3 million, 63.8% of the total. Gross profit was HK$1,480.9 million, adjusted EBITD fell 7.9% to HK$433 million and basic earnings per share was HK3.79 cents. Stores fell to 82 from 93 a year earlier, while bank balances and cash rose to HK$949.8 million with no bank borrowings. The announcement also recorded the January placing and the Canton Road acquisition as events after the reporting period.
Guidance: The company said it was confident the general retail market would regain growth momentum, citing the resumption of the multiple-entry Individual Visit Scheme for Shenzhen permanent residents, United States interest rate cuts, central government stimulus and the local tourism blueprint, and said it expected gold jewellery, as an alternative investment, to continue to be well received by Chinese consumers.Next session (21 Mar): 0887 −1.6% · HSI −2.2% · peers −2.3%
Large price moves
1119 Mar 2025 · +9% · index 0% · peers +1%
12week to 21 Mar 2025 · +9% · index −1% · peers −1%
1327 Mar 2025 · +7% · index 0% · peers +1%
Q2 2025
1 Apr 2025 – 30 Jun 2025
0887 +118.9%HSI +4.1%Peer median +28.8%Range HK$0.18–HK$0.64Close HK$0.44
Emperor China, an indirect wholly-owned subsidiary, agreed after trading hours on 3 April 2025 to set up the joint venture companies, which will be principally engaged in the design, production and sale of precious metals and jewellery under the 'Emperor Jewellery' brand in mainland China and will take up the group's mainland jewellery operations. Emperor China is to contribute no more than RMB168.0 million and Xiaoduocai no more than about RMB178.0 million. Profits are shared 51/49, but accumulated losses up to RMB540.0 million are borne one-third by Xiaoduocai and the remaining two-thirds by Emperor China. Three of the five joint venture directors are group nominees. Xiaoduocai is ultimately controlled as to about 66.67% by Mr Chan, whom the announcement described as an executive director of Chow Tai Fook Jewellery Group from 2011 to 2023 and its managing director in mainland China from 2021 to 2023.
Dr Yeung and his associates, holding 4,298,630,000 shares or about 59.24% of the 7,256,708,129 shares then in issue, were required to abstain, leaving 2,958,078,129 shares able to vote; all of the 947,376,455 votes cast were in favour.
Ms Chan did not offer herself for re-election and ceased to chair the nomination committee and to sit on the audit and corporate governance committees; Ms Lai succeeded to all three positions on the conclusion of the meeting. All resolutions passed, with the general mandate to issue new shares carrying 93.58% of the 4,857,866,453 votes cast, the lowest support of the day.
The dividend was declared with the FY2024 results on 20 March 2025 and approved by shareholders on 19 May 2025. The record date was 27 May 2025 and payment was made on 13 June 2025.
Large price moves
142 Apr 2025 · +6% · index 0% · peers +1%
157 Apr 2025 · −15% · index −13% · peers −9%
16week to 11 Apr 2025 · −9% · index −9% · peers −6%
17week to 25 Apr 2025 · +11% · index +3% · peers +4%
188 May 2025 · +11% · index 0% · peers −1%
19week to 9 May 2025 · +18% · index +2% · peers +2%
2014 May 2025 · +9% · index +2% · peers +1%
2120 May 2025 · +16% · index +2% · peers 0%
22week to 23 May 2025 · +35% · index +1% · peers +1%
2328 May 2025 · +22% · index −1% · peers +2%
2429 May 2025 · +18% · index +1% · peers +2%
25week to 30 May 2025 · +44% · index −1% · peers +6%
264 Jun 2025 · +13% · index +1% · peers +1%
2716 Jun 2025 · +16% · index +1% · peers +4%
Q3 2025
2 Jul 2025 – 30 Sep 2025
0887 −34.1%HSI +11.6%Peer median +23.4%Range HK$0.28–HK$0.54Close HK$0.28
Hong Kong revenue rose 8.8% to HK$1,594 million, 57.1% of the group, and mainland China 8.7% to HK$723 million, 25.9%. Watch revenue rose 4.2% to HK$1,700 million and jewellery 13.4% to HK$1,094 million, of which gold products were 75.2%. Gross profit rose 7.7% to HK$840 million on a gross margin of 30.1% against 30.0%; adjusted EBITD rose 5.3% to HK$297 million and basic earnings per share was HK2.73 cents. Stores fell to 73 from 82 at the year end. Bank balances and cash rose to HK$1,508 million with no bank borrowings.
Guidance: The company said it was confident the overall retail market would further regain growth momentum, pointing to a slightly rebounding Japanese yen, the multiple-entry Individual Visit Scheme for Shenzhen permanent residents and the government's tourism blueprint; it said the newly opened Patek Philippe flagship store in Central would enhance its position and that it considered the strategic partnership with Mr Chan a valuable opportunity to expand its jewellery business in mainland China.Next session (21 Aug): 0887 +2.9% · HSI −0.2% · peers +2.2%
The dividend was declared with the 2025 interim results on 20 August 2025. The record date was 5 September 2025 and payment was made on 17 September 2025.
Large price moves
282 Jul 2025 · −17% · index +1% · peers +3%
29week to 4 Jul 2025 · −21% · index −2% · peers +1%
309 Jul 2025 · +13% · index −1% · peers −1%
31week to 11 Jul 2025 · +24% · index +1% · peers 0%
3215 Sep 2025 · +15% · index 0% · peers 0%
Q4 2025
2 Oct 2025 – 31 Dec 2025
0887 −19.6%HSI −4.6%Peer median −8.2%Range HK$0.23–HK$0.30Close HK$0.23
Under the agreement entered into after trading hours on 4 December 2025, the group may accept jewellery on consignment from members of the Yeung family, display it in its retail shops and keep the mark-up over the agreed consignment value. The previous agreement, dated 1 December 2022, carried caps of HK$35 million for each of 2023, 2024 and 2025, which the directors said had not been exceeded. The company said the higher caps reflected an expectation of significantly increased consignment activity from the family, driven by strong demand and high value for the products to be consigned, and an internal control policy holding consigned goods to no more than 35% of the group's inventory level.
The announcement's historical table gives consignment values of HK$15,255,000 for 2023, HK$21,783,000 for 2024 and HK$30,465,000 for the eleven months to 30 November 2025, while its text gives HK$30,465,000 as the aggregate for the whole period from 1 January 2023 to 30 November 2025; both readings cannot hold.
Q1 2026
2 Jan 2026 – 31 Mar 2026
0887 +31.0%HSI −3.3%Peer median +0.4%Range HK$0.23–HK$0.39Close HK$0.30
The announcement was made under Listing Rule 13.09(2)(a) and the inside information provisions of Part XIVA of the Securities and Futures Ordinance, and was based on a preliminary review of the latest available financial information. The company said the increase of over 60% was mainly attributable to an increase in total revenue and overall gross profit, which it attributed to the group's retail performance in Hong Kong and the Chinese Mainland. It said the audited annual results had not been finalised and were scheduled for publication in late March 2026.
Guidance: The company said it expected to record net profit of not less than HK$420 million for the year ended 31 December 2025.Next session (28 Jan): 0887 +36.8% · HSI +2.6% · peers +1.8%
Profit attributable to owners of the company was HK$458.4 million, above group net profit because non-controlling interests bore a HK$27.1 million loss in the first year of the mainland jewellery joint venture. Hong Kong revenue rose 13.3% to HK$3,313 million, 57.5% of the group, and the Chinese Mainland 20.3% to HK$1,625 million. Watch revenue rose 5.8% to HK$3,529 million and jewellery 18.1% to HK$2,236 million, with gold products 72.4% of jewellery revenue. Gross margin widened to 30.9% from 28.3% and adjusted EBITD rose 49.2% to HK$646 million; basic earnings per share was HK6.34 cents and the full-year dividend HK1.69 cents. Stores fell to 64 from 82. Bank balances and cash were HK$1,610 million against HK$208 million of gold loans, the first on record, and no bank borrowings.
Guidance: The company said it expected consumers to be cautious about overall spending but gold jewellery to continue to be well received as an alternative investment, and that the pace of recovery in the luxury retail market in the Chinese Mainland and Hong Kong would be maintained; it said it planned to open a multi-storey Rolex boutique and a multi-brand watch store on Canton Road in Tsim Sha Tsui.Next session (26 Mar): 0887 −6.0% · HSI −1.9% · peers −4.3%
Large price moves
3328 Jan 2026 · +37% · index +3% · peers +2%
34week to 30 Jan 2026 · +22% · index +2% · peers +2%
3510 Feb 2026 · +14% · index +1% · peers 0%
Q2 2026
1 Apr 2026 – 30 Jun 2026
0887 −13.9%HSI −7.7%Peer median −2.3%Range HK$0.24–HK$0.33Close HK$0.25
The dividend was declared with the FY2025 results on 25 March 2026 and approved by shareholders on 18 May 2026. The record date was 28 May 2026 and payment was made on 15 June 2026.
The dividend announcement form was reissued on 26 March 2026 to move the ex-dividend date from 25 May to 22 May 2026 because of a public holiday.
Q3 2026
2 Jul 2026 – 3 Sep 2026 (part quarter)
0887 +22.6%HSI +10.2%Peer median +11.4%Range HK$0.25–HK$0.30Close HK$0.29
The announcement was made under Listing Rule 13.09(2)(a) and the inside information provisions, and was based on a preliminary review of the latest available financial information. The company said the increase of approximately 60% was mainly attributable to an increase in both gross profit and gross profit margin, which it attributed to 'the remarkable performance of the Group's overall sales'. It said the unaudited interim results had not been finalised and were scheduled for publication in late August 2026.
Guidance: The company said it expected to record net profit of not less than HK$310 million for the six months ended 30 June 2026.Next session (22 Jul): 0887 +11.8% · HSI −1.0% · peers +0.3%
Gross profit rose 15.4% to HK$969 million on a gross margin of 33.0% against 30.1%, and adjusted EBITD rose 50.8% to HK$448 million; basic earnings per share was HK4.28 cents and profit attributable to owners of the company HK$310.4 million. Hong Kong revenue rose 11.1% to HK$1,771 million, 60.4% of the group, and the Chinese Mainland 20.7% to HK$873 million. Watch revenue rose 9.8% to HK$1,866 million, 63.6% of the total. Segment revenue from other regions in Asia Pacific, being Singapore and Malaysia, fell to HK$76.7 million from HK$309.7 million a year earlier. Stores rose to 69 from 64 at the year end. Bank balances and cash were HK$1,573 million against HK$137 million of gold loans.
Guidance: The company said it expected the Hong Kong economy to remain resilient in the second half of 2026, citing government support for tourism, a continued rebound in the stock market, relaxation of United States tariffs and rising visitor arrivals and spending, while naming geopolitical tensions and fluctuating interest rates and gold prices as headwinds; it said it would continue expanding the jewellery segment and had opened multi-storey Rolex boutiques in Beijing and Tsim Sha Tsui.Next session (21 Aug): 0887 −1.7% · HSI +1.2% · peers +0.9%
The dividend was declared with the 2026 interim results on 20 August 2026. The record date is 7 September 2026 and payment is due on 18 September 2026.
A clarification announcement on 21 August 2026 moved the record date from 3 September to 7 September 2026 and reset the book-closure period, and the dividend announcement form was reissued the same evening.
Large price moves
3622 Jul 2026 · +12% · index −1% · peers 0%
Notes and sources
Share price record
How this section was built
The detector flagged 36 large moves in the window — 36 single sessions — before any news was read. 3 market moves, 2 sector moves; 31 are left over after both controls, unexplained by them. Of those, 2 followed a filing by timestamp and 29 have nothing filed against them beyond routine notices and are recorded as unexplained rather than explained away.
This section records the 36-month price history and puts every large move through two subtractions and reports what is left over, not what caused it: first the Hang Seng Index, then the median of the four listed comparisons — Chow Sang Sang (0116), King Fook (0280), Luk Fook (0590) and Chow Tai Fook (1929) — which trade the same session on the same exchange. “Left over” is what survives both controls.
Each quarter panel pairs two records. Key developments are the filings that carry information — results, profit alerts, connected and discloseable transactions, the January 2025 placing, board changes and ex-dividend dates — with the figures as filed, the guidance given, the close on the day and how the reacting session traded against the controls; an announcement released after the 09:30 open is read against the next session, and HKEX carries a broadcast time on every one. Large price moves are the threshold-detected sessions, detected before any news was read and dispositioned from the controls and the enumerated tape; rows with a written note carry a numbered pin, the rest are dots on the line.
How to read the tags.Market-wide and Sector-wide mean the index or the peer median moved with the share over the same session or week; Residual means the move is still large after both are subtracted. A residual is what is left over, not a cause: it does not establish that the company’s own news moved the price, and an unchanged or thinly traded price is not proof that no information arrived. Returns use the dividend-adjusted close; a filing released after the open is read against the next session.
Prices are Yahoo Finance daily closes for 0887.HK over 4 September 2023 to 3 September 2026, dividend-adjusted for the seven dividends that went ex inside the window; the benchmark is the Hang Seng Index and the peer median is Chow Sang Sang (0116), King Fook (0280), Luk Fook (0590) and Chow Tai Fook (1929), each rebased to the same start. The filings tape is every HKEXnews announcement by the issuer over the window, with the exchange's own broadcast times. A filing released after the 09:30 open is read against the next session.
Limitations bound every row above. The tape is every HKEXnews announcement by the issuer over 1 January 2022 to 3 September 2026, enumerated in full from the exchange’s title-search servlet on 3 September 2026 — 196 rows against an exchange count of 196, of which 130 fall inside the price window; 29 entries were selected from them into the register above, and the rest are monthly returns, director lists, meeting and circular paperwork, proxy forms and shareholder-communication letters. Broker notes, block trades, substantial-shareholder timing, trade press and index reviews were not examined, so an “unexplained” reading means no issuer disclosure explains the move, not that no cause exists. That matters more here than usual: of the 36 detected moves, two followed a timestamped profit alert and two the previous evening’s results release, five were read as market or sector moves, and the remainder — including the run from about HK$0.20 in late April 2025 to the HK$0.64 high of 16 June 2025 and the reversal that followed, on volumes up to 116 times the median session — had no issuer announcement of any kind in the window. The peer control is four listed Hong Kong jewellery and watch retailers, one of which (King Fook) frequently does not trade, so its return is often exactly zero and the sector control is correspondingly weak. Gold, which the company reports as the majority of its jewellery revenue, is tested separately in the pack’s driver work and is not subtracted as a control here.
A quarter shows only the columns it has. An empty developments column means: No filings beyond routine disclosures (monthly returns, director lists, meeting paperwork) this quarter. An empty moves column means: No session cleared the large-move threshold this quarter.
The full move register — every large move and its market and sector controls
Every threshold-detected move in the window with its controls, dispositioned in the price-driver register; rows with a written note carry a numbered pin on the chart.
#
Session
0887
HSI
Peers
Left over
Control result
What the evidence supports
1
5 Jan 2024
+7.6%
−0.7%
−0.4%
+7.9%
Residual
Against an index move of −0.7% and a peer median of −0.4%, about 8 points are left over; 1.2× median volume. No filing beyond routine notices in the prior three sessions. Chow Sang Sang +1.0 · King Fook +1.5 · Chow Tai Fook −1.8 · Luk Fook −1.9
2
5 Jan 2024
+11.4%
−3.0%
−2.3%
+13.8%
Residual
Weekly window, 2023-12-29 to 2024-01-05: against an index move of −3.0% and a peer median of −2.3%, about 14 points are left over. No filing beyond routine notices inside the window. Chow Sang Sang +0.2 · King Fook +1.5 · Chow Tai Fook −4.8 · Luk Fook −5.9
3
8 Jan 2024
+5.4%
−1.9%
−1.1%
+6.5%
Residual
Against an index move of −1.9% and a peer median of −1.1%, about 6 points are left over; 2.3× median volume. No filing beyond routine notices in the prior three sessions. Chow Sang Sang −0.7 · King Fook −1.5 · Chow Tai Fook −2.4 · Luk Fook +0.2
4
9 Jan 2024
−5.6%
−0.2%
+2.3%
−7.9%
Residual
Against an index move of −0.2% and a peer median of +2.3%, about 8 points are left over; 1.1× median volume. No filing beyond routine notices in the prior three sessions. Chow Sang Sang +1.0 · King Fook +3.0 · Chow Tai Fook +2.0 · Luk Fook +2.5
5
20 Mar 2024
−7.5%
+0.1%
−0.3%
−7.1%
Residual
The session after the 2023 annual results, filed at 17:17 on 19 March 2024 after the close: revenue up 30.9% to HK$4,823.2 million and net profit up 34.7% to HK$299.2 million, with the full-year dividend raised to HK1.32 cents. Against an index move of +0.1% and a peer median of −0.3%, about 7 points are left over, on 4.1× median volume; the close fell from HK$0.201 to HK$0.186. Chow Sang Sang +0.5 · King Fook +0.0 · Chow Tai Fook −0.7 · Luk Fook −2.5
6
22 Mar 2024
−10.6%
−1.3%
−3.7%
−6.8%
Residual
Weekly window, 2024-03-15 to 2024-03-22: against an index move of −1.3% and a peer median of −3.7%, about 7 points are left over. The week included the 2023 annual results, filed at 17:17 on 19 March 2024, and the appointment of an independent non-executive director the same evening; nothing else beyond routine notices was filed. Chow Sang Sang −3.9 · King Fook −1.2 · Chow Tai Fook −7.5 · Luk Fook −3.6
7
3 May 2024
+5.8%
+1.5%
+1.8%
+3.9%
Sector-wide
Tracked the sector: against an index move of +1.5% and a peer median of +1.8%, about 4 points are left over. Chow Sang Sang +1.6 · King Fook +0.0 · Chow Tai Fook +2.0 · Luk Fook +2.3
8
22 Aug 2024
+8.1%
+1.4%
+0.8%
+7.3%
Residual
The session after the 2024 interim results, filed at 19:00 on 21 August 2024: revenue up 11.5% to HK$2,597 million but net profit flat at HK$185 million and the interim dividend cut to HK0.65 cent from HK0.76 cent. Against an index move of +1.4% and a peer median of +0.8%, about 7 points are left over, on 4.1× median volume. The HK$0.161 close came three sessions after the window low of HK$0.146 on 19 August 2024. Chow Sang Sang −1.0 · King Fook +1.4 · Chow Tai Fook +1.8 · Luk Fook +0.1
9
30 Sep 2024
+5.9%
+2.4%
+6.1%
−0.2%
Sector-wide
Tracked the sector: against an index move of +2.4% and a peer median of +6.1%, about 0 points are left over. Chow Sang Sang +6.2 · King Fook +0.0 · Chow Tai Fook +10.6 · Luk Fook +5.9
10
18 Oct 2024
+5.8%
+3.6%
+3.1%
+2.7%
Market-wide
In line with the market: against an index move of +3.6% and a peer median of +3.1%, about 3 points are left over. Chow Sang Sang +7.9 · King Fook +0.0 · Chow Tai Fook +3.9 · Luk Fook +2.3
11
19 Mar 2025
+8.9%
+0.1%
+0.8%
+8.0%
Residual
Against an index move of +0.1% and a peer median of +0.8%, about 8 points are left over; 8.6× median volume. No filing beyond routine notices in the prior three sessions. Chow Sang Sang +2.2 · King Fook +2.9 · Chow Tai Fook −0.5 · Luk Fook −1.0
12
21 Mar 2025
+9.2%
−1.1%
−1.1%
+10.4%
Residual
Weekly window, 2025-03-14 to 2025-03-21: against an index move of −1.1% and a peer median of −1.1%, about 10 points are left over, on 7.8× median volume. The week included the 2024 annual results, filed at 19:37 on 20 March 2025; nothing else beyond routine notices was filed. Chow Sang Sang +0.7 · King Fook +1.4 · Chow Tai Fook −5.4 · Luk Fook −3.0
13
27 Mar 2025
+7.1%
+0.4%
+1.0%
+6.2%
Residual
Against an index move of +0.4% and a peer median of +1.0%, about 6 points are left over; 11.7× median volume. No filing beyond routine notices in the prior three sessions. Chow Sang Sang +1.0 · King Fook +0.0 · Chow Tai Fook +4.3 · Luk Fook +0.9
14
2 Apr 2025
+5.8%
−0.0%
+1.1%
+4.7%
Residual
Against an index move of −0.0% and a peer median of +1.1%, about 5 points are left over; 9.7× median volume. The only filings in the prior three sessions were the circular and extraordinary general meeting notice for the already-announced Canton Road acquisition, posted on 28 March 2025, and routine notices. Chow Sang Sang +1.4 · King Fook −1.4 · Chow Tai Fook +10.1 · Luk Fook +0.8
15
7 Apr 2025
−14.6%
−13.2%
−8.7%
−6.0%
Market-wide
A market-wide sell-off: the Hang Seng Index fell 13.2% and the peer median 8.7% the same session, so about 6 points are left to the company on 7.6× median volume. The only issuer filing in the prior three sessions was the 3 April joint-venture announcement, filed at 17:17 after the close two sessions earlier. The close fell from HK$0.212 to HK$0.181. Chow Sang Sang −9.7 · King Fook −7.1 · Chow Tai Fook −18.5 · Luk Fook −7.7
16
11 Apr 2025
−8.5%
−8.5%
−6.2%
−2.3%
Market-wide
Weekly window, 2025-04-03 to 2025-04-11: the shares fell 8.5% against an index move of −8.5% and a peer median of −6.2%, so about 2 points are left over. The week included the 3 April joint-venture announcement and the market-wide sell-off of 7 April. Chow Sang Sang −6.5 · King Fook +0.0 · Chow Tai Fook −6.8 · Luk Fook −6.0
17
25 Apr 2025
+10.8%
+2.7%
+4.3%
+6.4%
Residual
Between late April and mid-June 2025 the shares rose from about HK$0.20 to a high of HK$0.64 on 16 June 2025, then fell 17.1% and 20.8% in two July sessions. No issuer announcement on the HKEX tape precedes any of these moves. Chow Sang Sang +5.8 · King Fook +2.9 · Chow Tai Fook −1.6 · Luk Fook +7.6
18
8 May 2025
+11.1%
+0.4%
−1.0%
+12.1%
Residual
Between late April and mid-June 2025 the shares rose from about HK$0.20 to a high of HK$0.64 on 16 June 2025, then fell 17.1% and 20.8% in two July sessions. No issuer announcement on the HKEX tape precedes any of these moves. Chow Sang Sang −0.6 · King Fook −2.7 · Chow Tai Fook −1.3 · Luk Fook +0.2
19
9 May 2025
+18.1%
+1.6%
+1.5%
+16.5%
Residual
Between late April and mid-June 2025 the shares rose from about HK$0.20 to a high of HK$0.64 on 16 June 2025, then fell 17.1% and 20.8% in two July sessions. No issuer announcement on the HKEX tape precedes any of these moves. Chow Sang Sang +0.7 · King Fook +0.0 · Chow Tai Fook +6.0 · Luk Fook +2.4
20
14 May 2025
+9.3%
+2.3%
+1.0%
+8.3%
Residual
Between late April and mid-June 2025 the shares rose from about HK$0.20 to a high of HK$0.64 on 16 June 2025, then fell 17.1% and 20.8% in two July sessions. No issuer announcement on the HKEX tape precedes any of these moves. Chow Sang Sang +1.1 · King Fook −2.7 · Chow Tai Fook +3.5 · Luk Fook +0.9
21
20 May 2025
+16.0%
+1.5%
+0.0%
+16.0%
Residual
Volume ran at 29.1× the median, the heaviest of the 2025 run to that point, against an index move of +1.5% and a peer median of exactly zero, leaving the whole 16.0% to the company, and the close rising from HK$0.25 to HK$0.29. The only filings in the prior three sessions were the 19 May annual general meeting poll results and the accompanying change of independent non-executive directors, released at 18:07 after the close the evening before. Chow Sang Sang +1.1 · King Fook −1.4 · Chow Tai Fook −0.4 · Luk Fook +0.5
22
23 May 2025
+34.7%
+1.1%
+1.2%
+33.5%
Residual
Weekly window, 2025-05-16 to 2025-05-23: the shares rose 34.7% against an index move of +1.1% and a peer median of +1.2%, leaving about 34 points over, on 18.4× median volume. The week included the 19 May annual general meeting poll results and change of independent non-executive directors; nothing else was filed. Chow Sang Sang +1.2 · King Fook +0.0 · Chow Tai Fook +1.3 · Luk Fook +3.0
23
28 May 2025
+22.4%
−0.5%
+1.5%
+20.9%
Residual
One of the heaviest sessions of the window, at 109× median volume, with the close rising from HK$0.335 to HK$0.41 while the index fell 0.5% and the peer median rose 1.5%, leaving about 21 points to the company. Nothing was filed on the HKEX tape in the prior three sessions. Chow Sang Sang +3.9 · King Fook +0.0 · Chow Tai Fook +0.7 · Luk Fook +2.2
24
29 May 2025
+18.3%
+1.4%
+1.9%
+16.3%
Residual
Between late April and mid-June 2025 the shares rose from about HK$0.20 to a high of HK$0.64 on 16 June 2025, then fell 17.1% and 20.8% in two July sessions. No issuer announcement on the HKEX tape precedes any of these moves. Chow Sang Sang +4.8 · King Fook +1.4 · Chow Tai Fook +2.5 · Luk Fook +0.2
25
30 May 2025
+43.8%
−1.3%
+6.1%
+37.6%
Residual
Between late April and mid-June 2025 the shares rose from about HK$0.20 to a high of HK$0.64 on 16 June 2025, then fell 17.1% and 20.8% in two July sessions. No issuer announcement on the HKEX tape precedes any of these moves. Chow Sang Sang +11.1 · King Fook +12.5 · Chow Tai Fook +0.9 · Luk Fook +1.1
26
4 Jun 2025
+12.9%
+0.6%
+1.2%
+11.8%
Residual
Between late April and mid-June 2025 the shares rose from about HK$0.20 to a high of HK$0.64 on 16 June 2025, then fell 17.1% and 20.8% in two July sessions. No issuer announcement on the HKEX tape precedes any of these moves. Chow Sang Sang +2.0 · King Fook −3.7 · Chow Tai Fook +1.4 · Luk Fook +1.0
27
16 Jun 2025
+16.4%
+0.7%
+3.8%
+12.6%
Residual
The window high: the close reached HK$0.64 from HK$0.55, on 84× median volume, against an index move of +0.7% and a peer median of +3.8%. Nothing was filed on the HKEX tape in the prior three sessions. From the HK$0.216 close of 25 April 2025 the shares had roughly tripled in 34 sessions. Chow Sang Sang +4.5 · King Fook +0.0 · Chow Tai Fook +6.0 · Luk Fook +3.0
28
2 Jul 2025
−17.1%
+0.6%
+3.4%
−20.4%
Residual
The reversal: the close fell from HK$0.44 to HK$0.365 on 112× median volume while the index rose 0.6% and the peer median 3.4%, leaving about 20 points against the company. The only filing in the prior three sessions was the nomination committee's terms of reference, posted on 30 June 2025. Chow Sang Sang +5.2 · King Fook +2.3 · Chow Tai Fook +1.0 · Luk Fook +4.5
29
4 Jul 2025
−20.8%
−1.5%
+0.6%
−21.4%
Residual
Between late April and mid-June 2025 the shares rose from about HK$0.20 to a high of HK$0.64 on 16 June 2025, then fell 17.1% and 20.8% in two July sessions. No issuer announcement on the HKEX tape precedes any of these moves. Chow Sang Sang −0.3 · King Fook −1.2 · Chow Tai Fook +1.5 · Luk Fook +5.5
30
9 Jul 2025
+13.4%
−1.1%
−1.2%
+14.6%
Residual
Between late April and mid-June 2025 the shares rose from about HK$0.20 to a high of HK$0.64 on 16 June 2025, then fell 17.1% and 20.8% in two July sessions. No issuer announcement on the HKEX tape precedes any of these moves. Chow Sang Sang −2.5 · King Fook −1.1 · Chow Tai Fook −1.3 · Luk Fook −0.5
31
11 Jul 2025
+23.7%
+0.9%
−0.2%
+23.9%
Residual
Between late April and mid-June 2025 the shares rose from about HK$0.20 to a high of HK$0.64 on 16 June 2025, then fell 17.1% and 20.8% in two July sessions. No issuer announcement on the HKEX tape precedes any of these moves. Chow Sang Sang −3.0 · King Fook +1.2 · Chow Tai Fook +1.6 · Luk Fook −1.7
32
15 Sep 2025
+15.2%
+0.2%
−0.3%
+15.6%
Residual
A 15.2% session on 32.7× median volume, taking the close from HK$0.295 to HK$0.34, against an index move of +0.2% and a peer median of −0.3%. The 1H2025 results had been filed 18 sessions earlier, on 20 August 2025, and nothing was filed in the prior three sessions. Chow Sang Sang +5.0 · King Fook −2.0 · Chow Tai Fook −0.8 · Luk Fook +0.1
33
28 Jan 2026
+36.8%
+2.6%
+1.8%
+34.9%
Residual
The session after the positive profit alert, filed at 17:30 on 27 January 2026 after the close, in which the company said FY2025 net profit would be not less than HK$420 million against HK$257 million in FY2024. The close rose from HK$0.234 to HK$0.32 on 86× median volume, against an index move of +2.6% and a peer median of +1.8%, leaving about 35 points to the company. It is the largest single-session move in the window. Chow Sang Sang +1.7 · King Fook +1.9 · Chow Tai Fook +2.7 · Luk Fook +1.8
34
30 Jan 2026
+22.4%
+2.4%
+1.5%
+20.9%
Residual
Weekly window, 2026-01-23 to 2026-01-30: the shares rose 22.4% against an index move of +2.4% and a peer median of +1.5%, leaving about 21 points over, on 19.8× median volume. The week included the 27 January positive profit alert; nothing else was filed. Chow Sang Sang +4.6 · King Fook +0.0 · Chow Tai Fook +2.8 · Luk Fook +0.2
35
10 Feb 2026
+14.3%
+0.6%
+0.4%
+13.9%
Residual
Against an index move of +0.6% and a peer median of +0.4%, about 14 points are left over; 29.6× median volume. No filing beyond routine notices in the prior three sessions. Chow Sang Sang −0.7 · King Fook +3.8 · Chow Tai Fook +0.5 · Luk Fook +0.2
36
22 Jul 2026
+11.8%
−0.9%
+0.3%
+11.4%
Residual
The session after the second positive profit alert, filed at 17:30 on 21 July 2026 after the close, in which the company said 1H2026 net profit would be not less than HK$310 million against HK$194 million a year earlier. The close rose from HK$0.255 to HK$0.285 on 18.7× median volume, against an index move of −0.9% and a peer median of +0.3%. Chow Sang Sang +0.6 · King Fook +0.0 · Chow Tai Fook +0.1 · Luk Fook +4.6
Key developments: sources, timing and notes
7 Sep 2023 · Ex-dividend: interim dividend of HK0.76 cent per share for the six months to 30 June 2023.DividendThe dividend was declared with the 2023 interim results on 24 August 2023, before this price window opens.No release time is carried because the entry is dated on the ex-date, which is a market event rather than a filing; the declaring announcement falls before the window.Source: HKEXnews, interim dividend for the six months ended 30 June 2023, 24 Aug 2023
9 Nov 2023 · Discloseable transaction: the New World Tower shop lease is renewed for three years at an aggregate rent of about HK$104.5 million, recognising a right-of-use asset of about HK$87.6 million.ContractReaction (next session, 10 Nov): 0887 −0.6% · HSI −1.8% · peers −2.1% · 1.3× median volumeSource: HKEXnews, discloseable transaction in relation to renewal of tenancy, 9 Nov 2023
19 Mar 2024 · FY2023 results: revenue up 30.9% to HK$4,823.2 million and net profit up 34.7% to HK$299.2 million; the full-year dividend rises to HK1.32 cents from HK1.00 cent.ResultsReaction (next session, 20 Mar): 0887 −7.5% · HSI +0.1% · peers −0.3% · 8.9× median volumeSource: HKEXnews, 2023 annual results announcement, 19 Mar 2024
24 May 2024 · Ex-dividend: final dividend of HK0.56 cent per share for the year ended 31 December 2023.DividendNo release time is carried because the entry is dated on the ex-date rather than on the announcement.Source: HKEXnews, final dividend for the year ended 31 December 2023, 19 Mar 2024
20 Mar 2025 · FY2024 results: revenue up 8.4% to HK$5,230.3 million but net profit down 14.0% to HK$256.7 million; the final dividend is cut to HK0.45 cent and the full year to HK1.10 cents.ResultsReaction (next session, 21 Mar): 0887 −1.6% · HSI −2.2% · peers −2.3% · 7.1× median volumeSource: HKEXnews, 2024 annual results announcement, 20 Mar 2025
3 Apr 2025 · Discloseable transaction: the mainland China jewellery business moves into joint venture companies owned 51% by the group and 49% by Xiaoduocai, with total cash capital commitment of no more than RMB346.0 million.ContractReaction (next session, 7 Apr): 0887 −14.6% · HSI −13.2% · peers −8.7% · 4.5× median volumeSource: HKEXnews, discloseable transaction - formation of joint venture, 3 Apr 2025
22 May 2025 · Ex-dividend: final dividend of HK0.45 cent per share for the year ended 31 December 2024.DividendNo release time is carried because the entry is dated on the ex-date rather than on the announcement.Source: HKEXnews, final dividend for the year ended 31 December 2024, 20 Mar 2025
20 Aug 2025 · 1H2025 results: revenue up 7.6% to HK$2,794 million and net profit up 4.9% to HK$194 million; the interim dividend is cut to HK0.55 cent from HK0.65 cent.ResultsReaction (next session, 21 Aug): 0887 +2.9% · HSI −0.2% · peers +2.2% · 0.5× median volumeSource: HKEXnews, 2025 interim results announcement, 20 Aug 2025
27 Jan 2026 · Positive profit alert: the company expects FY2025 net profit of not less than HK$420 million, against HK$257 million in FY2024.Profit guidanceReaction (next session, 28 Jan): 0887 +36.8% · HSI +2.6% · peers +1.8% · 17.8× median volumeSource: HKEXnews, positive profit alert, 27 Jan 2026
25 Mar 2026 · FY2025 results: revenue up 10.2% to HK$5,765 million and net profit up 67.7% to HK$431 million; the final dividend is raised 153.3% to HK1.14 cents.ResultsReaction (next session, 26 Mar): 0887 −6.0% · HSI −1.9% · peers −4.3% · 1.4× median volumeSource: HKEXnews, 2025 annual results announcement, 25 Mar 2026
21 Jul 2026 · Positive profit alert: the company expects 1H2026 net profit of not less than HK$310 million, against HK$194 million in 1H2025.Profit guidanceReaction (next session, 22 Jul): 0887 +11.8% · HSI −1.0% · peers +0.3% · 9.0× median volumeSource: HKEXnews, positive profit alert, 21 Jul 2026
20 Aug 2026 · 1H2026 results: revenue up 5.0% to HK$2,934 million and net profit up 63.9% to HK$318 million; the interim dividend is raised 63.6% to HK0.90 cents.ResultsReaction (next session, 21 Aug): 0887 −1.7% · HSI +1.2% · peers +0.9% · 4.0× median volumeSource: HKEXnews, 2026 interim results announcement, 20 Aug 2026
The 2026 interim report, historically filed in the second week of September. It adds the share-option note and the directors’-interests update to the August announcement. It does not add a half-year cash-flow statement or a territory margin split.
A profit alert, if one comes. The Group has pre-announced a profit floor before each of its last two results and beaten it by a low single-digit margin both times, roughly four weeks before the print. On this name the alert has been the price event, not the result.
The FY2026 results announcement, expected March 2027. The full-year gross margin against FY2025’s 30.87%, the inventory write-down inside cost of sales, the store count, and the first territory split covering the period in which Other Asia Pacific fell.
The FY2026 annual report, expected April 2027. The territory cost-of-sales disclosure that makes the margin decomposition on this page possible, the related-party note, the joint-venture disclosures and the non-controlling-interest breakdown.
The Mainland store count. Sixteen of the 26 Mainland stores are jewellery stores and nine are franchised; whether the rebuild continues, and at what margin, is the open question the FY2026 accounts answer first.
What you can watch yourself
Every other test on this page waits for the company to file. These do not. Each row is a series you can look up yourself, free, today — with the level this reading was built against, the levels that would put it in question, and what the series cannot tell you.
Search HKEXnews for stock code 887 and look for an announcement titled Positive Profit Alert or Profit Warning in the weeks before a results date. Emperor Watch & Jewellery Limited, on HKEXnews
Last recorded
310 HK$ million: the net profit floor the alert states, for the period it covers, 2026-07-21
What the reading assumes
194 HK$ million: the net profit floor the alert states, for the period it covers (the prior-period net profit the alert itself compares against, 1H2025)
Watch / alert
194 and 0 HK$ million: the net profit floor the alert states, for the period it covers, on a move below — currently at or better than the level the reading assumed
How often to look
monthly (the series prints event)
What it points to. The Group has pre-announced a profit floor before each of its last two results and beaten it by a low single-digit margin both times, so an alert is a usable point estimate about four weeks before the print and both moved the share price the next session.
Direction only — this pack does not carry a coefficient from this series to reported earnings.
What it cannot tell you. Two observations are not a calibration. The alert states a floor, not a figure, and the Group is under no obligation to issue one at all: it issued none before the FY2023 or FY2024 results. Silence is not a signal, and this row cannot tell a reader anything in a year without an alert.
Settled by The results announcement the alert precedes, due 2027-03-31. Lead time: about four weeks before the results announcement.
Open the Yahoo Finance page for the gold futures contract GC=F, go to Historical Data and read the close for the latest completed day. CME Group, retrieved through the Yahoo Finance chart API
Last recorded
4,141 US dollars per troy ounce, 2026-10-07
What the reading assumes
3,447 US dollars per troy ounce (calendar-year average of the same daily series, over the 252 sessions stored in market/external-series.json, 2025)
Watch / alert
3,700 and 3,447 US dollars per troy ounce, on a move below — currently at or better than the level the reading assumed
How often to look
weekly (the series prints daily)
What it points to. Gold sets both the selling price and the replacement cost of jewellery, which was 38.8 per cent of FY2025 revenue with gold products 72.4 per cent of that. A rising gold price lifts revenue per gram and produces a holding gain on metal already bought; it simultaneously raises the fair value of the RMB gold-loan liability, which is disclosed inside other gains or losses. The sign is defensible; no coefficient is.
Direction only — this pack does not carry a coefficient from this series to reported earnings.
What it cannot tell you. Gold sets the price and cost of the jewellery half only. It says nothing about the watch half, which was 61.2 per cent of FY2025 revenue and is priced by the brands, so a gold rally alongside falling Hong Kong footfall can leave group revenue flat. The level here is a US dollar futures settlement while the Group buys in renminbi and sells in Hong Kong and renminbi, so read the gap directionally, never to the dollar.
Settled by The FY2026 annual report gross margin, the note 4 inventory write-down and the other gains or losses note, due 2027-04-30. Lead time: one inventory turn, roughly six to twelve months at 286-321 days of stock.
Search HKEXnews for stock code 887, open the latest results announcement, and find the 'Number of stores' table in the Presence in Prime Retail Locations section. Emperor Watch & Jewellery Limited, on HKEXnews
Last recorded
69 stores, 2026-06-30
What the reading assumes
93 stores (the same disclosure at 31 December 2023, the peak of the network, FY2023)
Watch / alert
64 and 60 stores, on a move below — currently at or better than the level the reading assumed
How often to look
quarterly (the series prints event)
What it points to. Store count is one of the two terms of the revenue identity in every territory driver: revenue equals average stores times revenue per average store. It is also the fixed cost base, so a change moves both sides of the model.
What it cannot tell you. A store count says nothing about store size, location quality or productivity, and it counts nine franchised Mainland jewellery stores that produce wholesale revenue rather than retail revenue. Two networks of 69 stores can earn very different money, which is exactly what happened here between 2023 and 2026.
Settled by The next results announcement's store table, due 2027-03-31. Lead time: none - it is the observation.
run_off — nothing public to watch
Nothing free and public tracks the Other Asia Pacific run-off between filings. Searched: the Group's own disclosure, which names only Singapore and Malaysia and gives no country split of revenue; Singapore Department of Statistics retail sales, whose watches-and-jewellery category covers the whole country and cannot isolate five stores; and the Singapore ACRA register, which does hold the subsidiary's own accounts but is a paid, per-document service filed annually with a long lag, so it fails both the free and the between-filings tests. The honest position is that this engine has no reader-checkable signal, and the register says so rather than substituting a proxy that would not actually move with it.
Watchlist reviewed on 2026-10-08; each observation has its own date above. This watchlist date does not change the company research cutoff. A series moving past a level is a reason to re-read the case, not a recommendation. The same series across every company covered: what you can watch.
Notes and sources
What the filings still do not answer
What caused the 3.11 percentage points of underlying gross-margin gain in the six months to 30 June 2026. This is the largest single movement in the half-year accounts and the issuer attributes it only to overall sales performance.
What the Other Asia Pacific business was, why it fell 75.2%, and whether the fall is an exit, a loss of supply or a loss of a customer channel. No filing read for this page contains a sentence about it.
The terms, tenor and renewal dates of the watch dealerships that produce 61.2% of revenue. No dealership agreement appears in any row of the 196-row 2022–2026 announcement tape, and none is required to be filed.
The split of Mainland revenue between watch and jewellery, and between own and franchised stores.
What sits inside the Jiangsu joint venture’s HK$219.3m of non-current liabilities, and how the 46.7% allocation of its comprehensive loss to a 49% interest reconciles with the one-third loss-sharing tranche in the joint-venture agreement.
Why the recomputed Macau gross margin before write-downs rose 10.3 percentage points in FY2025, on the Group’s smallest territory.
Territory gross margins at the half year, an ageing of the HK$3,488.7m inventory balance, and any write-down by territory.
First-half operating cash flow, which the interim results announcement does not carry.
What Luck Treasure Limited, named in the group structure, does.
Download
A print-ready PDF of this page, for reading away from the screen: Emperor Watch & Jewellery evidence library (PDF). It carries the same content as this page — the four-year record, the first half of 2026, where the revenue comes from, margin, the balance sheet, control and related parties, the share price and open questions — and the same omissions: no rating, no fair value, no forecast.
Basis. Figures are as reported by the issuer unless the arithmetic is described as recomputed or derived. The 1H2026 figures are unaudited and unreviewed. Territory gross margins before write-downs, revenue per average store, revenue per dollar of non-current assets, the payout ratios, the continuing-territory growth rate and the free-float estimate are computations from stated figures and are labelled where they appear. Twenty-eight primary documents were retrieved by direct PDF fetch at URLs taken verbatim from the enumerated HKEXnews title-search tape for 1 January 2022 to 3 September 2026; the exchange’s own total for that window is 196 rows and 196 were returned, so the enumeration is complete by the exchange’s count, and the rows that were not retrieved were classified by title. Price data is a three-year daily closing series to 3 September 2026, with the Hang Seng Index and four Hong Kong-listed peers as controls. This page publishes no forecast, no valuation and no view on the share price.
Where the filings differ from each other. One conflict is live and is resolved here on the arithmetic. The 2025 interim results announcement prints 7,256,708,129 as the earnings-per-share denominator for the six months to 30 June 2025, which does not reproduce the 2.73 HK cents of basic earnings per share printed on the face of the same document. The 2026 interim announcement gives the same comparative as a weighted average of 7,203,973,322 shares, which does. This page uses the weighted average. Separately, two announcements on the tape are second issues of the same subject on consecutive days — the interim dividend form of 20 and 21 August 2026, reissued as a clarification of the record date, and the FY2025 final dividend form of 25 and 26 March 2026. Neither is marked a replacement and the figures they carry are identical; this page takes its dividend figures from the results announcements in both cases.
Corrections log
Correction status at 4 September 2026: no post-publication corrections had been recorded by that date. Later dated corrections are listed below and do not advance this page’s research cutoff. Corrections are welcome through the contact page and will be dated and described here.
Reader questions & corrections
Ask about this company, challenge a source or suggest a factual correction. Only selected questions that SMID Research has reviewed and answered are published.
Submissions are private by default. Your email is encrypted and never published. Please do not send confidential or inside information, allegations about individuals, promotions, or requests for personalised investment advice.
Behind the lock The private vault holds the author-only working record for this company: the written view, the forecast and valuation work, the model, the claims ledger and the independent-review artifacts. It is not published and not available for sharing, and it is not investment advice.
Private boundary. The author-only record is not approved for public distribution. This public page deliberately omits any rating, valuation, scenario output, forecast and portfolio action.
These bounded retrospective corrections clarify specific published facts or calculations. They retain each report's existing research cutoff and do not represent a full refresh or a finding that all possible issues are resolved.
Emperor Watch & Jewellery
Internal Inconsistency. FY2022 annual dividends were 1.00 Hong Kong cent per share and the recalculated payout was 30.5%. Source basis: FY2022 results inputs. Limitation: This does not imply future dividend capacity.
Transcripts
Find available event transcripts in the transcript library.