Frasers Property develops and owns residential, commercial, retail, logistics and hospitality assets across several countries, with earnings shaped by development completions, recurring rents and capital recycling.
Latest figures
At 30 June 2026 it reported S$18.058bn of gross debt, about S$2.0bn of cash and bank balances and 93.6% net gearing; a 31 August tender targets S$500m of 4.15% notes due February 2027 through cash or a settlement partly funded with 2037 notes.
Main risk
The central risk is that disposals and refinancing do not close fast enough to fund the maturity wall without eroding asset value, liquidity or cover.
Next proof
The next test is the tender result and settlement, use of the completed S$150m 2036-note proceeds, FHT completion and FY2026 results.
What mattersRecurring earnings are material, but consolidated leverage, refinancing concentration and legal-entity cash access remain the deciding evidence. The group reports S$35.4bn of property assets and says 76% of first-half PBIT was recurring. At 30 June 2026, gross debt was S$18.058bn and reported net gearing was 93.6%.
FY2025 revenueS$3.40bnaudited
FY2025 PBITS$1.19bnaudited
1H FY2026 PBITS$679munaudited
Net gearing93.6%30 June 2026
Interest cover2.3×issuer-reported, 1H FY2026
Property assetsS$35.4bn31 March 2026
Evidence balance
The live questionCan disposals and recurring rents deliver cash at the guarantor level fast enough to fund FY2027 maturities?At 30 June 2026, nine months into FY2026, gross debt was S$18.058bn against about S$2.0bn of cash, with the S$4.269bn FY2027 ex-REIT maturity schedule reported at March 2026 directly ahead.
What improved
The March half produced S$678.7m of PBIT, and industrial and logistics delivered 205,538 sqm in 9M FY2026 while reporting 745,615 sqm of pipeline for FY2027 and beyond, with positive rental reversions across the disclosed retail and commercial portfolios.
What became more demanding
The March half absorbed cash: S$276.5m of cash from operations against S$402.2m of property and PPE capex, S$327.5m of interest paid and a S$300m perpetual redemption, while interest cover of about 2.3x remained well below the 3.8x reported in FY2021 and FY2022.
Strongest alternative explanation
The March-half squeeze could be timing rather than strain: the S$300m perpetual redemption was a one-off, investment-property capex precedes completions and rent, and the S$500m tender covers only about 11.7% of the S$4.269bn FY2027 ex-REIT schedule, which does not by itself establish funding stress.
The decisive missing fact
FY2026 results setting out recurring earnings, interest cover, net gearing and a full legal-entity maturity and liquidity bridge, together with the tender's accepted principal and cash-or-exchange mix, would settle where the cash actually sits.
Drawn from the evidence on this page: the improvement, the constraint, the benign reading and the fact that would settle it. It states no view on the shares.
About the private research record
Also on file behind the private view 🔒 (author-only): the refreshed integrated equity and credit research, editable model workbook, instrument analysis, retained source library and independent review records. No private conclusion, security pricing work or expected-return output is reproduced on this public evidence page.
On this page
Business anatomy · operations, customers and cash
Property capital moves through development, ownership and recurring operating platforms
Frasers Property develops and owns real estate, recycles assets into listed and private vehicles, and earns across rental, development and hospitality activities.
Read each card by investor role: business line, operating step, customer outcome or cash conversion.
Capital allocationCapital base
Fund land and standing assets
What happensEquity, bank facilities and capital-markets debt fund development sites, investment properties and operating platforms.
Capital at riskFunding cost and maturity access shape the return that remains for owners.
Business lineDevelopment
Build and sell projects
What happensResidential, industrial and mixed-use projects turn land and construction work into completed units and settlement proceeds.
How it earnsPurchasers and project partners fund development revenue and profit as projects settle.
Business lineRecurring assets
Lease and operate property
What happensCommercial, retail, industrial and hospitality assets generate rent, management income and operating profit over time.
How it earnsTenants and guests provide recurring property and hospitality cash flow.
Capital recyclingInvestor vehicles
Move assets into investment vehicles
What happensSelected assets move into listed trusts, private vehicles or outside ownership while Frasers may retain stakes and management roles.
Capital outcomeSale proceeds can reduce debt or fund new projects while retained vehicles continue contributing recurring earnings.
Original SMID Research comic. AI-assisted, analyst-directed monochrome artwork depicts the evidenced operating steps of Frasers Property Limited; deterministic captions and dated mix figures state the economics using issuer disclosures available to 2026-08-31. The drawings are representative—not issuer artwork, an exact product or site design, a statement of scale, or a company forecast.
Investor translation
What matters after the operating picture
Four questions connect the business model to cash and balance-sheet risk. This is a factual reading aid, not a valuation or recommendation.
Value lever
Attributable property returns and asset recycling after debt, tax, minority interests and holding costs.
Cash bottleneck
Land, development and investment assets consume cash long before completion, leasing or disposal.
Balance-sheet pressure
Parent-accessible liquidity and disposal proceeds cannot cover maturities, interest and committed projects.
Next proof
Cash proceeds from asset recycling, interest coverage and sustainable return on attributable equity.
Text version of this comic
Capital allocation · Fund land and standing assets Equity, bank facilities and capital-markets debt fund development sites, investment properties and operating platforms. Capital at risk: Funding cost and maturity access shape the return that remains for owners.
Business line · Build and sell projects Residential, industrial and mixed-use projects turn land and construction work into completed units and settlement proceeds. How it earns: Purchasers and project partners fund development revenue and profit as projects settle.
Business line · Lease and operate property Commercial, retail, industrial and hospitality assets generate rent, management income and operating profit over time. How it earns: Tenants and guests provide recurring property and hospitality cash flow.
Capital recycling · Move assets into investment vehicles Selected assets move into listed trusts, private vehicles or outside ownership while Frasers may retain stakes and management roles. Capital outcome: Sale proceeds can reduce debt or fund new projects while retained vehicles continue contributing recurring earnings.
1. Reporting snapshot
FY2025 is the latest audited year. Revenue was S$3.404bn, PBIT S$1.186bn and profit attributable to owners S$243m. At 30 September 2025, total assets were S$39.75bn, investment properties S$24.58bn, gross borrowings S$17.66bn and total equity S$17.15bn. In the six months to 31 March 2026, revenue was S$1.509bn, PBIT S$679m and attributable profit S$88m; the balance sheet expanded to S$40.05bn of assets with S$18.08bn of gross borrowings and S$1.96bn of cash.
Reported group snapshot — S$m unless stated
Measure
FY2025
1H FY2026
Revenue
3,403.5
1,508.6
PBIT
1,186.2
678.7
Attributable profit
243.1
88.4
Total assets
39,747.6
40,045.0
Gross borrowings
17,663.1
18,078.4
Cash and cash equivalents
2,350.0
1,964.8
Reported net gearing
89.2%
94.2%
Reported interest cover
2.1×
2.3×
Sources: FY2025 Annual Report, financial statements and capital-management note; 1H FY2026 financial statements, press release and results presentation. The half-year figures are unaudited.
2. Segment evidence
The portfolio is not one earnings stream. Singapore remains the largest domestic contributor, while industrial and logistics assets provide a second recurring pool. Australia is more settlement-sensitive; Thailand and Vietnam include development and asset-value exposure; hospitality contributes operating income but carries travel and operating-cycle sensitivity.
The 3Q business update adds operating detail. Unrecognised residential revenue was S$1.0bn at June 2026 versus S$1.4bn at September 2025, split about S$0.4bn Singapore, S$0.5bn Australia, S$0.03bn Thailand and S$0.1bn China. Industrial/logistics delivered 205,538 sqm in 9M FY2026 and reported 745,615 sqm of pipeline for FY2027 and beyond. Disclosed retail and commercial portfolios showed positive rental reversions across their geographies. Hospitality RevPAR rose year on year in EMEA but fell in APAC ex-Thailand and Thailand.
3. Debt, liquidity and maturity concentration
At 31 March 2026, the group reported a 3.8% average debt cost, 69.4% fixed or hedged debt and a 2.5-year weighted average maturity. Consolidated cash is not automatically equivalent to cash available to the guarantor: listed trusts, joint ventures, minority interests, secured property debt and local borrowing entities can limit fungibility. Public disclosures do not provide a complete guarantor-only liquidity and covenant bridge.
The 3Q update at 30 June reported S$18.058bn gross debt, about S$2.0bn cash and bank balances, 93.6% net gearing, 44.9% net debt/property assets and total FY2026/FY2027 maturity buckets of S$0.914bn/S$4.583bn. The detailed ex-REIT maturity table below remains the 31 March schedule. Completed FY2026 financing events included the S$300m perpetual redemption in January and S$280m note redemption in April.
Debt maturities at 31 March 2026 — S$bn
Financial year
Consolidated
Excluding listed REITs
FY2026
1.544
1.304
FY2027
4.559
4.269
FY2028
3.735
2.871
FY2029
3.471
2.401
FY2030
2.681
1.618
After FY2030
2.088
0.605
Source: 1H FY2026 results presentation. Figures include bank loans, notes and other borrowings and are shown by contractual maturity.
4. Frasers Hospitality Trust transaction
Shareholders approved the proposed FHT portfolio optimisation on 28 August 2026. The circular shows S$368.3m of divestment consideration and S$190.4m of acquisition consideration, a S$177.9m cash difference before costs. Estimated fees, stamp duty and capital-gains tax total S$78.4m, leaving stated net proceeds of S$99.5m. The transaction’s latest independent valuations total S$1.3615bn versus S$1.4526bn of effective property prices. Completion remained pending at the information cut-off.
The circular’s pro-forma presentation reduces FY2025 net gearing from 89.2% to 85.9% and raises net asset value by S$0.03 per share. Applying the same 3.3-point change to 1H FY2026 would move the reported ratio from 94.2% to 90.9%; that is simple arithmetic, not issuer guidance. The accounting gain and the cash proceeds are different measures.
5. Tender for 4.15% notes due February 2027
On 31 August 2026, FPL Treasury invited holders to tender three Series 001 tranches with the same ISIN, coupon and maturity: S$398m, S$52m and S$50m, together S$500m. The notes carry 4.15% and mature on 23 February 2027. Holders may elect cash at par plus accrued interest or new fixed-rate SGD notes due 2037 as part of the purchase price, plus a cash balance and accrued interest. The new-note coupon will be at least 3.50%; final coupon, issue price and exchange economics were not fixed in the public notice.
The offer expires at 17:00 SGT on 9 September unless changed, with settlement expected on or about 17 September. FPL Treasury may accept or reject tenders in its discretion; notes not accepted or not tendered remain outstanding. The public attachments did not include the Invitation Memorandum distributed to eligible holders. At full acceptance, the S$500m target equals about 11.7% of the S$4.269bn FY2027 ex-REIT maturity schedule reported at March 2026 and about 2.8% of June gross debt. A cash settlement and a settlement partly funded with 2037 notes have different effects on debt, cash and maturity timing; the notice does not fix the new-note principal or cash balance, so the result and funding mix are the next factual tests.
6. Outstanding senior notes reviewed
Covered FPL-guaranteed notes
Instrument
Coupon
Maturity
Principal
Filed terms
Green Notes
4.49%
16 Sep 2027
S$500m
senior unsecured; issued by FPL Treasury; unconditional and irrevocable FPL guarantee; unrated at issue
Series 006 Notes
3.50%
28 Aug 2036
S$150m
senior unsecured; issued by FPL Treasury; FPL guaranteed; S$250,000 denomination; institutional/accredited distribution
Series 001 Notes subject to tender
4.15%
23 Feb 2027
S$500m
three tranches with the same ISIN; FPL guaranteed; cash or 2037-note tender settlement offered
The 2027 pricing supplement and final close-of-offer notice were retrieved from the issuer’s retail-bond archive. For the 2036 issue, the proposed-issue terms and final issue confirmation were retrieved; a standalone Series 006 pricing supplement was not located in the issuer newsroom or SGX searches completed by the cut-off. No executable secondary-market quote was available for these notes at the cut-off.
7. Evidence that would change the case
Series 001 tender: accepted principal, cash/exchange mix, final 2037 coupon and issue price, allocation and additional-note amount.
Completed Series 006 financing: whether the S$150m proceeds remain as cash, repay near-term debt or are deployed.
FY2026 results: recurring earnings, interest cover, net gearing and a full legal-entity maturity and liquidity bridge.
Completion of the FHT optimisation: cash received, transaction costs paid and debt actually retired.
Residential pipeline: settlement evidence and replenishment of the June 2026 unrecognised revenue base without aggressive land spending.
Any new covenant, security, rating or funding-cost disclosure at FPL guarantor level.
8. Three funding perimeters sit inside the headline ratios
Frasers Property's reported net gearing is consolidated net debt divided by total equity. Total equity includes equity attributable to ordinary shareholders, perpetual securities and non-controlling interests. At 31 March 2026 those components were S$9.437bn, S$0.198bn and S$7.455bn respectively, for total equity of S$17.091bn. Non-controlling interests were therefore 43.6% of the denominator. Net debt of S$16.098bn divided by that total gives 94.2%.
Equity and debt perimeters — S$m
Measure
30 Sep 2025
31 Mar 2026
What it represents
Equity attributable to owners
9,297.2
9,437.5
ordinary-shareholder equity
Perpetual securities
496.4
198.4
hybrid capital within total equity
Non-controlling interests
7,354.9
7,455.4
equity belonging to other owners of consolidated entities
Total equity
17,148.5
17,091.3
denominator of reported net gearing
Gross loans and borrowings
17,663.1
18,078.4
consolidated group
Net debt
15,304.6
16,097.6
after filed cash and bank-deposit adjustments
Reported net gearing
89.2%
94.2%
net debt / total equity
The results presentation also supplies a debt ladder excluding listed REITs. That is a useful parent-credit lens because debt inside the listed trusts has its own assets and minority owners. It is still not the same thing as the balance sheet of Frasers Property Limited, the guarantor of the two notes reviewed here: the ex-REIT perimeter can include subsidiaries and financing entities outside the legal guarantor. A consolidated ratio, an ex-REIT ladder and a guarantor obligation answer three different questions.
9. Five reported years show the earnings and funding cycle
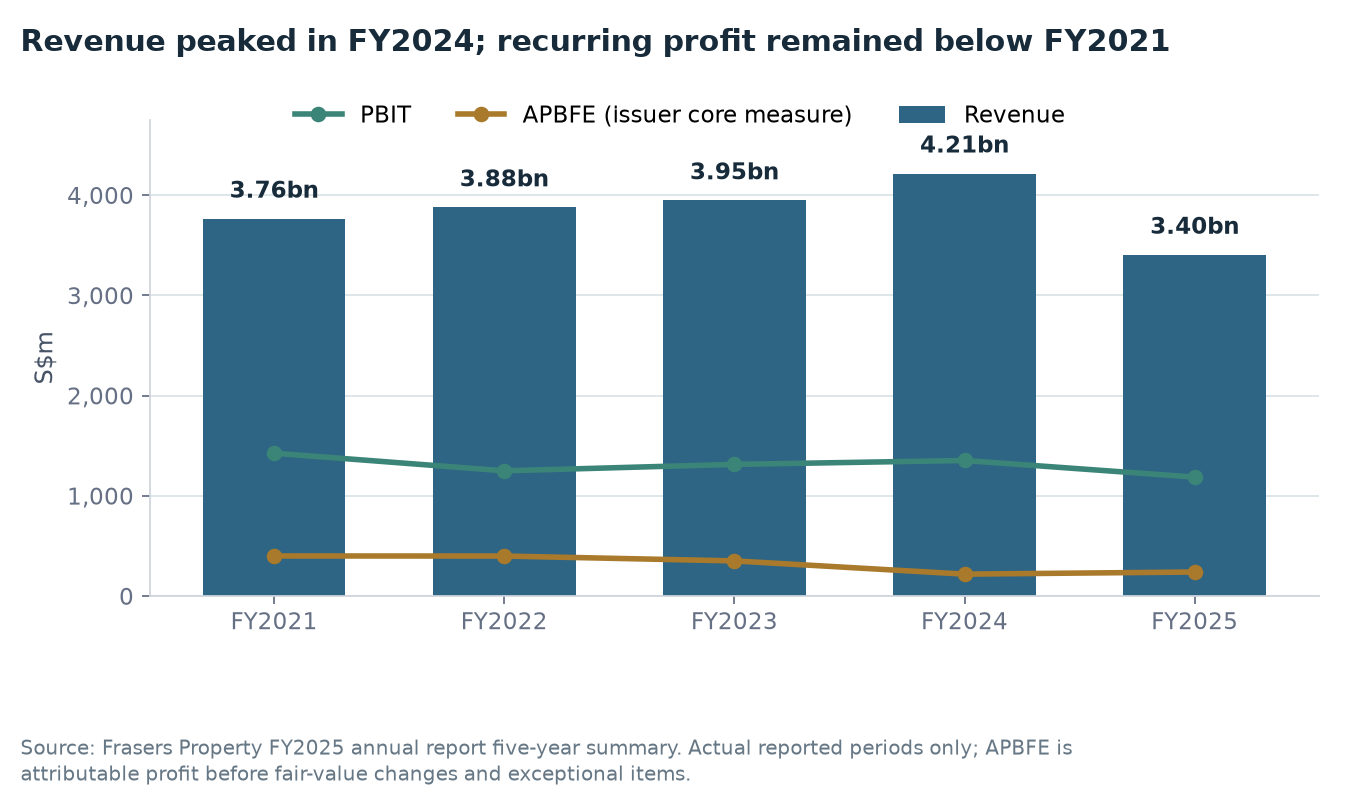
Revenue rose from S$3.764bn in FY2021 to S$4.215bn in FY2024, then fell 19.2% to S$3.404bn in FY2025. PBIT fell in FY2022, recovered in FY2023 and FY2024, and then fell 12.3% in FY2025. The core measure used by the issuer — attributable profit before fair-value changes and exceptional items, or APBFE — declined from S$399.5m in FY2021 to S$218.2m in FY2024 before recovering to S$239.4m.
Five-year actual record — S$m except per-share data and ratios
Measure
FY2021
FY2022
FY2023
FY2024
FY2025
Revenue
3,763.8
3,877.0
3,947.1
4,214.8
3,403.5
PBIT
1,424.7
1,249.2
1,313.2
1,352.2
1,186.2
APBFE
399.5
398.8
350.3
218.2
239.4
Profit attributable to owners
833.1
928.3
173.1
206.3
243.1
Core EPS
10.0c
8.7c
7.7c
4.5c
5.8c
Dividend per share
2.0c
3.0c
4.5c
4.5c
4.5c
NAV per share
S$2.44
S$2.64
S$2.52
S$2.45
S$2.37
Net debt / total equity
73.7%
64.8%
75.8%
83.4%
89.2%
Net debt / property assets
39.7%
37.5%
40.4%
42.1%
43.7%
Interest cover
3.8x
3.8x
3.1x
2.6x
2.1x
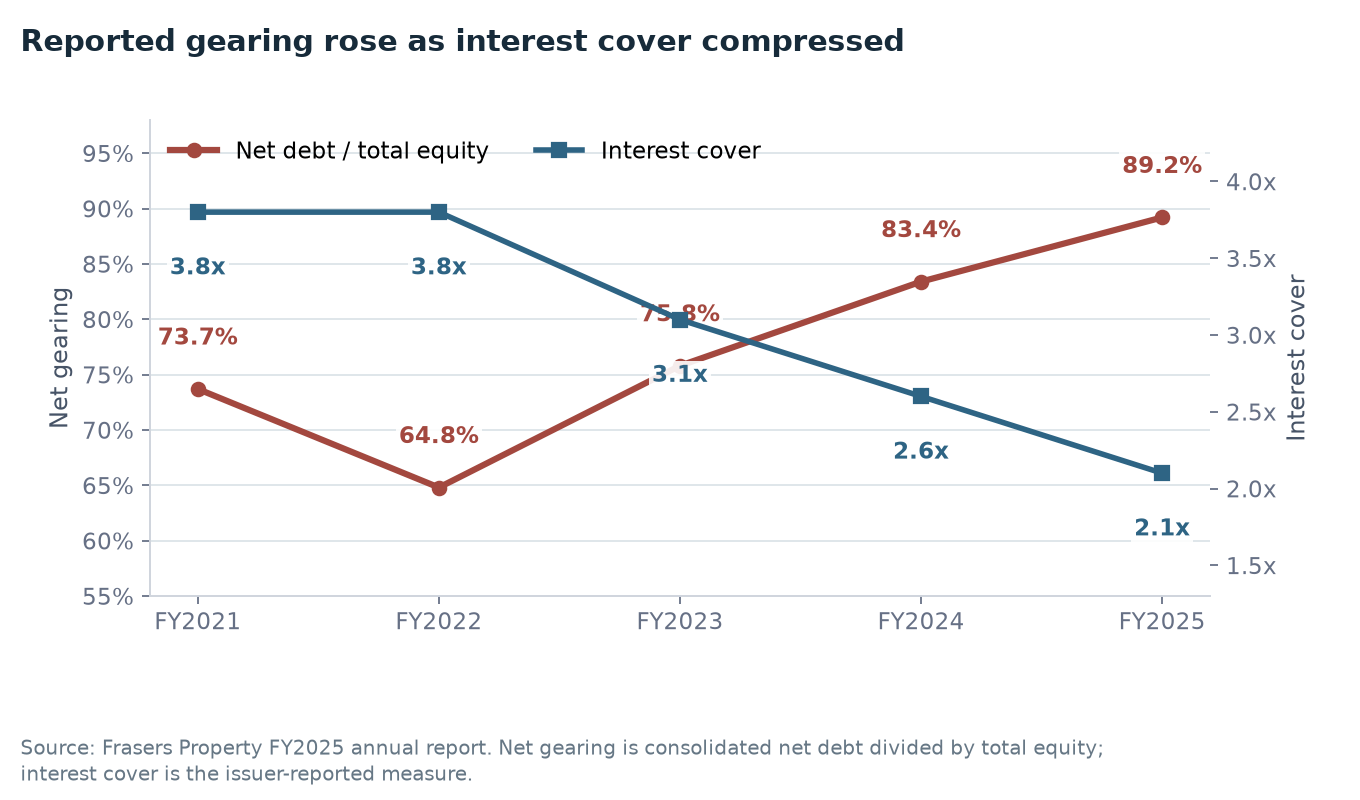
The tension is visible without a forecast. The recurring-profit measure and NAV per share weakened while reported net gearing rose and interest cover compressed. The dividend reached 4.5 cents in FY2023 and was held there through FY2025, rather than being constant across the full five years. Reported profit attributable is much more volatile than APBFE because it includes fair-value changes and exceptional items.
Revenue reached its five-year high in FY2024 before falling in FY2025. PBIT and APBFE remained below FY2021. Source: FY2025 annual report; actual reported periods only.The issuer's reported measures moved in opposite directions after FY2022: net debt rose relative to total equity while PBIT covered less net interest. Source: FY2025 annual report.
Source: FY2025 annual report five-year financial summary and audited FY2025 statements. APBFE and core EPS are issuer-defined measures.
10. FY2025: interest consumed almost half of PBIT
The audited income statement shows where earnings were absorbed. Revenue fell S$811.3m year on year and trading profit fell S$99.3m. Share of joint-venture and associate results also declined S$66.7m, taking PBIT to S$1.186bn. Interest expense of S$662.0m was only partly offset by S$84.5m of interest income, leaving S$577.6m of net interest expense — 48.7% of PBIT.
FY2025 income statement against FY2024 — S$m
Line
FY2024
FY2025
Change
Revenue
4,214.8
3,403.5
(811.3)
Gross profit
1,493.4
1,343.5
(149.9)
Trading profit
1,067.7
968.4
(99.3)
Share of JV and associate results
284.5
217.8
(66.7)
PBIT
1,352.2
1,186.2
(166.0)
Interest income
103.3
84.5
(18.9)
Interest expense
(627.8)
(662.0)
(34.3)
Profit before revaluation, tax and exceptionals
827.8
608.7
(219.1)
Revaluation movement and property-disposal gain
(198.6)
9.4
208.0
Profit before tax
652.4
581.1
(71.3)
Attributable profit before revaluation and exceptionals
218.2
239.4
21.3
Attributable profit after revaluation and exceptionals
206.3
243.1
36.8
The last two rows move in the opposite direction to revenue and PBIT because revaluation, exceptional and tax effects differ across the measures. In FY2025, the attributable result after those effects was S$3.7m above APBFE; in FY2024 it was S$11.8m below. The issuer identifies tax-provision reversals as earnings support and says attributable profit excluding the one-off reversal fell 50% year on year. Revenue, PBIT, APBFE and final attributable profit therefore need to be read as separate layers.
Source: FY2025 annual report, audited income statement, p.146 and annual summary.
11. The first-half PBIT increase came mainly from equity-accounted vehicles
In 1H FY2026, revenue declined 5.2% while PBIT increased 13.2%. Trading profit was only S$8.1m higher; share of joint-venture and associate results increased S$71.3m, from S$115.6m to S$186.9m. The PBIT improvement therefore came mainly from equity-accounted entities rather than a broad increase in consolidated trading profit.
First half against first half — S$m
Line
1H FY2025
1H FY2026
Change
Revenue
1,591.5
1,508.6
(82.8)
Gross profit
675.8
685.5
9.7
Trading profit
483.7
491.8
8.1
Share of JV and associate results
115.6
186.9
71.3
PBIT
599.3
678.7
79.4
Net interest expense
(281.5)
(286.2)
(4.6)
Profit before tax
284.5
338.2
53.8
Attributable profit before FV and exceptionals
136.7
138.1
1.3
Exceptional items attributable to owners
(0.9)
(41.6)
(40.6)
Profit attributable to owners
142.2
88.4
(53.7)
The S$41.6m attributable exceptional charge included a S$38.2m impairment of an investment in and loan to a Thailand joint venture. It is not part of recurring operating profit, but it is evidence about capital previously deployed. Interest cover of about 2.3x is consistent with S$678.7m of PBIT divided by net interest expense, and remains well below the 3.8x reported in FY2021 and FY2022.
Source: 1H FY2026 financial statements, pp.3-5 and results presentation. The change column is derived from filed amounts.
12. Operating cash did not cover capex and interest
FY2025 operating cash flow was S$1.031bn. Cash spent on investment property and property, plant and equipment totalled S$891.2m, while interest paid was S$664.7m. Those two uses together were S$525.2m greater than operating cash flow before dividends, acquisitions or debt repayment. Net financing cash flow was an outflow of S$1.576bn.
Reported cash-flow demands — S$m
Cash-flow line
FY2025
1H FY2026
Operating cash flow
1,030.7
276.5
Investment-property capex
(846.3)
(371.4)
PPE capex
(44.8)
(30.8)
Interest paid
(664.7)
(327.5)
Perpetual-security redemption
0
(300.0)
Net financing cash flow
(1,576.4)
not reproduced here
The March half was tighter: S$276.5m of operating cash against S$402.2m of property and PPE capex, S$327.5m of interest paid and the S$300m perpetual redemption completed in January. Gross debt nevertheless increased S$415.6m from September to March. A separate S$280m note was redeemed and cancelled in April, after the half-year balance sheet. These are dated cash events; they do not by themselves show which legal entity supplied the cash.
Sources: FY2025 annual report, cash-flow statement, pp.151-152; 1H FY2026 financial statements, pp.8-9; redemption notices dated 19 January and 21 April 2026.
13. Property assets include consolidated assets and equity-accounted stakes
The company-defined S$35.4bn property-assets measure is useful for gearing, but the audited balance sheet shows the underlying forms. At September 2025, investment properties were S$24.577bn, properties held for sale S$2.775bn, joint ventures S$3.812bn, associates S$1.328bn and property, plant and equipment S$2.030bn. Joint ventures and associates are carried as single equity-accounted lines rather than consolidated asset and debt schedules.
Selected balance-sheet assets — S$m
Asset
30 Sep 2025
31 Mar 2026
Accounting perimeter
Investment properties
24,577.4
24,797.3
consolidated line
Properties held for sale
2,774.5
2,926.9
consolidated disposal classification
Joint ventures
3,811.8
4,032.8
equity-accounted net investment
Associates
1,327.5
1,339.3
equity-accounted net investment
Property, plant and equipment
2,029.8
not in retained half-year table
consolidated line
Cash and cash equivalents
2,350.4
1,964.8
consolidated; fungibility varies
Total assets
39,747.6
40,045.1
consolidated group
At March, secured borrowings were S$1.636bn and unsecured borrowings S$16.442bn. Perpetual securities fell from S$496.4m to S$198.4m following the S$300m redemption. The large unsecured share explains why the FPL guarantee and capital-markets access matter alongside property collateral. Conversely, the presence of listed vehicles and equity-accounted entities explains why consolidated cash and asset values cannot be assumed to sit at the guarantor.
Sources: FY2025 annual report balance sheet and borrowings note; 1H FY2026 financial statements, pp.5 and 24.
14. The two maturity ladders cover different remaining periods
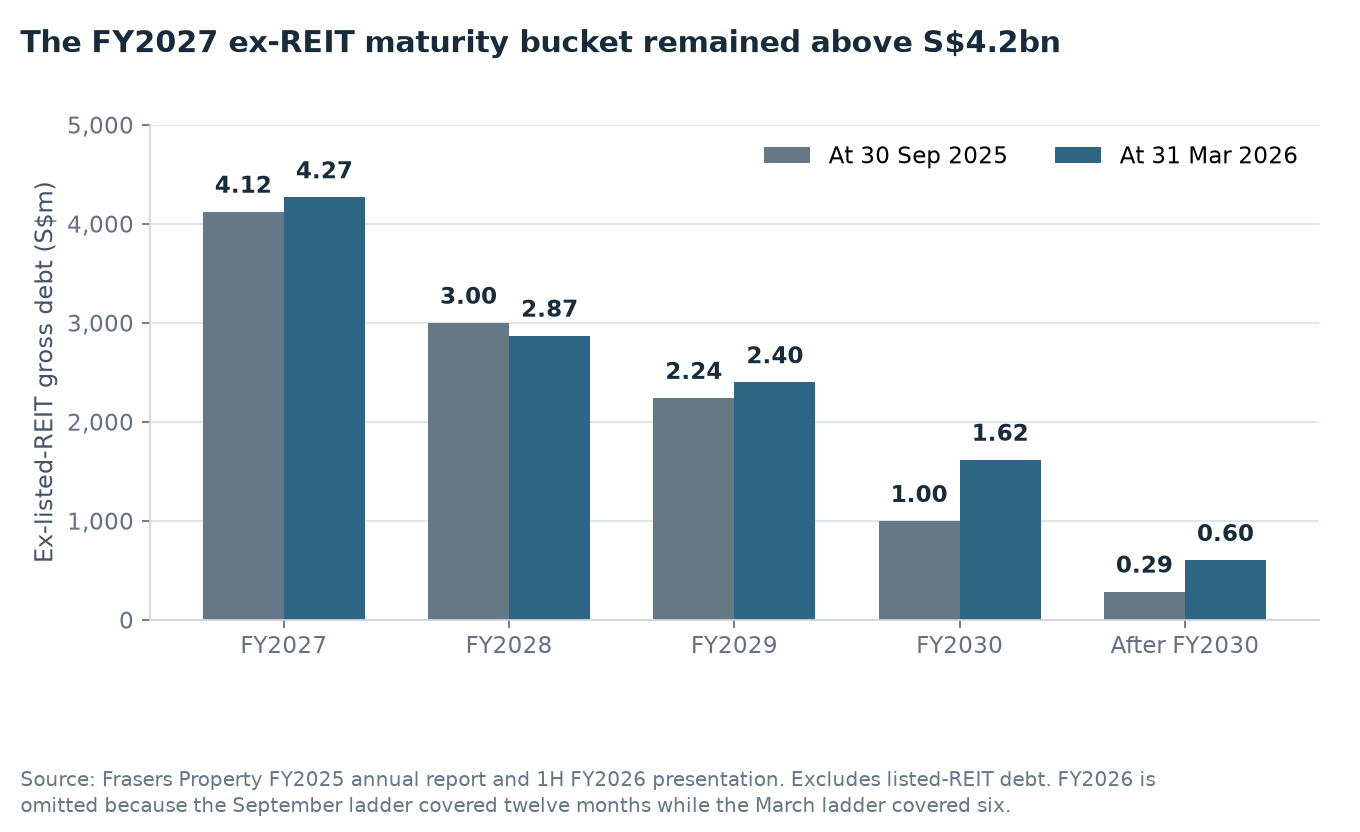
The annual report and half-year presentation both group maturities by financial year, but the near buckets are not directly comparable. The FY2026 bucket at 30 September 2025 covered twelve months; at 31 March 2026 it covered the remaining six months. A lower FY2026 balance partly reflects time passing and completed funding activity. The FY2027 and later buckets are more useful for seeing what was still ahead.
Ex-listed-REIT gross-debt maturity ladder — S$m
Financial year
At 30 Sep 2025
At 31 Mar 2026
Change
FY2026
1,918
1,304
(614)
FY2027
4,123
4,269
146
FY2028
3,001
2,871
(130)
FY2029
2,243
2,401
158
FY2030
999
1,618
619
After FY2030
286
605
319
Total ex-listed-REIT debt
12,570
13,068
498
FY2026 is excluded from the chart because the two snapshots cover different remaining portions of that financial year. The full table above retains both issuer figures. Source: FY2025 annual report and 1H FY2026 presentation.
The FY2027 ex-REIT bucket rose S$146m to S$4.269bn, while the total ex-REIT ladder increased S$498m. Treasury metrics moved in different directions: average debt cost fell from 4.0% to 3.8%, while the fixed-or-hedged share fell from 75.0% to 69.4%. The reported weighted-average maturity at September was 2.5 years; the retained March evidence does not support describing that measure as unchanged.
Sources: FY2025 annual report results presentation, pp.32-33; 1H FY2026 results presentation, p.18. Changes are arithmetic on two dated issuer ladders.
15. The parent guarantee book is larger than the visible note balance
The FY2025 company accounts disclosed guarantees over facilities of up to S$22.344bn, of which S$9.645bn of borrowing facilities was utilised. They also disclosed guaranteed medium-term-note and euro-commercial-paper programme limits of S$12.711bn with S$2.089bn issued, plus S$381.4m of interest-shortfall undertakings with S$276.8m outstanding. These are overlapping categories and limits, not amounts to add into a single debt total.
FPL company guarantee disclosures at FY2025 — S$m
Guarantee or undertaking
Limit / committed amount
Used / outstanding
Interpretation
Facilities guaranteed by the company
22,344.1
9,644.6
borrowing-facility utilisation within broader limits
Guaranteed MTN and ECP programmes
12,711.4
2,089.0
programme capacity versus securities issued
Interest-shortfall undertakings
381.4
276.8
undertaking amount outstanding
The group described financial covenants based on net gearing and consolidated net tangible assets and reported compliance throughout FY2025. Public evidence therefore supports the covenant types and the compliance statement. A numerical headroom calculation requires the contractual thresholds and exact guarantor perimeter. Separately, the FY2025 disclosure recorded more than S$4.5bn of group unutilised banking facilities; availability, commitment status and access at the FPL guarantor are the additional inputs needed before that number can be treated as refinancing capacity for the guaranteed notes.
Source: FY2025 annual report, company financial-guarantee and covenant disclosures, pp.260-261; FY2025 liquidity disclosure.
16. Hospitality restructuring occurred in two stages
The 2026 FHT optimisation followed a 2025 privatisation. Frasers Hospitality Trust announced a strategy review on 23 April 2025 and a trust-scheme privatisation on 14 May. Stapled securityholders approved the scheme on 15 August; the court sanctioned it on 3 September; it became effective on 23 September; consideration was paid on 30 September; and FHT was delisted on 1 October. After privatisation, Frasers Property held 63.28% and TCC Group Investments held 36.72%.
The second stage was announced on 25 June 2026, circulated to shareholders on 6 August and approved on 28 August. It moves assets and interests between FPL and the now-private FHT perimeter. The chronology matters because a transaction inside a privately controlled trust still changes which balance sheet holds each asset and liability, even though the sponsor remains economically exposed.
FHT optimisation consideration bridge — S$m
Component
Amount
Stapled-security divestment
344.4
Reversionary-interest divestments
18.2
Operating-company divestments
5.7
Total divestment consideration
368.3
Fraser Suites Singapore acquisition
117.5
MLBT transfers
66.8
Reversionary-interest acquisition
6.1
Total acquisition consideration
190.4
Fees
6.6
Stamp duty
53.0
Capital-gains tax
18.8
Stated net proceeds
99.5
The effective property price of S$1.453bn was 6.7% above the latest independent valuation of S$1.362bn and 1.6% above the S$1.430bn value implied by the take-private. The circular's FY2025 pro forma raised headline EPS from 5.9 to 6.1 cents, but diluted EPS before fair-value and exceptional items by 6.9%. The S$100.1m estimated accounting gain is also not the same measure as S$99.5m of stated net cash proceeds. Completion evidence and the debt actually retired remain the cash test.
Sources: retained FHT announcement stream for the 2025 scheme; FPL circular dated 6 August 2026 and EGM result dated 28 August 2026.
17. Sponsor transactions can be checked from both sides
Transactions with sponsored listed vehicles appear in two disclosure streams. On 25 August 2025, FPL announced the proposed acquisition of ten strata lots at Yishun 10 while Frasers Centrepoint Trust announced the divestment of the same lots; both sides filed completion on 23 September. On 25 May 2026, FPL announced the proposed divestment of interests in four German and Dutch properties while Frasers Logistics & Commercial Trust announced the acquisition; both filed completion on 31 July.
Selected sponsor-loop filings
Date
FPL-side filing
Related-vehicle filing
Status
25 Aug 2025
acquire ten Yishun 10 strata lots
FCT divest ten Yishun 10 strata lots
completed 23 Sep 2025
25 May 2026
divest interests in four Germany / Netherlands properties
FLCT acquire the same four properties
completed 31 Jul 2026
25 Mar 2025
Northpoint City (South Wing) transaction
FCT acquire North Gem Trust and trustee-manager
completed 26 May 2025
The two-sided filings are useful controls: consideration, completion date and related-party process can be compared without treating the vehicle's balance sheet as FPL's. They also show that capital recycling is not synonymous with money leaving the group perimeter permanently; FPL can sell assets to a vehicle in which it retains ownership, management economics or guarantees.
Sources: FPL, FCT and FLCT SGX announcement tapes; each related-vehicle filing is attributed to that vehicle.
18. Recycling and new deployment ran in parallel
The announcement tape shows capital being redeployed while gearing remained elevated. Frasers Property and Sekisui House announced the joint redevelopment of Robertson Walk and Fraser Place Robertson Walk into a waterfront project with 348 residential units in November 2024. In February 2026, Frasers Property won the collective-sale tender for the leasehold rear plot of The Centrepoint for S$391.9m. A consortium including FPL, FCT, Sunway MCL, Sekisui House and Lum Chang emerged as top bidder for the Bayshore Drive integrated site in July 2026.
In the other direction, the tape records the Northpoint City (South Wing) transaction, the four European properties described above and a proposed divestment of five Australian assets in July 2026. Announced transaction values are not cash until completion, and retained stakes can preserve exposure. The resulting capital-allocation question is specific: which completed disposals reduce guarantor debt, which proceeds fund new development, and what recurring earnings or liquidity is surrendered with each sale?
Source: FPL SGX announcement tape, November 2024 to July 2026. Event descriptions are announcement titles; no return assumption is added.
19. Board and operating leadership changed repeatedly
Selected governance and management events
Date
Filed event
Evidence use
7 Feb 2025
chairman retired, was appointed Chairman Emeritus; four related board-change notices
board transition
1 Apr 2025
board and audit-committee composition changes; one appointment and one cessation
committee continuity
6-7 Nov 2025
board, audit, executive and sustainability-and-risk committee changes; replacement filing followed
amendment lineage
9 Mar 2026
Group Chief Operating Officer appointed
group operating leadership
3 Jul 2026
cessation and designate appointment for CEO, Frasers Property Singapore
business-unit leadership
17 Jul 2026
cessation of CEO, Frasers Property Industrial
business-unit leadership
This ledger does not assign causation to the changes. It establishes that board and operating transitions occurred during the same period as high refinancing needs, asset recycling and new project commitments. The practical follow-up is continuity of delegated authority, risk oversight and the identities responsible for each funding and capital-allocation decision.
Source: FPL SGX announcement tape. Replacement notices are preserved rather than overwritten.
Cross-company read-throughs
These comparisons reuse evidence from other covered companies when a specific economic mechanism connects the source to this company; sector labels and apparent relatedness are not the test. Period, definition, geography, business mix and reporting perimeter are checked, and the external evidence remains a lead until this company's own disclosure confirms it.
Every other test on this page waits for the company to file. These do not. Each row is a series you can look up yourself, free, today — with the level this reading was built against, the levels that would put it in question, and what the series cannot tell you.
group refinancing cost and access — nothing public to watch
Searched MAS benchmark-rate and banking statistics, public investment-grade bond indices, and issuer debt disclosures. The group borrows across currencies, legal entities, secured and unsecured forms and listed vehicles, with a large fixed-or-hedged share; no public market series maps to the guarantor's actual refinancing cost or availability without an unsupported coefficient.
multi-country property values and transaction liquidity — nothing public to watch
Searched official Singapore property indices, national housing series in the group's other markets, and freely accessible global commercial-property transaction and valuation series. Frasers Property spans several countries and residential, retail, office, logistics and hospitality assets, while the company does not disclose a valuation-weighted geographic and asset-class bridge that could turn one public series into a faithful group signal.
Watchlist reviewed on 2026-08-28; each observation has its own date above. This watchlist date does not change the company research cutoff. A series moving past a level is a reason to re-read the case, not a recommendation. The same series across every company covered: what you can watch.
Download
A print-ready PDF of this page, for reading away from the screen: Frasers Property evidence library (PDF). It carries the same content as this page — the reporting snapshot, segment evidence, debt, liquidity and maturities, the Frasers Hospitality Trust transaction, the notes tender and outstanding senior notes, the five-year history, cash flow, the guarantee book and governance — and the same omissions: no rating, no fair value, no forecast.
The evidence set contains the FY2025 audited annual report and results materials, 1H and 3Q FY2026 disclosures, both completed FY2026 redemption notices, the FHT circular and EGM result, the completed Series 006 issue notices, both 31 August tender attachments, and the issuer and treasury announcement tape through the cutoff. Related listed-vehicle tapes were retained separately to avoid importing subsidiary or associate evidence into the parent without attribution.
Evidence boundary. This page is an unrated public evidence library. It excludes the private equity conclusion, security-level credit conclusions, pricing work, expected-return output and forward financial model. Consolidated cash is not assumed to be freely fungible. The 2036 terms are supported by the proposed-issue filing and final issue confirmation, not a located standalone pricing supplement. Research is AI-assisted and source-controlled; it is general research, not personal investment advice.
Reader questions & corrections
Ask about this company, challenge a source or suggest a factual correction. Only selected questions that SMID Research has reviewed and answered are published.
Submissions are private by default. Your email is encrypted and never published. Please do not send confidential or inside information, allegations about individuals, promotions, or requests for personalised investment advice.
Behind the lock The private vault contains the refreshed integrated equity and credit research, live-formula model, instrument analysis, retained source library and independent review records. It remains access-controlled and is not reproduced on this public evidence page.
These bounded retrospective corrections clarify specific published facts or calculations. They retain each report's existing research cutoff and do not represent a full refresh or a finding that all possible issues are resolved.
Frasers Property Limited
Verified Fact. The FY2025 profit discussion now separates tax, revaluation and exceptional effects and identifies the disclosed tax-provision reversal. Source basis: FY2025 results release, 14 November 2025. Limitation: It does not derive an unreconciled group-tax adjustment to shareholder profit.
Transcripts
Find available event transcripts in the transcript library.
· Frasers Property and Mitsubishi Estate to jointly redevelop Valley Point and Fraser Suites Singapore into landmark 999-year mixed-use riverfront destination · SGX
· Completion of the Proposed Fht Portfolio Optimisation · SGX
· Pricing of Fixed Rate Notes Due 2037 to Be Issued Pursuant to the Invitation and the New Issue · SGX
· Announcement on Offered Notes Accepted for Purchase in Connection with the Invitation · SGX
· Frasers Property acquires Cuppage Terrace to strengthen presence along Singapore's iconic Orchard Road · SGX
· Frasers Property, Frasers Centrepoint Trust, Sunway MCL, Sekisui House and Lum Chang consortium emerges as top bidder for landmark Bayshore Drive integrated site · SGX
· Proposed Divestment of Five Assets Located in Australia · SGX
· Frasers Property appoints Tan Wee Hsien as C hief E xecutive O fficer, Singapore · SGX
· Frasers Property appoints Tony Lombardo as Group Chief Operating Officer · SGX
· Frasers Property awarded collective sale tender for leasehold rear plot of The Centrepoint on Singapore's iconic Orchard Road for S$391.9 million · SGX
· Changes in the Composition of the Board of Directors, Audit Committee, Board Executive Committee and Sustainability and Risk Management Committee · SGX
· Completion of the Proposed Acquisition of Ten Strata Lots Located at Yishun 10 · SGX
· (I) Re-Designation of Non-Executive and Independent Director to Non- Executive and Non-Independent Director (Ii) Change in Composition of Remuneration Committee · SGX
· Frasers Property and Sekisui House to jointly redevelop Robertson Walk and Fraser Place Robertson Walk into a waterfront lifestyle hub with 348 residential units · SGX
Titles are from the linked SGX filing, with common words abbreviated. Summaries are written by AI and may contain inaccuracies; refer to the original announcement. Items after 31 August 2026 are not reflected in this page's analysis; earlier items are listed for reference, may not be discussed in it, and may have been updated by later announcements.