of FY2025 segment revenue came from Mechatronics
Frencken Group Limited
SGX: E28 · Information cut-off 27 August 2026
Investor snapshot
Business model
Frencken engineers and manufactures precision modules for semiconductor, medical, analytical, industrial and automotive equipment makers.
Latest figures
In 1H2026 revenue was S$427.8m and gross margin recovered to 15.0%, but operating cash flow swung to negative S$4.8m; at 30 June cash was S$123.0m, borrowings S$54.2m and leases S$64.1m. The S$100m placement then completed on 3 September 2026.
Main risk
The central risk is that working-capital growth and capacity spending outrun programme demand and returns.
Next proof
The next test is use of the placement proceeds, followed by cash conversion and utilisation evidence for the new facilities.
No public rating. Information cutoff 27 August 2026. Subsequent event: the placement of 44,081,591 new shares completed on 3 September 2026 and raised approximately S$100m gross; this bounded update is not a full research refresh. Latest reported period: 1H2026, unaudited, released 13 August 2026. Figures are reported (R), issuer guidance (G), derived from reported inputs (D), or external/secondary (E).
Evidence balance
The live questionWill programme work convert into cash fast enough while the Singapore capacity build and placement-proceeds deployment run in parallel?Operating cash flow turned negative in 1H2026 while the Singapore facility already carried contracted capital commitments. The placement completed on 3 September 2026, making proceeds deployment and operating cash conversion the next tests.
What improved
Gross profit rose 5.8% to S$64.4m and gross margin recovered to 15.0% from 14.1% on 1H2026 revenue of S$427.8m; the share taken by each period's top three customers fell to 41.4% from 48.0%, while revenue outside that group rose 11.9%.
What became more demanding
Operating cash flow swung to negative S$4.8m in 1H2026 from positive S$57.6m a year earlier, and contracted capital commitments of S$60.1m for the Singapore facility already stood at end-FY2025; of S$123.0m group cash at 30 June 2026, only S$37.4m sat at the listed parent, and lease liabilities were S$64.1m.
Strongest alternative explanation
The build could reflect timing rather than strain: the company attributes the working-capital increases to customer-order fulfilment, higher 2Q revenue, construction progress payments and supplier prepayments, which would be consistent with cash following shipments and a facility being built, and does not by itself establish weaker collection or unfunded expansion.
The decisive missing fact
A facility-only bridge of paid, prepaid, committed and remaining cash by period, plus gross supplier-finance draws and the outstanding supplier-finance balance at 30 June 2026, would settle whether the working-capital build is programme timing or unfunded expansion.
Drawn from the evidence on this page: the improvement, the constraint, the benign reading and the fact that would settle it. It states no view on the shares.
About the private research record
Also on file behind the rated view 🔒 (author-only): the private equity and credit decisions, historical written reports and the 27 August event update. The financial spread and model predate the placement and are pending next build. Kept private; not for distribution.
On this page
Frencken at a glance
Scale, mix and concentrationof 1H2026 group revenue came from semiconductor customers
of FY2025 revenue came from the three largest customers
production countries named in FY2025 reporting across Europe, Asia and America
Business anatomy · from inputs to customer value
Frencken builds what equipment makers put inside their own systems
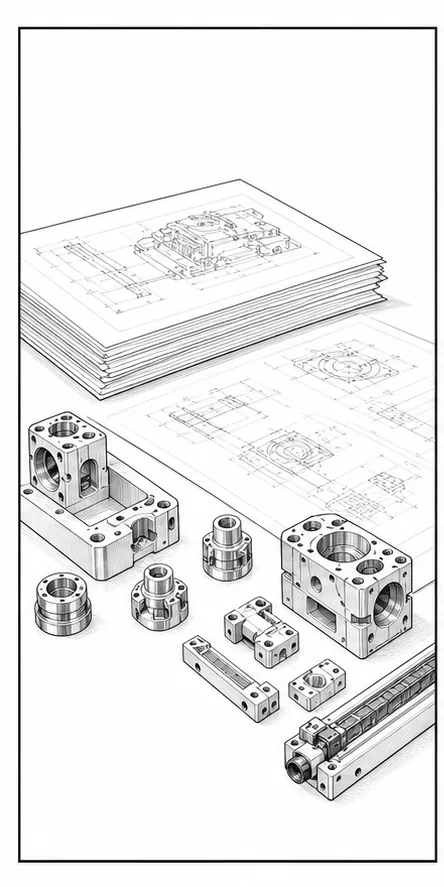
The direct customer is usually the equipment OEM: Frencken co-develops and manufactures precision parts, modules or machines that the OEM integrates or sells under its own name.
Follow the operating chain from demand or inputs to customer outcome and cash.
Customer needCustomer programme
The OEM sets the brief
What happensA capital-equipment maker or automotive programme supplies design intent, specifications and expected volumes.
Commercial triggerCustomer programmes pull demand into Frencken rather than a consumer brand sale.
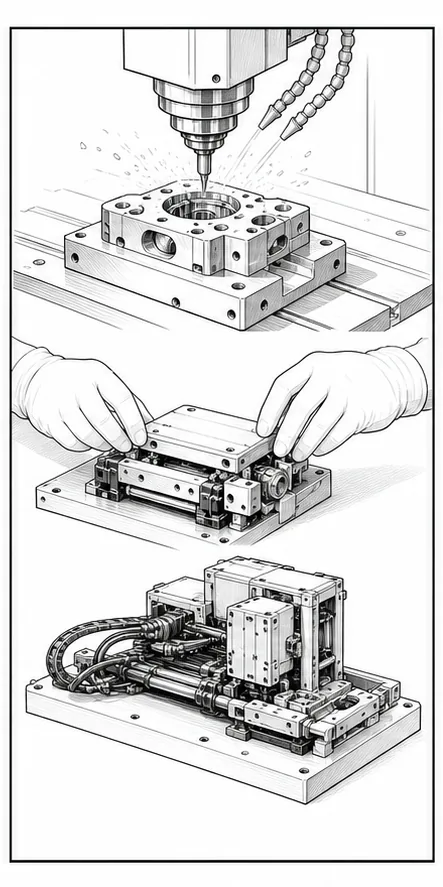
Company actionEngineering
Co-develop the build
What happensFrencken applies design-for-manufacture, precision production, cleaning, assembly, integration and testing.
Value createdQualified engineering and manufacturing capability earns programme work.
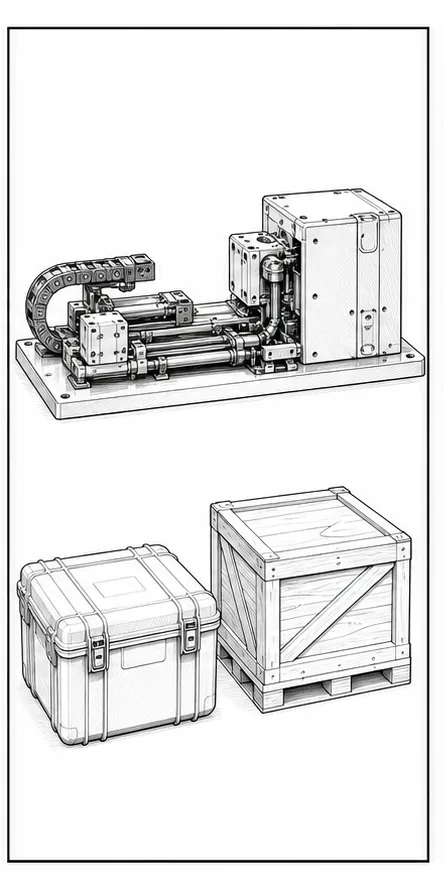
Product deliveredWhat Frencken ships
Deliver a part or machine
What happensThe output may be a precision part, motion module, assembly or sometimes a complete machine.
Who paysThe equipment maker pays Frencken for accepted deliveries or contracted milestones.
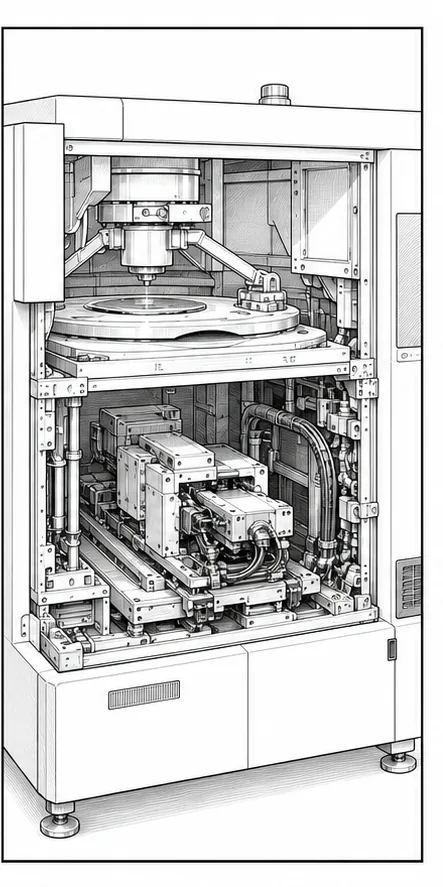
End-market exposureUltimate use
The customer owns the end brand
What happensThe OEM integrates Frencken’s work into wafer tools, laboratory systems, automation or vehicle applications.
Demand driverEnd-market cycles reach Frencken through the OEM’s order programme.
Investor translation
What matters after the operating picture
Four questions connect the business model to cash and balance-sheet risk. This is a factual reading aid, not a valuation or recommendation.
- Value lever
- Program volumes, gross margin and returns on new precision-manufacturing capacity.
- Cash bottleneck
- Inventory, receivables and expansion spending rise before qualified programs convert to cash.
- Balance-sheet pressure
- Cash after normal supplier funding and capital spending falls short of current debt and commitments.
- Next proof
- Gross margin above the cycle, customer-program growth and supplier-finance-adjusted free cash flow.
Text version of this comic
- Customer need · The OEM sets the brief A capital-equipment maker or automotive programme supplies design intent, specifications and expected volumes. Commercial trigger: Customer programmes pull demand into Frencken rather than a consumer brand sale.
- Company action · Co-develop the build Frencken applies design-for-manufacture, precision production, cleaning, assembly, integration and testing. Value created: Qualified engineering and manufacturing capability earns programme work.
- Product delivered · Deliver a part or machine The output may be a precision part, motion module, assembly or sometimes a complete machine. Who pays: The equipment maker pays Frencken for accepted deliveries or contracted milestones.
- End-market exposure · The customer owns the end brand The OEM integrates Frencken’s work into wafer tools, laboratory systems, automation or vehicle applications. Demand driver: End-market cycles reach Frencken through the OEM’s order programme.
How Frencken fits into the equipment supply chain
The 30-second version. Frencken is generally not the brand on the finished semiconductor tool, laboratory instrument or car. Its direct customer is usually the equipment maker. Frencken co-develops and manufactures the precision parts, assemblies, modules or machines that the customer sells or integrates into a larger system. Demand therefore reaches Frencken through customer programmes, while the underlying cycle begins with fabs and test houses, laboratories, hospitals, factories and vehicle platforms.
Frencken ships this
A part, a module, an assembly or sometimes a finished machine, built to the customer’s design intent.
The customer sells this
The finished tool carries the customer’s name, not Frencken’s. The orange block is the part Frencken built.
ISO6 and ISO7 cleanroom assembly“over 2000 unique items” per system“over 800 manufactured parts”
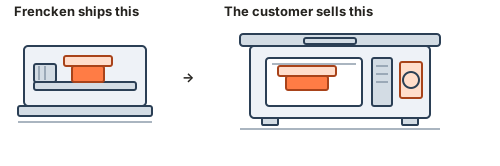
Left: the unit Frencken delivers, shown as a module with an orange moving carriage on a rail. Right: the customer’s complete tool, with the same orange module inside it and an unlabelled brand plate on the hood. The illustration establishes only the commercial relationship — who sells the finished equipment — not the appearance, size or content of any actual product.
Specialist inputsMachined metals, electronics, motors and motion parts, vacuum components, polymers, coatings and tooling
Frencken's roleCo-development and design-for-manufacture → precision production → cleaning and cleanroom assembly → system integration and testing
Direct customerGlobal capital-equipment OEMs; automotive Tier-1 suppliers and OEM programmes
Ultimate useWafer tools, die bonders and IC testers; laboratory and medical systems; automation; automotive radar and assemblies
Read left to right: specialist inputs enter Frencken's engineering and manufacturing process; Frencken supplies an equipment maker or automotive programme; demand ultimately depends on the equipment, laboratory, industrial or vehicle application.
That position matters. Frencken can deepen its share of a successful customer programme without owning the end-product brand, but it also inherits programme timing, customer concentration and capital-equipment cycles. Engineering qualification can make a relationship durable; it does not remove the risk of volume pauses, redesigns, price pressure or idle capacity.
Mechatronics
High-precision parts
Individual pieces cut and finished to tight tolerance — the smallest thing Frencken sells.
Mechatronics
Modules that move
Assemblies with motion built in, put together in a cleanroom — the part of a tool that has to position accurately.
Mechatronics
Complete machines
At the top end Frencken describes building whole systems, which the customer then sells under its own name.
APS
Moulded, coated, boxed
Tooled and injection-moulded plastic parts, surface-finished, then built up into modules and box-build units.
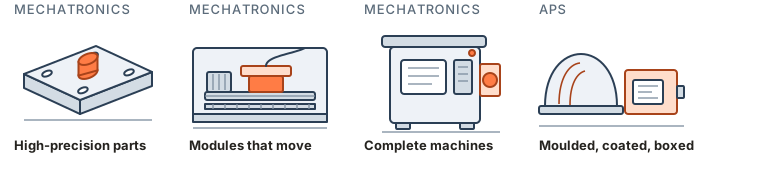
Four output forms, left to right: a machined high-precision part; a cleanroom-assembled module containing a motion system; a complete machine; and, for Advanced Plastics Solutions, a moulded and coated plastic part with a box-build unit. The illustration establishes what kinds of things Frencken sells, not their relative value, volume or physical appearance.
Mechatronics
The larger segment handles high-mix, high-complexity precision components, electromechanical assemblies, modules and complete machines. Capabilities include co-development, design for manufacturability, machining, cleanroom assembly, integration, testing and product-lifecycle transfers.
Co-developMachineClean assembleIntegrate & test
- Who buys and why
- Equipment OEMs outsource technically demanding work that becomes part of their final capital equipment, while retaining the customer-facing system or brand.
- What drives revenue
- Programme wins and share, customer production volumes, product mix, qualification and ramp timing.
- What drives profit and cash
- Materials, direct labour, factory and cleanroom utilisation, engineering overhead, inventory, receivables and capacity investment.
- Main vulnerabilities
- Customer and programme concentration, semiconductor-equipment cycles, ramp execution and underused capacity.
APS / IMS
This business combines tooling, precision injection moulding, plastic metallisation and coating, printed-circuit-board and box-build work, assembly and testing. Its history spans automotive and office-automation programmes, including radar-antenna, interior, dashboard and other plastic or electromechanical applications.
ToolMouldCoatAssemble & test
- Who buys and why
- Automotive and office-automation customers use the segment for moulded, coated and assembled production parts.
- What drives revenue
- Platform awards, programme volumes, content per unit, product mix and ramp schedules.
- What drives profit and cash
- Material prices and yield, tooling recovery, labour and machine utilisation, working capital and programme-specific investment.
- Main vulnerabilities
- Automotive-platform timing, price-down expectations, input costs, quality execution and returns during underutilised periods.
Production spans three regions
Europe
- Netherlands
Asia
- China
- Malaysia
- Singapore
America
- United States
Manufacturing location, customer headquarters, billing destination and the end-user's demand location can all differ. A geographic revenue table therefore should not be read as a factory-utilisation map or a clean measure of ultimate semiconductor demand.
Peers: compare the role, not just the label
- Grand Venture Technology: a capability and outsourced-manufacturing peer.
- UMS: a narrower semiconductor-equipment manufacturing comparison.
- AEM: adjacent to the semiconductor test ecosystem, but a test-solutions technology company rather than a direct manufacturing twin.
- Fu Yu: a closer reference for plastics and tooling within APS.
These are operating reference points, not an assertion that their valuation multiples are interchangeable.
From an equipment cycle to Frencken's cash flow
Customer demandOEM programme volume × Frencken programme share × price and mixWatch: customer outlook and equipment-cycle signals
RevenueQualification, ramps, transfers and shipment timingWatch: segment growth, customer mix and guidance
Gross profitMaterials, direct labour, mix and factory utilisationWatch: gross margin and ramp commentary
Operating profitEngineering, selling and central overheadWatch: staff, transformation and consultancy costs
Cash and returnsInventory, receivables, capex, funding and capacity utilisationWatch: working capital, facility spend and cash conversion
The financial record
Revenue rose from S$466.4m in FY2016 to S$865.1m in FY2025, while profit attributable to shareholders rose from S$15.9m to S$39.1m. The path was cyclical: PATMI peaked at S$58.7m in FY2021, fell to S$32.5m in FY2023 and recovered to S$39.1m in FY2025. (R)

| S$'000 | FY2021 | FY2022 | FY2023 | FY2024 | FY2025 |
|---|---|---|---|---|---|
| Revenue | 767,069 | 786,107 | 742,859 | 794,333 | 865,121 |
| Operating profit | 71,924 | 66,643 | 46,338 | 51,519 | 53,418 |
| PATMI | 58,727 | 51,874 | 32,475 | 37,120 | 39,120 |
| Gross margin | 16.8% | 15.1% | 13.2% | 14.5% | 14.3% |
| ROE | 16.5% | 13.5% | 8.2% | 8.9% | 8.6% |
FY2021 and FY2025 are the useful bookends. Revenue rose 12.8%, but gross profit fell 4.3% and PATMI fell 33.4%. At the FY2021 gross margin, FY2025 gross profit would have been about S$22.0m higher. That arithmetic does not establish why the margin moved; it establishes the question the current cycle must answer. (R/D)

How the segment mix changed
Mechatronics revenue rose from S$301.9m in FY2016 to S$778.4m in FY2025. APS—formerly IMS and earlier EMS—fell from S$164.5m to S$83.1m. Mechatronics supplied about 90% of FY2025 segment revenue; APS recorded a S$1.1m operating loss. (R/D)

The latest filings also disclose customer concentration. Frencken's three largest customers contributed 47.7% of FY2025 revenue. The share attributable to each period's top three fell to 41.4% in 1H2026 from 48.0% in 1H2025: top-three revenue declined 14.6%, while revenue outside that group rose 11.9%. That is supportive evidence, but the identities may differ by period and semiconductor customers still supplied 49.9% of group revenue in 1H2026. (R/D)
Customer concentration, as disclosed. Shares are recomputed from the filed figures (D); the identities of the customers are not disclosed.
| FY2024 | FY2025 | 1H2026 | |
|---|---|---|---|
| Revenue from the three largest customers (S$m) | 417.6 | 412.7 | n/a (share only) |
| … as a share of group revenue | 52.6% | 47.7% | 41.4% |
| Trade receivables owed by four major customers, share of the balance | 37% | 31% | n/a |
| Semiconductor segment, share of group revenue | 46.0% | 49.3% | 49.9% |
| Goodwill sensitivity: the Singapore cash-generating unit’s recoverable amount if uncontracted revenue from one major customer is excluded (S$m) | n/a | 35.7 → 9.7 | n/a |
Sources: FY2025 annual report, segment note 32(c) and notes 18, 20; FY2024 annual report; 1H2026 results announcement. Semiconductor share for FY2024 recomputed from the segment revenue of S$365.5m. (R/D)
What changed in 1H2026
1H2026 revenue was S$427.8m, down 0.8% year on year. Gross profit rose 5.8% to S$64.4m, taking gross margin to 15.0% from 14.1%. PBT rose 1.1% to S$25.0m, while PATMI declined 3.4% to S$19.3m. Administrative expenses rose 9.9%, mainly from staff, transformation and consultancy costs. (R/D)
The quarter split matters: 2Q revenue grew 4.7% year on year and 2Q PATMI grew 13.7%, offsetting a weaker first quarter. Management expects 2H2026 revenue above both 2H2025 and 1H2026, and FY2026 revenue and profit above FY2025, subject to the external environment and foreign exchange. (R/G)
Management's longer objective is to cross S$1bn of annual revenue by 2028, potentially earlier, through organic expansion and strategic investment or M&A. From FY2025, S$1bn by FY2028 requires about 4.9% annual growth. The filings do not provide a corresponding margin or return-on-capital target. (G/D)
APS also recorded an early improvement: its segment result moved from a S$0.1m loss in 1H2025 to a S$1.4m profit in 1H2026, equivalent to a 3.3% segment-result margin. This reverses the latest half-year loss but does not yet establish an acceptable through-cycle return. (R/D)
What the 27 August placement changes
After the market close on 27 August 2026, Frencken announced a best-efforts placement of 44,081,591 new shares at S$2.2687 each. The price is 9.997% below the S$2.5207 volume-weighted average price on 25 August, before the 26–27 August trading halt. The placement was not underwritten. Frencken reported on 3 September 2026 that the placement had completed, was fully subscribed and raised approximately S$100m gross; the new shares were scheduled to begin trading at 9:00am on 4 September. (R/D)
The new shares equal 10.27% of the 429,328,409 shares outstanding when the agreement was signed and 9.31% of the expected enlarged 473,560,000-share base after a separately expected allotment of 150,000 option shares. Gross proceeds are S$100.0m and estimated net proceeds are S$97.1m. The filing allocates 90%, or about S$87.4m, to general corporate purposes including expansion, strategic investments, acquisitions, joint ventures and strategic alliances; 10%, or about S$9.7m, is for working capital and/or repayment of bank borrowings. (R/D)
The company used the non-pro-rata share-issuance authority approved at the 2026 AGM, so the placement does not require a transaction-specific shareholder vote. It accepted a six-month issuance moratorium with stated carve-outs for options and transactions. The filing says there is no transfer of control and records 2,922,000 placement shares allocated to substantial shareholder Amova Asset Management Asia. The announcement names no acquisition target, project-level return hurdle, leverage guardrail or permanent-liquidity policy. It says periodic use-of-proceeds announcements will follow. With completion recorded, subsequent capital deployment is the new evidence to watch. (R/G)
Cash conversion and the capacity build
Frencken reported negative S$4.8m of operating cash flow in 1H2026 versus positive S$57.6m a year earlier. Inventory increased by S$37.8m from December 2025, trade receivables by S$22.6m, and current plus non-current other receivables, deposits and prepayments by about S$27.4m. The company attributes the increases to customer-order fulfilment, higher 2Q revenue, construction progress payments and supplier prepayments. (R/D)

The balance sheet remained liquid at 30 June 2026: cash was S$123.0m, borrowings S$54.2m and net cash S$68.8m; debt to equity was about 11.1%. Lease liabilities were S$64.1m. The listed parent held S$37.4m of group cash, but the filings do not map the remaining subsidiary cash or quantify local operating needs and upstreaming constraints. (R/D)
The main capacity project is a new Singapore facility scheduled to be operationally ready in 2H2027 for semiconductor and aerospace customers. FY2025 capital commitments contracted but not provided for rose to S$60.1m from S$0.5m a year earlier. The filings do not publish committed customer revenue, utilisation targets or a return threshold for the facility. (R)
Where the cash went, FY2021–FY2025
Capital allocation, as filed. Operating cash flow is on the annual-report presentation, which from FY2024 reclassifies supplier-finance cash flows; the results announcements first reported FY2024 as S$48.0m and FY2025 as S$103.5m.
| S$m | FY2021 | FY2022 | FY2023 | FY2024 | FY2025 |
|---|---|---|---|---|---|
| Operating cash flow | 40.4 | 37.8 | 49.0 | 100.6 | 166.7 |
| Purchase of property, plant and equipment | 17.5 | 42.6 | 26.8 | 13.1 | 17.9 |
| … as a share of revenue | 2.3% | 5.4% | 3.6% | 1.6% | 2.1% |
| Dividends paid in the year | 12.8 | 17.6 | 15.5 | 9.7 | 11.1 |
| Dividend declared for the year (cents per share) | 4.13 | 3.64 | 2.28 | 2.61 | 2.75 |
| Net cash at year end | 95.4 | 58.2 | 50.6 | 72.6 | 139.6 |
| Capital commitments contracted, not provided for | 4.4 | 3.8 | 1.0 | 0.5 | 60.1 |
Sources: annual reports FY2021–FY2025 (cash-flow statements, dividend notes, capital-commitment notes); results announcements for the as-first-reported operating cash flow. Shares of revenue recomputed. The company states that it has paid a dividend every year since listing in 2005, representing at least 30% of annual earnings. No acquisition or disposal consideration is separately disclosed in the window. (R/D)
Two things the table shows without commentary. Capital expenditure on plant has run at 1.6–5.4% of revenue, and the year of heaviest spending (FY2022) preceded the profit trough rather than the recovery. The S$60.1m of commitments at end-FY2025 is the Singapore facility: it is roughly two and a half years of the FY2021–FY2025 average plant spend, to be funded, the company says, from internal resources and borrowings. (R/D)
The programmes the company has named, and how their dates have moved
Strategic initiatives as filed, in the order announced. The third column records the most recent date or status the company has given, so a moved date shows as a difference between the second and third columns; the last column is what the filings do not say.
| Initiative | As first announced | As most recently stated | Last filed milestone | Not disclosed |
|---|---|---|---|---|
| New Singapore Mechatronics facility, Kaki Bukit | 3 Jun 2025: 33-year JTC lease, 28,594 sqm, about S$63m, construction from 3Q25, completion by 1Q27 | 13 Aug 2026: operationally ready by 2H27 | Groundbreaking 12 Aug 2025; cleanroom assembly capacity “projected to triple”; S$60.1m contracted at end-FY2025; construction progress payments in 1H2026 | Committed customer revenue, utilisation targets, a return threshold |
| New USA facility | 27 Feb 2025: to be inaugurated in 1H25 to expand US production capacity | 27 Feb 2026: new leases for facilities in the USA and Singapore lifted right-of-use assets to S$68.9m | 14 Aug 2025: “new USA facility to bring additional production capacity” | Cost, capacity, the programmes it serves |
| Malaysia Mechatronics capacity | 27 Feb 2026: leasing another industrial building for warehousing; converting storage area to production | 13 Aug 2026: plans to review the capacity and capabilities of the Malaysia operations | — | Cost, timing, capacity |
| APS radar antennas for automotive (Gapwaves partnership) | 27 Feb 2025: second programme, for another global automotive supplier; serial production progressively from 2026 | 13 Aug 2026: production expected to ramp up in 2H26; assessing a Southeast Asian production base | 27 Feb 2026: the business “could be on the cusp of an inflection point in FY2026” | Volumes, revenue, contract terms |
| APS consolidation in Malaysia | 27 Feb 2026: Sungai Buloh production to be consolidated into the Johor site | — | — | Cost, savings, timing |
| APS plastic gearbox, motor and control systems for service robots and humanoids | 17 Nov 2025: “in an infancy stage” | 13 Aug 2026: introduced to prospective customers; still in the infancy phase | 27 Feb 2026: development partnership formed with SENTImotion and Envalior under the SMF Drives brand | Timeline, commercial revenue and customer wins |
| Organisational alignment and ERP replacement | 19 May 2026: multi-phase centralisation of horizontal functions to support growth past S$1bn | 13 Aug 2026: new and upgraded ERP expected to be completed in 2027 | 1H2026 administrative expenses up 9.9% on transformation and consultancy costs | Programme cost, targeted savings |
| Proposed S$100m placement | 27 Aug 2026: 44.08m new shares at S$2.2687; about S$97.1m estimated net proceeds; as stated on 27 Aug, completion was then expected on 3 Sep 2026 | — | 90% allocated broadly to expansion, strategic investments, acquisitions, joint ventures and alliances; 10% to working capital and/or bank-debt repayment | Named targets, timing, return hurdle, leverage guardrail and the final use-of-proceeds bridge |
| S$1bn annual revenue | 13 Aug 2026: “could cross the S$1 billion annual revenue mark by 2028 if not earlier”, organic and through acquisitions | — | FY2025 revenue S$865.1m | A margin or return-on-capital target; the acquisition criteria |
Sources: SGX announcements of 3 Jun 2025, 12 Aug 2025, 27 Feb 2025, 17 Nov 2025, 27 Feb 2026, 19 May 2026, 13 Aug 2026 and 27 Aug 2026; FY2025 annual report note 33. Quoted phrases are the company’s. (R/G)
Board, management and pay, as disclosed
The board has five members, three of them independent, after the April–May 2026 rotation. The executive director is the President; the chair is a non-independent non-executive director. Pay is disclosed in the FY2025 annual report in the form below; the company discloses key-management pay in S$250,000 bands rather than exact amounts, citing competitive sensitivity. (R)
Directors and key management at 23 August 2026. FY2025 remuneration as filed; percentages are the disclosed mix of salary / bonus / fringe benefits / fees.
| Name | Role | On the board or in post since | Background, as stated | FY2025 remuneration |
|---|---|---|---|---|
| Dato’ Seri Gooi Soon Chai | Chairman, non-executive non-independent director; member of the Remuneration and Nominating Committees | Director 10 Feb 2015; chairman 10 Aug 2016 | “Over 40 years of distinguished leadership experience” in the technology industry | S$109,000 (fees) |
| Dennis Au (Mohamad Anwar Au) | President and executive director | President 5 May 2015; executive director 28 Apr 2016 | Charts strategy and oversees global operations; steers the Mechatronics and APS divisions | S$1,641,437: salary 39% / bonus 40% / benefits 13% / subsidiary fee 8% |
| Dato’ Noorashidah Binti Ahmad | Lead independent director; chairs the Remuneration Committee; Audit and Nominating Committee member | Director 1 Mar 2024; lead independent 8 May 2026 | Over 30 years at Hewlett-Packard, Agilent and Keysight in manufacturing and supply chain; currently a vice president and general manager of global manufacturing and supply chain | S$99,000 (fees) |
| Foo Seang Choong | Independent director; Audit and Remuneration Committee member (chaired the Remuneration Committee until May 2026) | 31 Dec 2021 | Over 35 years in finance, business strategy and organisational transformation in listed technology companies | S$89,000 (fees) |
| Tay Peng Huat | Independent director; chairs the Nominating Committee; Audit Committee member | 8 May 2026 | Former CFO of Beyonics Technology and Group Financial Controller of Electronic Resources, per the Rule 704(7) disclosures in his appointment announcement | — (appointed after FY2025) |
| Melvin Chan Wai Leong | Retired lead independent director and Audit Committee chairman | 27 Apr 2017 to 24 Apr 2026 (nine-year tenure limit) | — | S$104,000 (fees) |
| Brian Tan Chuen Yeang | Chief Financial Officer | 31 Dec 2021 | Previously CFO Malaysia and Singapore at Knauf-USG Boral; Usaha Tegas, NBK Group, Bumi Armada, Petronas | Top six key management personnel (not directors): S$3,299,389 in aggregate, each within a disclosed band between S$250,000 and S$1,000,000 |
| Wang Liang Horng | Managing Director and Vice President, Frencken Mechatronics Asia | n/a | Speaks for the Singapore facility programme in the 12 Aug 2025 release | |
| Rutger van Galen · Ron Borger · Theo van de Pol · Teh Kok Keng | Key management (Mr van de Pol: Vice President, Human Resources from Feb 2025) | n/a | — |
Sources: FY2025 annual report (board and key-management profiles, corporate governance statement, remuneration tables); SGX announcements of 1 Mar 2024, 24 Apr 2026 and 8 May 2026. The FY2025 report states no external remuneration consultant was engaged and that no employee who is a substantial shareholder or an immediate family member of a director earned above S$100,000. (R)
What the filings leave open: the band each key manager falls in is not mapped to a name in the text of the report; no succession arrangement for the President has been announced; and director and key-management dealings appear only as the routine interest notices on the tape, which this page does not enumerate. (R/D)
The share price and what came with its moves
Over the window Frencken returned 169% on a dividend-adjusted basis. The index returned 80%, but the peer median returned 133% — so the margin over its own sector is about 36 percentage points, not the 89 an index-only comparison implies.
Key: Frencken (E28) as a solid line; Straits Times Index rebased, dashed; peer median rebased, dotted; the peer median runs off scale Mar 24–Jan 26 and is clipped there; filing ticks above the axis; ex-dividend ticks on it; numbered pins are moves with a written note; plain dots are other detected moves.
Key moves
The five largest moves over a day or up to two weeks, with no day counted twice.
- 3323 Jun 2026 · −13% · index 0% · peers −10%
- 3222 Jun 2026 · +13% · index 0% · peers +4%
- 27week to 10 Apr 2026 · +17% · index +1% · peers +10%
- 24week to 27 Feb 2026 · +14% · index −1% · peers +11%In the same week: · FY2025 results: record revenue of S$865.1m (up 8.9%) and PATMI of S$39.1m (up 5.4%); dividend 2.75 cents; net cash S$139.6m.
- 17week to 25 Jul 2025 · +15% · index +2% · peers +4%
Each move is shown next to the market over the same days (and peers, where shown). News listed with a move was published within its dates; that does not mean the news caused the move. The quarter view has all the news.
Index: Straits Times Index. Peers: the median of four listed companies used as a sector check; the notes name them and their limits.
Q3 2023
22 Aug 2023 – 29 Sep 2023 (part quarter)E28 +10.9%STI +1.8%Peer median +6.4%Range S$1.01–S$1.12Close S$1.12
Key developments
14 Aug 2023 · 1H2023 results: revenue down 9.7% to S$351.0m and PATMI down 53.8% to S$12.1m as the semiconductor downcycle bit.
Gross margin contracted to 12.3% from 15.6%, which the company attributed to lower revenue, inflationary cost pressures and higher depreciation from the facility build-out. Semiconductor revenue fell 19.7% to S$122.7m (Asia down, Europe up on a key customer), industrial automation fell 38.8%, while medical rose 29.0% and analytical & life sciences rose 7.0%. Net cash was S$20.9m.
Guidance: 2H23 revenue expected to be stable against 1H23; semiconductor higher, industrial automation lower.
Large price moves
- 114 Sep 2023 · +8% · index +1% · peers 0%
Q4 2023
2 Oct 2023 – 29 Dec 2023E28 +20.5%STI +0.7%Peer median +4.2%Range S$1.04–S$1.37Close S$1.35
Key developments
22 Nov 2023 · S$1.08 · 3Q23 business update: revenue down 5.6% year on year to S$184.4m, but the third straight quarter of sequential improvement.
PATMI fell 35.1% to S$7.1m and gross margin was 12.4%. Semiconductor revenue was down 10.5% year on year at S$74.6m but up 15.0% on the quarter; industrial automation fell 63.5% to S$6.8m on a key customer's capital-expenditure timing. Nine-month revenue was S$535.4m with net profit of S$19.2m.
Guidance: 2H23 revenue expected to be stable against 1H23, with semiconductor, medical and analytical & life sciences higher and industrial automation lower.Next session (23 Nov): E28 +7.4% · STI −0.1% · peers −0.2%
Large price moves
- 211 Oct 2023 · +7% · index 0% · peers +1%
- 323 Nov 2023 · +7% · index 0% · peers 0%
Q1 2024
2 Jan 2024 – 28 Mar 2024E28 +23.7%STI −0.5%Peer median −26.0%Range S$1.27–S$1.74Close S$1.67
Key developments
27 Feb 2024 · S$1.53 · FY2023 results: revenue down 5.5% to S$742.9m and PATMI down 37.4% to S$32.5m; dividend cut to 2.28 cents from 3.64.
Gross margin was 13.2% against 15.1% a year earlier. The second half was markedly better than the first: 2H23 revenue of S$391.8m was up 11.6% half on half and 2H23 PATMI of S$20.4m was up 69.0%, on demand and new programmes from key European semiconductor and analytical & life sciences customers. Trade receivables rose to S$171.2m from S$123.2m on new semiconductor programmes in the fourth quarter. Capex was S$26.8m; net cash S$50.6m.
Guidance: 1H24 revenue expected to be stable against 2H23; semiconductor and medical higher, industrial automation lower.Next session (28 Feb): E28 −0.7% · STI −0.6% · peers +0.0%1 Mar 2024 · S$1.65 · Board change: Dato' Noorashidah Binti Ahmad appointed independent director; Chia Chor Leong resigns.
The new director chairs the Nominating Committee and sits on the Audit and Remuneration Committees. The board remains five strong with three independent directors.
Q2 2024
1 Apr 2024 – 28 Jun 2024E28 −0.8%STI +3.4%Peer median −2.2%Range S$1.32–S$1.66Close S$1.63
Key developments
2 May 2024 · S$1.42 · Ex-dividend: first and final FY2023 dividend of 2.28 cents per share.
Approved at the AGM of 25 April 2024 and paid on 15 May 2024. The chart's return series is adjusted for it, so the ex-date step is not counted as a move.
14 May 2024 · S$1.36 · 1Q24 business update: revenue up 12.2% to S$193.6m and PATMI up 73.0% to S$9.0m, the first year-on-year growth since the downturn.
Gross margin improved to 13.7% from 12.3% on operating leverage. Semiconductor revenue rose 37.4% to S$79.5m on strong sales to a key European customer and a modest increase in Asia; medical rose 8.6% and analytical & life sciences 16.7%; industrial automation fell 49.5% to S$9.4m. Net cash was S$62.2m.
Guidance: 1H24 revenue expected to be comparable to 2H23; semiconductor, medical and analytical & life sciences higher, industrial automation and automotive lower.Next session (15 May): E28 +2.9% · STI −0.7% · peers −1.3%
Large price moves
- 410 May 2024 · +6% · index +1% · peers 0%
- 513 May 2024 · −6% · index 0% · peers −4%
- 623 May 2024 · +7% · index +1% · peers +2%
Q3 2024
1 Jul 2024 – 30 Sep 2024E28 −16.0%STI +7.6%Peer median −2.9%Range S$1.15–S$1.66Close S$1.37
Key developments
14 Aug 2024 · S$1.39 · 1H2024 results: revenue up 6.2% to S$372.7m, gross margin up 2.5 points to 14.8%, PATMI up 50.3% to S$18.1m.
Semiconductor revenue rose 27.8% to S$156.8m on increased orders from a key European customer and a recovery in Asia; analytical & life sciences rose 12.7% and medical 5.1%. Industrial automation fell 60.0% to S$14.1m as a data-storage customer changed its product to higher-capacity drives, cutting unit volumes. Administrative expenses rose 15.3% on staff and IT costs. Operating cash flow was S$8.5m as inventories rose to S$235.1m to fulfil orders; net cash S$39.7m. The company flagged the risk of further US-China trade restrictions but said no customer programme had changed.
Guidance: 2H24 revenue expected to be higher than 1H24; semiconductor higher, industrial automation lower.Next session (15 Aug): E28 +0.0% · STI +0.9% · peers −0.5%
Large price moves
- 75 Aug 2024 · −8% · index −4% · peers −4%
- 87 Aug 2024 · +8% · index +2% · peers +2%
- 912 Aug 2024 · +7% · index −1% · peers 0%
- 10week to 16 Aug 2024 · +12% · index +3% · peers +1%
Q4 2024
1 Oct 2024 – 31 Dec 2024E28 −17.5%STI +5.6%Peer median +0.1%Range S$1.09–S$1.36Close S$1.13
Key developments
19 Nov 2024 · S$1.20 · 3Q24 business update: revenue up 7.7% to S$198.6m and PATMI up 29.3% to S$9.2m; nine-month PATMI up 42.5%.
Gross margin was 14.0% against 12.4% a year earlier. Semiconductor revenue rose 23.0% to S$91.7m on steady sales to a key European customer and continued recovery in Asia; industrial automation picked up 31.5% to S$8.9m; medical eased 4.3% on slower European orders. Automotive revenue fell 12.0% to S$15.5m. Net cash was S$40.8m.
Guidance: 2H24 revenue expected to be higher than 1H24; semiconductor higher, automotive lower. The company noted uneven recovery across semiconductor-equipment markets and possible trade restrictions.Next session (20 Nov): E28 +3.3% · STI −0.4% · peers −0.7%
Q1 2025
2 Jan 2025 – 28 Mar 2025E28 −6.2%STI +4.9%Peer median −5.4%Range S$1.03–S$1.19Close S$1.06
Key developments
27 Feb 2025 · S$1.05 · FY2024 results: revenue up 6.9% to S$794.3m and PATMI up 14.3% to S$37.1m; dividend raised to 2.61 cents.
Gross margin expanded to 14.5% from 13.2%. Semiconductor revenue rose 29.4% to S$365.5m; analytical & life sciences rose 6.7% and medical 2.4%; industrial automation halved (down 51.7% to S$29.0m) and automotive fell 10.7% to S$62.1m. The second half was weaker than the first on profit: 2H24 PATMI of S$19.0m was down 7.0% year on year despite revenue up 7.6%, with other income down on foreign-exchange losses and administrative costs up 14.6% for the year. Operating cash flow was S$48.0m against capex of S$13.9m; net cash S$72.6m. A second Gapwaves radar-antenna programme was announced, with serial production only from 2026, and a new US facility was to open in 1H25.
Guidance: 1H25 revenue expected to be higher than 2H24, led by a sequential improvement in European semiconductor sales and a pick-up in Asia front-end equipment demand.Next session (28 Feb): E28 −1.0% · STI −0.7% · peers −1.1%
Q2 2025
1 Apr 2025 – 30 Jun 2025E28 +20.1%STI −0.2%Peer median +11.0%Range S$0.85–S$1.26Close S$1.24
Key developments
2 May 2025 · S$1.01 · Ex-dividend: first and final FY2024 dividend of 2.61 cents per share.
Approved at the AGM of 25 April 2025 and paid on 15 May 2025.
20 May 2025 · S$1.14 · 1Q25 business update: revenue up 11.5% to S$215.8m and PATMI up 12.0% to S$10.0m; US tariff exposure quantified.
Gross margin rose to 14.8% from 13.7%. Semiconductor revenue rose 33.7% to S$106.2m, now 49% of group revenue, on a key European customer and a strong rebound in Asia that the company linked to a broadened product portfolio with front-end equipment customers. Industrial automation fell 18.7% and the IMS division fell 13.9%. On tariffs, shipments to the USA were about 9% of FY2024 revenue, roughly 6% of it shipped from Singapore, and import duties are borne by customers under the incoterms. Net cash was S$71.8m.
Guidance: Moderate revenue growth in 1H25 against 2H24; semiconductor and medical higher, automotive lower — subject to tariff fallout.Next session (21 May): E28 −0.9% · STI +0.0% · peers +0.0%3 Jun 2025 · S$1.14 · New Singapore factory: 33-year JTC lease at Kaki Bukit for a S$63m, 28,594 sqm facility consolidating Mechatronics Singapore.
Subsidiary ETLA accepted a JTC lease over 12,318 sqm from 18 August 2025, with a declared investment of at least S$19.5m (S$13.3m of it new plant and machinery) within three years. The five-storey building was to start construction in 3Q25 and complete by 1Q27, replacing the Changi North and Seletar sites, with larger cleanrooms for wafer-fabrication-equipment customers and capacity for programme transfers from European semiconductor and analytical & life sciences customers. Funding is from internal resources and borrowings.
Next session (4 Jun): E28 +0.0% · STI +0.2% · peers +0.7%
Large price moves
- 117 Apr 2025 · −11% · index −8% · peers −12%
- 1210 Apr 2025 · +12% · index +5% · peers +3%
- 13week to 25 Apr 2025 · +10% · index +3% · peers +6%
- 1413 May 2025 · +8% · index 0% · peers +3%
- 15week to 16 May 2025 · +12% · index +1% · peers +3%
Q3 2025
1 Jul 2025 – 30 Sep 2025E28 +13.7%STI +8.5%Peer median +7.6%Range S$1.24–S$1.70Close S$1.41
Key developments
12 Aug 2025 · S$1.58 · Groundbreaking for the Singapore facility: cleanroom assembly capacity projected to triple; ASML named as a key customer.
The new site is about 1.4 times the size of the current combined Singapore operations. Management said it is scaling cleanroom assembly for upcoming customer programmes, investing in submicron machining and advanced cleaning, and that its Europe and Asia teams are working on programme expansions for, among others, ASML, as that customer expands its South-East Asian supply chain for mainstream products. Completion was still targeted for 1Q27.
Next session (13 Aug): E28 +0.6% · STI +1.2% · peers +0.0%14 Aug 2025 · S$1.54 · 1H2025 results: revenue up 15.7% to S$431.4m and PATMI up 9.9% to S$19.9m, but gross margin slipped to 14.1%.
Semiconductor revenue rose 37.5% to S$215.7m, half of group revenue, on a key European customer and the Asia rebound. Analytical & life sciences fell 3.7% on weaker European demand, and the margin slip from 14.8% was attributed to higher European operating costs. Other income fell 30.6% on a foreign-exchange loss. Operating cash flow was S$21.9m against capex of S$7.5m; net cash S$70.8m.
Guidance: 2H25 revenue broadly stable against 1H25; semiconductor 'largely similar', analytical & life sciences lower, industrial automation higher — with the US chip-tariff position and possible reshoring named as the uncertainty.Next session (15 Aug): E28 −3.9% · STI −0.6% · peers −2.4%
Large price moves
- 1621 Jul 2025 · +8% · index 0% · peers +1%
- 17week to 25 Jul 2025 · +15% · index +2% · peers +4%
Q4 2025
1 Oct 2025 – 31 Dec 2025E28 −2.1%STI +8.0%Peer median −2.2%Range S$1.33–S$1.68Close S$1.38
Key developments
17 Nov 2025 · S$1.52 · 3Q25 business update: revenue up 6.5% to S$211.5m and PATMI up 7.5% to S$9.9m; first guidance for a softer half.
Gross margin was 14.8% on mix. Semiconductor revenue rose 8.1% to S$99.1m on Asia; industrial automation rose 51.1% to S$13.5m; analytical & life sciences fell 8.3% to S$41.0m on reduced US research funding and a key customer's trade difficulties in China. Nine-month revenue was up 12.5% to S$642.8m with PATMI up 9.1% to S$29.8m. Borrowings fell to S$50.3m and net cash reached S$99.0m. The company also said its European semiconductor business could be undermined by a customer recalibrating orders after two strong years.
Guidance: 2H25 revenue marginally lower than 1H25 — semiconductor marginally lower, analytical & life sciences lower — while FY2025 revenue still grows over FY2024.Same session: E28 −1.3% · STI −0.1% · peers −0.4%
Large price moves
- 1921 Oct 2025 · +6% · index +1% · peers +3%
Q1 2026
2 Jan 2026 – 31 Mar 2026E28 +47.8%STI +5.1%Peer median +39.8%Range S$1.40–S$2.16Close S$2.04
Key developments
27 Feb 2026 · S$2.16 · FY2025 results: record revenue of S$865.1m (up 8.9%) and PATMI of S$39.1m (up 5.4%); dividend 2.75 cents; net cash S$139.6m.
Gross margin eased to 14.3% from 14.5%. Semiconductor revenue rose 16.7% to S$426.6m, driven by Asia, but 2H25 semiconductor revenue was down 2.2% on the first half. Analytical & life sciences fell 8.1% to S$166.6m; industrial automation rose 48.6% to S$43.1m. Operating cash flow was S$103.5m as inventories fell to S$198.5m, borrowings fell to S$22.3m from S$86.6m, and the debt-to-equity ratio was about 4.7%. The IMS division was renamed Advanced Plastics Solutions (APS). The company guided that 1H26 revenue would be largely unchanged on 1H25 but with higher net profit, as Asia growth cushioned softness in Europe, where a key semiconductor customer's inventory-reduction cycle was expected to run until the latter half of 2026.
Guidance: 1H26 revenue largely unchanged against 1H25 with higher net profit; semiconductor, medical and automotive higher, analytical & life sciences and industrial automation lower.Next session (2 Mar): E28 −3.2% · STI −2.1% · peers +0.4%
Large price moves
- 2028 Jan 2026 · +7% · index 0% · peers +3%
- 219 Feb 2026 · +7% · index +1% · peers +3%
- 22week to 13 Feb 2026 · +12% · index 0% · peers +7%
- 2327 Feb 2026 · +6% · index +1% · peers +5%
- 24week to 27 Feb 2026 · +14% · index −1% · peers +11%
- 2523 Mar 2026 · −7% · index −2% · peers −3%
- 2625 Mar 2026 · +10% · index +1% · peers +6%
Q2 2026
1 Apr 2026 – 30 Jun 2026E28 +48.6%STI +5.8%Peer median +49.0%Range S$2.03–S$3.54Close S$3.00
Key developments
30 Apr 2026 · S$2.68 · Ex-dividend: first and final FY2025 dividend of 2.75 cents per share.
Approved at the AGM of 24 April 2026, where lead independent director Melvin Chan Wai Leong retired after nine years; paid on 14 May 2026.
8 May 2026 · S$2.93 · Board change: Dato' Noorashidah Binti Ahmad becomes lead independent director; Tay Peng Huat appointed independent director.
The appointments follow Melvin Chan's retirement at the AGM. Tay Peng Huat chairs the Nominating Committee and sits on the Audit Committee.
19 May 2026 · S$2.81 · 1Q26 business update: revenue down 6.4% to S$202.0m and PATMI down 20.2% to S$8.0m as European EUV-module orders moderated from their 2025 peak.
Semiconductor revenue fell 7.0% to S$98.8m: Mechatronics Asia grew strongly on front-end and back-end equipment customers, but Mechatronics Europe saw orders for an advanced EUV-system module moderate from the 2025 peak. Analytical & life sciences fell 21.2% to S$36.2m; medical rose 5.0%; APS rose 4.3% on automotive. PATMI included a S$1.1m foreign-exchange loss. Borrowings fell to S$26.6m and net cash was S$115.4m. The company said a key European semiconductor customer had reaffirmed a recovery in order flow from 2H26, reiterated higher FY2026 revenue and profit, and disclosed a multi-phase organisational alignment programme to support growth past S$1 billion of revenue.
Guidance: FY2026 revenue and profit higher than FY2025, with improving momentum through the year and a second-half pick-up in Europe.Same session: E28 −7.6% · STI +1.5% · peers −2.8%
Large price moves
- 27week to 10 Apr 2026 · +17% · index +1% · peers +10%
- 2812 May 2026 · +9% · index 0% · peers +2%
- 3020 May 2026 · +9% · index −1% · peers 0%
- 3115 Jun 2026 · +9% · index +1% · peers +5%
- 3222 Jun 2026 · +13% · index 0% · peers +4%
- 3323 Jun 2026 · −13% · index 0% · peers −10%
Q3 2026
1 Jul 2026 – 21 Aug 2026 (part quarter)E28 −14.0%STI +10.0%Peer median −2.1%Range S$2.34–S$3.04Close S$2.58
Key developments
13 Aug 2026 · S$2.79 · 1H2026 results: revenue down 0.8% to S$427.8m and PATMI down 3.4% to S$19.3m, with a strong second quarter and a S$1 billion revenue ambition by 2028.
Gross margin widened to 15.0% from 14.1%. The second quarter was the better half: 2Q26 revenue of S$225.8m was up 4.7% year on year and 11.7% on the quarter, and 2Q26 PATMI of S$11.3m was up 13.7% year on year. Semiconductor revenue was down 1.1% for the half at S$213.3m, medical up 10.1%, analytical & life sciences down 13.7%, automotive up 10.0%. Working capital absorbed cash: inventories rose to S$236.4m from S$198.5m and receivables to S$161.6m, operating cash flow was an outflow of S$4.8m, borrowings rose to S$54.2m from S$22.3m, and net cash fell to S$68.8m from S$139.6m. Administrative expenses rose 9.9% on transformation and consultancy costs. The Singapore facility is now described as operationally ready by 2H27, against the 1Q27 completion stated in February.
Guidance: 2H26 revenue higher than both 2H25 and 1H26; FY2026 revenue and profit higher than FY2025; revenue could cross S$1 billion by 2028 'if not earlier' through organic growth and acquisitions.Next session (14 Aug): E28 −5.7% · STI +0.4% · peers −1.6%27 Aug 2026 · Proposed placement: 44.08m new shares at S$2.2687 to raise S$100.0m gross and about S$97.1m net.
The placement is best-efforts and not underwritten. The price is 9.997% below the 25 August VWAP. Placement shares are 10.27% of the issued base and 9.31% of the expected enlarged 473.56m shares after a separate 150,000 option allotment. Ninety per cent of net proceeds is for expansion, strategic investments, M&A, joint ventures and alliances; ten per cent is for working capital and/or bank-debt repayment. As stated on 27 August, completion was then expected on 3 September 2026 subject to conditions. The company accepted a six-month issuance moratorium with stated carve-outs.
Guidance: Periodic use-of-proceeds announcements will follow; no acquisition target, return hurdle or leverage guardrail was disclosed.
Large price moves
- 3428 Jul 2026 · −9% · index 0% · peers −5%
Notes and sources
Share price record
How this section was built
How to read the tags. Market-wide and Sector-wide mean the index or the peer median moved with the share over the same session or week; Residual means the move is still large after both are subtracted. A residual is what is left over, not a cause: it does not establish that the company’s own news moved the price, and an unchanged or thinly traded price is not proof that no information arrived. Returns use the dividend-adjusted close; a filing released after the open is read against the next session.
Prices as traded, while the return and volatility tests run on the dividend-adjusted series, so an ex-dividend date is never counted as a move. Price data to the 21 August 2026 close (755 sessions) from a market-data vendor; the 22 June 2026 all-time high is independently corroborated. Filing times are SGXNet release times; a filing after 09:00 is read against the next session.
A quarter shows only the columns it has. An empty developments column means: No filings beyond routine disclosures (share-option allotments, interest notices, meeting notices) this quarter. An empty moves column means: No session cleared the large-move threshold this quarter.
The full move register — every large move and its market and sector controls
| # | Session | E28 | STI | Peers | Left over | Control result | What the evidence supports |
|---|---|---|---|---|---|---|---|
| 1 | 14 Sep 2023 | +7.7% | +0.9% | +0.3% | +7.4% | Residual | Against an index move of +0.9% and a peer median of +0.3%, about 7 points are left over; 3.3× median volume. No filing beyond routine notices in the prior three sessions. UMS +1.6 · AEM +0.6 · MicroMech −1.0 · FuYu +0.0 |
| 2 | 11 Oct 2023 | +7.4% | −0.2% | +0.5% | +7.0% | Residual | Against an index move of −0.2% and a peer median of +0.5%, about 7 points are left over; 2.5× median volume. No filing beyond routine notices in the prior three sessions. UMS +0.9 · AEM +1.5 · MicroMech +0.0 · FuYu −0.8 |
| 3 | 23 Nov 2023 | +7.4% | −0.1% | −0.1% | +7.6% | Residual | Against an index move of −0.1% and a peer median of −0.1%, about 8 points are left over; 2.5× median volume. Followed the 3Q23 business update, filed 22 Nov 2023, 17:40. UMS +0.8 · AEM −1.4 · MicroMech −1.1 · FuYu +0.8 |
| 4 | 10 May 2024 | +6.0% | +0.8% | +0.4% | +5.6% | Residual | Against an index move of +0.8% and a peer median of +0.4%, about 6 points are left over; 1.7× median volume. No filing beyond routine notices in the prior three sessions. UMS +1.5 · AEM −2.5 · MicroMech −0.7 · FuYu +4.8 |
| 5 | 13 May 2024 | −6.4% | +0.4% | −3.8% | −2.6% | Sector-wide | Against an index move of +0.4% and a peer median of −3.8%, about 3 points are left over; 3.2× median volume. UMS −15.9 · AEM −7.6 · MicroMech +1.4 · FuYu +0.0 |
| 6 | 23 May 2024 | +6.5% | +0.5% | +2.2% | +4.3% | Residual | Against an index move of +0.5% and a peer median of +2.2%, about 4 points are left over; 2.1× median volume. No filing beyond routine notices in the prior three sessions. UMS +3.6 · AEM +5.4 · MicroMech +0.7 · FuYu +0.8 |
| 7 | 5 Aug 2024 | −8.0% | −4.1% | −4.0% | −4.0% | Market-wide | The global yen-carry unwind. Both controls fell hard and AEM fell further than Frencken did; about four points of the eight are left over. No issuer announcement sits against the session. UMS −2.8 · AEM −9.0 · MicroMech −5.3 · FuYu −2.4 |
| 8 | 7 Aug 2024 | +7.6% | +1.6% | +1.8% | +5.8% | Residual | Against an index move of +1.6% and a peer median of +1.8%, about 6 points are left over; 2.9× median volume. No filing beyond routine notices in the prior three sessions. UMS +2.0 · AEM +7.2 · MicroMech −2.0 · FuYu +1.7 |
| 9 | 12 Aug 2024 | +7.2% | −0.8% | −0.3% | +7.5% | Residual | Against an index move of −0.8% and a peer median of −0.3%, about 8 points are left over; 2.9× median volume. No filing beyond routine notices in the prior three sessions. UMS +2.9 · AEM −2.1 · MicroMech −0.7 · FuYu +0.0 |
| 10 | week to 16 Aug 2024 | +12.0% | +2.8% | +1.3% | +10.7% | Residual | Weekly window, 8 Aug to 16 Aug: against an index move of +2.8% and a peer median of +1.3%, about 11 points are left over. The week included the half-year results (14 Aug 2024, 17:24). UMS +1.0 · AEM −15.9 · MicroMech +2.7 · FuYu +1.7 |
| 11 | 7 Apr 2025 | −11.2% | −7.5% | −12.1% | +0.9% | Market-wide | The tariff sell-off. Frencken fell 11.2%, but the peer median fell 12.1% — on the day it held up marginally better than its sector, and the residual is positive. The 36-month low of S$0.85 followed two sessions later. UMS −9.7 · AEM −17.7 · MicroMech −8.7 · FuYu −14.6 |
| 12 | 10 Apr 2025 | +12.3% | +5.4% | +2.9% | +9.5% | Residual | Against an index move of +5.4% and a peer median of +2.9%, about 9 points are left over; 2.4× median volume. No filing beyond routine notices in the prior three sessions. UMS +5.9 · AEM +0.9 · MicroMech +3.5 · FuYu +2.3 |
| 13 | week to 25 Apr 2025 | +9.9% | +2.8% | +5.6% | +4.3% | Residual | Weekly window, 17 Apr to 25 Apr: against an index move of +2.8% and a peer median of +5.6%, about 4 points are left over. No filing beyond routine notices inside the window. UMS +6.9 · AEM +11.9 · MicroMech +4.1 · FuYu +4.3 |
| 14 | 13 May 2025 | +7.7% | +0.1% | +2.8% | +4.9% | Residual | Against an index move of +0.1% and a peer median of +2.8%, about 5 points are left over; 2.5× median volume. No filing beyond routine notices in the prior three sessions. UMS +6.7 · AEM +4.3 · MicroMech +1.2 · FuYu +0.0 |
| 15 | week to 16 May 2025 | +11.5% | +0.6% | +3.0% | +8.6% | Residual | Weekly window, 9 May to 16 May: against an index move of +0.6% and a peer median of +3.0%, about 9 points are left over. No filing beyond routine notices inside the window. UMS +10.5 · AEM +6.9 · MicroMech −2.5 · FuYu −1.0 |
| 16 | 21 Jul 2025 | +7.6% | +0.4% | +1.3% | +6.3% | Residual | Against an index move of +0.4% and a peer median of +1.3%, about 6 points are left over; 3.9× median volume. No filing beyond routine notices in the prior three sessions. UMS +0.7 · AEM +1.9 · MicroMech +3.4 · FuYu +0.0 |
| 17 | week to 25 Jul 2025 | +15.2% | +1.7% | +3.8% | +11.4% | Residual | Weekly window, 18 Jul to 25 Jul: against an index move of +1.7% and a peer median of +3.8%, about 11 points are left over. No filing beyond routine notices inside the window. UMS +4.8 · AEM +11.7 · MicroMech +2.8 · FuYu +0.9 |
| 18 | 12 Aug 2025 | −0.6% | −0.3% | 0.0% | −0.6% | No reaction | Groundbreaking announced for the new Singapore facility — S$63m and a projected tripling of cleanroom capacity. The share price did not move on it, that session or that week. UMS −2.0 · AEM 0.0 · MicroMech 0.0 · FuYu +2.0 · not threshold-detected |
| 19 | 21 Oct 2025 | +6.4% | +1.2% | +2.5% | +3.9% | Sector-wide | Against an index move of +1.2% and a peer median of +2.5%, about 4 points are left over; 2.4× median volume. UMS +3.8 · AEM +4.1 · MicroMech +1.2 · FuYu +0.0 |
| 20 | 28 Jan 2026 | +7.0% | −0.3% | +3.0% | +4.0% | Residual | Against an index move of −0.3% and a peer median of +3.0%, about 4 points are left over; 5.2× median volume. No filing beyond routine notices in the prior three sessions. UMS +3.8 · AEM +5.9 · MicroMech −1.8 · FuYu +2.1 |
| 21 | 9 Feb 2026 | +6.6% | +0.5% | +2.8% | +3.8% | Sector-wide | Against an index move of +0.5% and a peer median of +2.8%, about 4 points are left over; 3.9× median volume. UMS +5.6 · AEM +5.0 · MicroMech +0.6 · FuYu +0.0 |
| 22 | week to 13 Feb 2026 | +12.0% | +0.1% | +6.7% | +5.3% | Residual | Weekly window, 6 Feb to 13 Feb: against an index move of +0.1% and a peer median of +6.7%, about 5 points are left over. No filing beyond routine notices inside the window. UMS +7.2 · AEM +11.0 · MicroMech +6.2 · FuYu +2.0 |
| 23 | 27 Feb 2026 | +6.4% | +0.6% | +4.6% | +1.8% | Sector-wide | Against an index move of +0.6% and a peer median of +4.6%, about 2 points are left over; 3.2× median volume. UMS +5.1 · AEM +17.4 · MicroMech +4.2 · FuYu +1.0 |
| 24 | week to 27 Feb 2026 | +14.3% | −0.5% | +10.6% | +3.7% | Sector-wide | Weekly window, 20 Feb to 27 Feb: against an index move of −0.5% and a peer median of +10.6%, about 4 points are left over. UMS +7.4 · AEM +43.6 · MicroMech +13.8 · FuYu +2.0 |
| 25 | 23 Mar 2026 | −7.2% | −2.2% | −3.4% | −3.8% | Sector-wide | Against an index move of −2.2% and a peer median of −3.4%, about 4 points are left over; 3.2× median volume. UMS −2.5 · AEM −3.4 · MicroMech −4.1 · FuYu −3.4 |
| 26 | 25 Mar 2026 | +10.3% | +0.9% | +6.0% | +4.3% | Residual | Against an index move of +0.9% and a peer median of +6.0%, about 4 points are left over; 5.5× median volume. No filing beyond routine notices in the prior three sessions. UMS +6.6 · AEM +5.4 · MicroMech +7.9 · FuYu −2.3 |
| 27 | week to 10 Apr 2026 | +17.2% | +0.8% | +9.8% | +7.5% | Residual | Weekly window, 2 Apr to 10 Apr: against an index move of +0.8% and a peer median of +9.8%, about 7 points are left over. No filing beyond routine notices inside the window. UMS +9.7 · AEM +15.9 · MicroMech +9.9 · FuYu −2.3 |
| 28 | 12 May 2026 | +8.6% | +0.1% | +2.3% | +6.3% | Residual | Against an index move of +0.1% and a peer median of +2.3%, about 6 points are left over; 3.0× median volume. No filing beyond routine notices in the prior three sessions. UMS +10.2 · AEM −0.8 · MicroMech +5.3 · FuYu −0.8 |
| 29 | 19 May 2026 | −7.6% | +1.5% | −2.8% | −4.8% | Residual | 1Q26 business update, released at 06:07 before the open, so this session's fall followed it. The index rose 1.5% and peers fell under 3%, leaving roughly five points unexplained by either control. The shares had already fallen 10.9% over the two prior sessions, and rebounded 8.5% the next day. UMS −3.3 · AEM −2.2 · MicroMech −7.9 · FuYu −1.8 · not threshold-detected |
| 30 | 20 May 2026 | +8.5% | −0.5% | −0.3% | +8.8% | Residual | Against an index move of −0.5% and a peer median of −0.3%, about 9 points are left over; 3.1× median volume. The session after the reaction to the 1Q26 business update (filed 19 May 2026, 06:07); no new filing. UMS +0.4 · AEM +4.1 · MicroMech −1.5 · FuYu −0.9 |
| 31 | 15 Jun 2026 | +9.2% | +1.0% | +4.7% | +4.5% | Residual | Against an index move of +1.0% and a peer median of +4.7%, about 4 points are left over; 1.9× median volume. No filing beyond routine notices in the prior three sessions. UMS +10.3 · AEM +2.7 · MicroMech +4.4 · FuYu +5.1 |
| 32 | 22 Jun 2026 | +13.1% | +0.2% | +3.9% | +9.2% | Residual | The largest single-session gain in the window, on 3.7× median volume, to an all-time high of S$3.54. The index was flat and no peer rose more than 5.7%, so about nine points survive both controls. Four explanations have been tested and all four fail. The FTSE Straits Times Index quarterly review took effect at the start of business that same session but records no Frencken change in the index or its reserve list. The FTSE Global Equity Index Series review rebalances as-of-close on 19 June, and 19 June traded 1.2× median volume against 3.7× on the 22nd, so the flow is not a mechanical index trade. No ASML announcement falls in that week. And a bounded scan of the SGX filing space across 15–23 June 2026 — 641 contiguous file IDs, no gaps, covering every trading day — returns no Frencken announcement at all. On the evidence available, the largest company-specific move in three years has nothing filed against it. UMS +4.8 · AEM +1.9 · MicroMech +5.7 · FuYu +3.0 |
| 33 | 23 Jun 2026 | −12.7% | 0.0% | −9.5% | −3.2% | Sector-wide | The following session reversed the gain, but the three semiconductor-equipment peers each fell 9–10% the same day while Fu Yu, the non-semicap name, fell 2.9%. On the controls this is a sector move that coincided with the reversal, not a continuation of the prior session. UMS −10.1 · AEM −9.2 · MicroMech −9.9 · FuYu −2.9 |
| 34 | 28 Jul 2026 | −8.9% | −0.1% | −4.8% | −4.1% | Sector-wide | A 2.7×-volume decline out of a quiet tape. The index was flat but UMS and AEM both fell 8.5%; roughly four points are left over. UMS −8.5 · AEM −8.5 · MicroMech 0.0 · FuYu −1.1 |
| 35 | 14 Aug 2026 | −5.7% | +0.4% | −1.6% | −4.1% | Residual | The session after the 1H2026 results, which were filed at 17:19 on 13 August — after that day's +4.1% close, so the rise preceded the filing and this fall followed it. The index was up and the peer median fell 1.6%, leaving about four points to the results: revenue down 0.8%, PATMI down 3.4%, an operating cash outflow and net cash down to S$68.8m, against a stronger second quarter and restated full-year guidance. 1.8× median volume; not threshold-detected. UMS +0.7 · AEM −4.7 · MicroMech −1.1 · FuYu −2.0 · not threshold-detected |
Key developments: sources, timing and notes
- 14 Aug 2023 · 1H2023 results: revenue down 9.7% to S$351.0m and PATMI down 53.8% to S$12.1m as the semiconductor downcycle bit. Results Filed before the price window opens on 22 Aug 2023; no reaction session is computed. Source: SGX announcement, 14 Aug 2023
- 22 Nov 2023 · 3Q23 business update: revenue down 5.6% year on year to S$184.4m, but the third straight quarter of sequential improvement. Business update Reaction (next session, 23 Nov): E28 +7.4% · STI −0.1% · peers −0.2% · 3.3× median volume Source: SGX announcement, 22 Nov 2023
- 27 Feb 2024 · FY2023 results: revenue down 5.5% to S$742.9m and PATMI down 37.4% to S$32.5m; dividend cut to 2.28 cents from 3.64. Results Reaction (next session, 28 Feb): E28 −0.7% · STI −0.6% · peers +0.0% · 2.6× median volume Source: SGX announcement, 27 Feb 2024
- 1 Mar 2024 · Board change: Dato' Noorashidah Binti Ahmad appointed independent director; Chia Chor Leong resigns. Board Source: SGX announcement, 1 Mar 2024
- 2 May 2024 · Ex-dividend: first and final FY2023 dividend of 2.28 cents per share. Dividend Source: Results of AGM, 25 Apr 2024
- 14 May 2024 · 1Q24 business update: revenue up 12.2% to S$193.6m and PATMI up 73.0% to S$9.0m, the first year-on-year growth since the downturn. Business update Reaction (next session, 15 May): E28 +2.9% · STI −0.7% · peers −1.3% · 3.7× median volume Source: SGX announcement, 14 May 2024
- 14 Aug 2024 · 1H2024 results: revenue up 6.2% to S$372.7m, gross margin up 2.5 points to 14.8%, PATMI up 50.3% to S$18.1m. Results Reaction (next session, 15 Aug): E28 +0.0% · STI +0.9% · peers −0.5% · 1.9× median volume Source: SGX announcement, 14 Aug 2024
- 19 Nov 2024 · 3Q24 business update: revenue up 7.7% to S$198.6m and PATMI up 29.3% to S$9.2m; nine-month PATMI up 42.5%. Business update Reaction (next session, 20 Nov): E28 +3.3% · STI −0.4% · peers −0.7% · 2.8× median volume Source: SGX announcement, 19 Nov 2024
- 27 Feb 2025 · FY2024 results: revenue up 6.9% to S$794.3m and PATMI up 14.3% to S$37.1m; dividend raised to 2.61 cents. Results Reaction (next session, 28 Feb): E28 −1.0% · STI −0.7% · peers −1.1% · 2.6× median volume Source: SGX announcement, 27 Feb 2025
- 2 May 2025 · Ex-dividend: first and final FY2024 dividend of 2.61 cents per share. Dividend Source: Results of AGM, 25 Apr 2025
- 20 May 2025 · 1Q25 business update: revenue up 11.5% to S$215.8m and PATMI up 12.0% to S$10.0m; US tariff exposure quantified. Business update Reaction (next session, 21 May): E28 −0.9% · STI +0.0% · peers +0.0% · 0.8× median volume Source: SGX announcement, 20 May 2025
- 3 Jun 2025 · New Singapore factory: 33-year JTC lease at Kaki Bukit for a S$63m, 28,594 sqm facility consolidating Mechatronics Singapore. Capacity Reaction (next session, 4 Jun): E28 +0.0% · STI +0.2% · peers +0.7% · 1.9× median volume Source: SGX announcement, 3 Jun 2025
- 12 Aug 2025 · Groundbreaking for the Singapore facility: cleanroom assembly capacity projected to triple; ASML named as a key customer. Capacity Reaction (next session, 13 Aug): E28 +0.6% · STI +1.2% · peers +0.0% · 1.3× median volume Source: News release, 12 Aug 2025
- 14 Aug 2025 · 1H2025 results: revenue up 15.7% to S$431.4m and PATMI up 9.9% to S$19.9m, but gross margin slipped to 14.1%. Results Reaction (next session, 15 Aug): E28 −3.9% · STI −0.6% · peers −2.4% · 2.8× median volume Source: SGX announcement, 14 Aug 2025
- 17 Nov 2025 · 3Q25 business update: revenue up 6.5% to S$211.5m and PATMI up 7.5% to S$9.9m; first guidance for a softer half. Business update Reaction (same session): E28 −1.3% · STI −0.1% · peers −0.4% · 0.9× median volume Source: SGX announcement, 17 Nov 2025
- 27 Feb 2026 · FY2025 results: record revenue of S$865.1m (up 8.9%) and PATMI of S$39.1m (up 5.4%); dividend 2.75 cents; net cash S$139.6m. Results Reaction (next session, 2 Mar): E28 −3.2% · STI −2.1% · peers +0.4% · 3.5× median volume Source: SGX announcement, 27 Feb 2026
- 30 Apr 2026 · Ex-dividend: first and final FY2025 dividend of 2.75 cents per share. Dividend Source: Results of AGM, 24 Apr 2026
- 8 May 2026 · Board change: Dato' Noorashidah Binti Ahmad becomes lead independent director; Tay Peng Huat appointed independent director. Board Source: SGX announcement, 8 May 2026
- 19 May 2026 · 1Q26 business update: revenue down 6.4% to S$202.0m and PATMI down 20.2% to S$8.0m as European EUV-module orders moderated from their 2025 peak. Business update Reaction (same session): E28 −7.6% · STI +1.5% · peers −2.8% · 1.7× median volume Source: SGX announcement, 19 May 2026 (released 06:07, before the open)
- 13 Aug 2026 · 1H2026 results: revenue down 0.8% to S$427.8m and PATMI down 3.4% to S$19.3m, with a strong second quarter and a S$1 billion revenue ambition by 2028. Results Reaction (next session, 14 Aug): E28 −5.7% · STI +0.4% · peers −1.6% · 1.8× median volume Source: SGX announcement, 13 Aug 2026 (released 17:19, after the close)
- 27 Aug 2026 · Proposed placement: 44.08m new shares at S$2.2687 to raise S$100.0m gross and about S$97.1m net. capital Source: Placement announcement, 27 Aug 2026 (released 20:41, after the close)
How the share price section was built
This section records the 36-month price history and puts every large move through two subtractions before any of it is treated as company-specific: first the Straits Times Index, then the median of four SGX-listed operating comparisons — UMS Integration, AEM Holdings, Micro-Mechanics and Fu Yu. All four trade the same session as Frencken, so no timing adjustment is needed. “Left over” is what survives both controls, and it is the only column that can describe something specific to this company.
The detector flagged 32 large moves in the window — 25 single sessions and seven weekly windows — and three further announcement sessions are carried for context. Two of the 32 are market moves and eight are sector moves. Of the 22 that survive both controls, one followed a filing by timestamp (the 3Q23 update) and one weekly window contained the 1H2024 results; the other 20 have nothing filed against them beyond routine notices, and are recorded as unexplained rather than explained away. Of the three context sessions, two followed a filing and one produced no reaction.
Each quarter below pairs two records. Key developments are the filings that carry information — results, business updates, capacity decisions, board and dividend events — with the figures as filed, the guidance given, the close on the day and how the reacting session traded against the index and the peer median. They were selected from the full tape of 960 SGXNet announcements through 27 August 2026. The placement is covered in the event section above because its reacting session was not yet available; routine filings (share-option allotments, interest notices, meeting notices) are left out. Large price moves are the threshold-detected sessions, each put through both controls. Where the two records meet — a filing and a move in the same quarter — the release time says which came first.
Limitations bound every row above. Frencken’s announcement tape for the window has been enumerated from the company’s SGXNet listing — 959 announcements since listing, by title and release time — and the twenty filings in the timeline were selected from it; the rest are share-option allotments, interest notices and meeting paperwork. Two moves follow a filing by timestamp (the 1Q26 update, released 06:07 on 19 May; the 1H2026 results, released 17:19 on 13 August, after that day’s 4.1% rise, so the reaction session is the 5.7% fall on the 14th). Holding the release time is what makes that sequence a finding rather than a guess. For 22 June the filing space was also scanned directly and returned nothing; that scan was validated by a control run which located Frencken’s own 1H2026 results announcement by the same test. It detects filings by filename, so a generically named one could be missed, and both the tape and the scan cover SGXNet only — broker notes, block trades and trade press remain unexamined. The peer median is also only four names, whose three-year returns range from −31% to +245%.
Questions for management
Each question below starts from what the public filings already disclose. Missing information is treated as an open question, not as evidence of a negative answer.
Is the lower top-three customer share durable? Known: the share fell to 41.4% in 1H2026 from 48.0% in 1H2025, while revenue outside the top three grew 11.9%. Still open: whether this is structural diversification or programme timing, confirmed on a full-year basis.
What non-confidential utilisation and return milestones support the Singapore facility? Known: the project is linked to upcoming programmes, Europe-to-Asia transfers and planned tripling of cleanroom capacity. Still open: aggregate nominated capacity, ramp timing, break-even utilisation and target return. Asked in full: “What non-confidential utilisation, transfer, renewal and return milestones support the planned tripling of Singapore cleanroom capacity?”
What facility cash remains after paid and prepaid amounts? Known: about S$63m total cost, S$60.1m FY2025 commitments, S$4.1m 1H2026 progress payments and a S$27.3m increase in receivables and prepayments. Still open: a facility-only paid, prepaid, committed and remaining cash bridge by period. Asked in full: “Can management reconcile the S$63m facility cost, S$60.1m commitments, construction payments, prepayments and remaining spend by period, including ordinary capex?”
How much liquidity is actually available across the group? Known: S$37.4m of S$123.0m group cash was at the listed parent, and the annual report says committed credit lines are maintained. Still open: subsidiary cash access, local operating needs, committed limits, undrawn availability, expiry and covenant headroom. Asked in full: “How much committed undrawn liquidity is available, what are the covenant definitions/headroom, and what portion of current/on-demand borrowings is expected to roll? Of the S$122.971m group cash at 30 June 2026, how much was available for group debt service after local operating needs and upstreaming constraints?”
What is the complete supplier-finance and working-capital bridge? Known: 1H2026 supplier-finance repayments were S$28.9m and working capital absorbed S$41.8m. Still open: supplier-finance draws and closing balance, normal operating range, and timing of inventory, receivable and prepayment conversion. Asked in full: “What were gross supplier-finance draws and the outstanding supplier-finance balance at 30 June 2026, and how much of the 2H working-capital release is expected to reverse?”
How much of the margin recovery is mix versus utilisation? Known: gross margin improved in 1H2026 and management points to higher-value work and deeper integration over time. Still open: the quantified price, volume, mix, utilisation, productivity and currency bridge. Asked in full: “What portion of the FY2021-to-FY2025 gross-margin decline is customer/product mix, pricing, underutilisation, start-up cost and other factors?”
Can APS sustain its return to profit? Known: APS earned S$1.4m in 1H2026 after a small loss a year earlier, with radar-antenna production expected to ramp. Still open: through-cycle margin, capital employed and return milestones. Asked in full: “What capital employed and return profile does APS have, and what milestones determine whether further investment or portfolio action is justified?”
What through-cycle ROE or incremental ROIC does management target for the group and the new Singapore facility? Known: ROE was 16.5% in FY2021 and 8.6% in FY2025, and the S$1bn revenue objective is published without any corresponding margin or return-on-capital target. Still open: the through-cycle return management is managing towards, for the group and for the new facility separately.
What return and liquidity guardrails apply to the placement proceeds? Known: about S$97.1m of estimated net proceeds, with 90% available for expansion, strategic investments, acquisitions, joint ventures and alliances. Still open: named targets, deployment timing, the return hurdle, integration limits, leverage guardrails, minimum liquidity and the maximum transaction size.
What you can watch yourself
Every other test on this page waits for the company to file. These do not. Each row is a series you can look up yourself, free, today — with the level this reading was built against, the levels that would put it in question, and what the series cannot tell you.
SEMI Worldwide Semiconductor Equipment Market Statistics, quarterly billings, USD billion
SEMI's equipment-article archive; open the latest quarterly billings release and read total worldwide billings. SEMI
- Last recorded
- 36.55 US$bn per quarter, 2026-03-31
- What the reading assumes
- 33.78 US$bn per quarter (quarterly average of 2025 full-year billings of US$135.1bn, 2025)
- Watch / alert
- 33.78 and 29.28 US$bn per quarter, on a move below — currently at or better than the level the reading assumed
- How often to look
- quarterly, when SEMI publishes (the series prints quarterly)
What it points to. The segment builds modules and frames for equipment makers, so industry billings point to the direction of its order intake.
Direction only — this pack does not carry a coefficient from this series to reported earnings.
What it cannot tell you. This is an industry aggregate and Frencken serves a handful of named equipment makers, so its half can diverge from the industry for a full cycle on customer mix alone. The company does not disclose which customers or which tools, so no coefficient exists and none is offered here — the direction is the whole of the signal. It also says nothing about the margin on that volume, which is where the company's own recent history actually turned.
Settled by the next half-year results and segment note, due 2027-02-28. Lead time: one to three quarters from equipment billings to the supplier's revenue.
analytical, life sciences and industrial automation — nothing public to watch
Searched the instrument makers' own quarterly releases, the national statistics on scientific-instrument output and the automotive production series for a proxy at this segment's perimeter. The segment spans four unrelated end markets in one reported line and the company discloses no split, so no single public series maps to it; adopting automotive production alone would misdescribe roughly half of it.
Download
A print-ready PDF of this page, for reading away from the screen: Frencken Group evidence library (PDF). It carries the same content as this page — the financial record, the segment mix, 1H2026, the 27 August placement, cash conversion, board and pay, the share price and questions for management — and the same omissions: no rating, no fair value, no forecast.
Sources and method
Where the primary sources are filed. SGX issuer page for E28 — announcements, financial statements, annual reports · Frencken Group investor relations. Exchange portals re-file and purge documents over time; the text above cites each document by name and date so it can be found again. Tables on this page as data: JSON · CSV — the page’s own as-filed and recomputed tables, cell for cell, with their section and caption.
This page uses Frencken's annual reports FY2016-FY2025, the 1H2026 results announcement released on 13 August 2026, the 27 August 2026 proposed-placement announcement, the 3 September 2026 placement-completion news release, the 12 August 2025 Singapore-facility announcement and the 2026 AGM minutes. Older annual reports and transaction documents were also reviewed for segment-definition and perimeter breaks. Reported values are retained as filed; derived values show the formula in the accompanying workbook. The public page deliberately excludes forecasts, scenarios, rating, fair value and any conclusion about the share price.
The two operating illustrations on this page are original SMID Research drawings, not reproductions. No photograph, screenshot or artwork from Frencken’s website, annual report or presentations is republished here: that material is the issuer’s copyright and has not been licensed for reuse. Where a picture was useful, it was drawn from the issuer’s written descriptions and captioned to say what it does and does not establish.
- Frencken proposed placement announcement, 27 August 2026
- Frencken placement-completion news release, 3 September 2026
- Frencken 1H2026 results announcement
- Frencken: Mechatronics capabilities and markets
- Frencken: Advanced Plastics Solutions capabilities and markets — the former
/ims/page no longer resolves after the segment was renamed, though the issuer’s own rename is incomplete:/global-offices/still lists the plants as “Frencken IMS” and heads that section “Integrated Manufacturing Services (IMS)”. - Frencken: semiconductor capabilities, cleanroom classes and system content
- Frencken: global offices and production locations
Correction, 16 September 2026. In “Where the cash went”, the capital-commitments row read “n/a” for FY2021, FY2022 and FY2023. Each annual report discloses the figure in its capital-commitments note — commitments in respect of contracts placed for the purchase of property, plant and equipment but not provided for — at S$4.412m (FY2021, note 34), S$3.847m (FY2022, note 34, repeated as the FY2023 comparative) and S$0.999m (FY2023). The three cells now carry those figures, rounded to the table’s one decimal. The FY2024 and FY2025 cells are unchanged.
Reader questions & corrections
Ask about this company, challenge a source or suggest a factual correction. Only selected questions that SMID Research has reviewed and answered are published.
Discuss public information and ideas with readers. Posts are independent reader discussion, not SMID Research coverage.
No reader questions have been published yet.
Submit a private question or correction
Submissions are private by default. Your email is encrypted and never published. Please do not send confidential or inside information, allegations about individuals, promotions, or requests for personalised investment advice.
Behind the lockA complete private working pack exists beyond this page: historical initiation materials, a 27 August placement event update, credit work, understanding sheet, process note and review artifacts. The financial spread and model predate the placement and are pending next build. The pack is maintained for the author's own records—not published and not available for sharing. This page carries everything that is public.
9 September 2026 corrections
These bounded retrospective corrections clarify specific published facts or calculations. They retain each report's existing research cutoff and do not represent a full refresh or a finding that all possible issues are resolved.
Frencken Group
- Verified Fact. The February 2026 robot initiative names SENTImotion and Envalior under the SMF Drives brand. Source basis: FY2025 annual report, page 22. Limitation: Revenue, customer wins and timing remain undisclosed.
Transcripts
Find available event transcripts in the transcript library.
Private vault
Forecasts, ratings and full initiation research are in the private research library.
News and announcements
- · Frencken Raises S$100 Million in Private Placement to Drive Next Phase of Growth · SGX
- · Not for Release, Publication or Distribution, Directly or Indirectly, in Whole or in Part, in or Into the United States, European Economic Area, the United Kingdom, Canada, Japan or Australia · SGX
- · Not for Release, Publication or Distribution, Directly or Indirectly, in Whole or in Part, in or Into the United States, European Economic Area, the United Kingdom, Canada, Japan or Australia · SGX
- · Not for Release, Publication or Distribution, Directly or Indirectly, in Whole or in Part, in or Into the United States, European Economic Area, the United Kingdom, Canada, Japan or Australia · SGX
Earlier announcements, before 27 August 2026 (13)
- · Condensed Interim Financial Statements For the six months ended 30 June 2026 · SGX
- · Frencken - 1Q26 Business Update · SGX
- · Frencken - Changes in Board Composition · SGX
- · Announcement of Appointment: Appointment of Independent Non-Executive Director · SGX
- · Condensed Interim Financial Statements For the six months and full year ended 31 December 2025 · SGX
- · Frencken - 3Q25 Business Update · SGX
- · Condensed Interim Financial Statements For the six months ended 30 June 2025 · SGX
- · Frencken - 1Q25 Business Update · SGX
- · Condensed Interim Financial Statements For the six months and full year ended 31 December 2024 · SGX
- · Frencken - 3Q24 Business Update - Final · SGX
- · Frencken - 1Q24 Business Update · SGX
- · Condensed Interim Financial Statements For the six months and full year ended 31 December 2023 · SGX
- · Frencken - 3Q23 Business Update · SGX
Titles are from the linked SGX filing, with common words abbreviated. Summaries are written by AI and may contain inaccuracies; refer to the original announcement. Items after 27 August 2026 are not reflected in this page's analysis; earlier items are listed for reference, may not be discussed in it, and may have been updated by later announcements.