Listed in Singapore · Flexible workspace and coliving
SGX: JCO · Information cut-off 29 August 2026
Investor snapshot
Business model
JustCo fits out and operates flexible offices, earning recurring membership and service fees under traditional leases and management contracts.
Latest figures
In 1H2026 revenue rose 24% to US$80.780m, cash EBITDA reached US$10.554m and operating cash flow was US$45.010m; at 30 June it held US$145.216m of cash equivalents, no bank debt and US$406.944m of lease liabilities.
Main risk
The central risk is that lease commitments and new-centre fit-out cash arrive before occupancy matures.
Next proof
The next test is the next results' mature-centre occupancy, cash EBITDA conversion and lease-adjusted funding headroom.
Information cutoff 29 August 2026. The latest reported period is the six months ended 30 June 2026. Figures are in US$ millions unless stated otherwise; percentages are reported or transparently computed from primary disclosures.
Evidence balance
The live questionCan cash EBITDA, which already deducts cash lease payments, cover tax and capital expenditure as the committed centre pipeline opens?1H2026 is the first half reported since listing, and it pairs a sharply higher cash EBITDA with lease payments and new lease obligations that were close to each other in size.
What improved
Revenue rose 24% year on year to US$80.780m, cash EBITDA increased 147% to US$10.554m for a 13.1% margin, occupancy was 80%, versus 82% in 1H2025 (and 75% in 1H2024), and revenue per workstation per month rose to US$468.4 from US$422.5.
What became more demanding
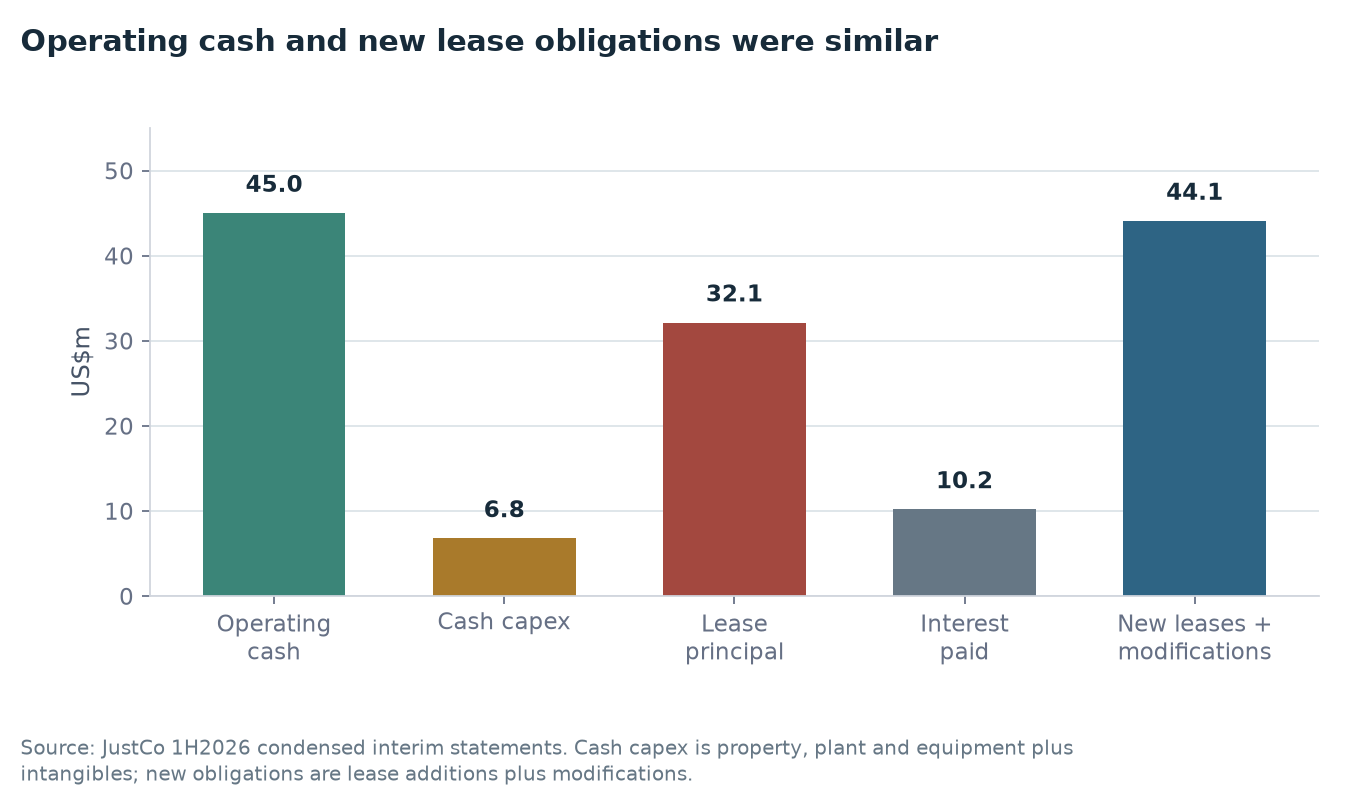
Lease principal and interest absorbed US$42.3m while new leases and modifications added US$44.1m of obligation, and lease liabilities stood at US$406.944m, comprising US$337.526m non-current and US$69.418m current, the fixed property commitment the centre network carries.
Strongest alternative explanation
The 34% of the mature cohort not yet at payback at 31 December 2025 could reflect cohort composition rather than weak unit economics: nine percentage points came from centres opened in August 2024 or later, consistent with sites still ramping, while 20 points came from 2022 pandemic-period openings and five from 2023.
The decisive missing fact
How cash EBITDA converts to issuer-defined free cash flow after tax and capital expenditure, and what maturity, break, renewal and security terms the lease portfolio carries, are both still open questions.
Drawn from the evidence on this page: the improvement, the constraint, the benign reading and the fact that would settle it. It states no view on the shares.
About the private research record
Also on file behind the private view 🔒 (author-only): source register and research notes. No rating, fair value or forecast is reproduced on this public page.
On this page
Business anatomy · operations, customers and cash
Office shells become flexible workspaces and recurring member revenue
Landlords or partners provide the space; JustCo designs and operates the centre, fills workstations and sells access and services.
Read each card by investor role: business line, operating step, customer outcome or cash conversion.
Contract modelSpace
Start with an office shell
What happensA landlord leases a floor to JustCo, or a property partner contributes a site under a management contract.
Risk and returnA traditional lease creates fixed rent; a management contract leaves more property risk with the partner.
Company actionConversion
Build the workspace
What happensJustCo designs the centre, installs desks, meeting rooms and shared amenities, then staffs the operation.
Value createdFit-out and centre costs are incurred before or while occupancy ramps.
Revenue driverOperation
Fill desks and rooms
What happensIndividuals and corporate teams reserve workstations, private offices, meeting rooms and related services.
Revenue driverOccupancy and revenue per workstation determine how productive each centre becomes.
Cash conversionWho pays
Collect recurring fees
What happensMembers pay recurring workspace and service fees; managed sites can also generate management fees or a revenue share.
Cash triggerJustCo receives membership cash, while the property obligation depends on the contract model.
Original SMID Research comic. AI-assisted, analyst-directed monochrome artwork depicts the evidenced operating steps of JustCo Holdings Limited; deterministic captions and dated mix figures state the economics using issuer disclosures available to 2026-08-29. The drawings are representative—not issuer artwork, an exact product or site design, a statement of scale, or a company forecast.
Investor translation
What matters after the operating picture
Four questions connect the business model to cash and balance-sheet risk. This is a factual reading aid, not a valuation or recommendation.
Value lever
Occupancy and revenue per workstation after rent, fit-out and centre operating costs.
Cash bottleneck
Fit-out and lease commitments arrive before new centres reach mature occupancy.
Balance-sheet pressure
Cash after lease payments cannot cover the committed-centre pipeline and fixed property obligations.
Next proof
Mature and new-centre cohorts, cash after leases, committed capex and contract-model mix.
Text version of this comic
Contract model · Start with an office shell A landlord leases a floor to JustCo, or a property partner contributes a site under a management contract. Risk and return: A traditional lease creates fixed rent; a management contract leaves more property risk with the partner.
Company action · Build the workspace JustCo designs the centre, installs desks, meeting rooms and shared amenities, then staffs the operation. Value created: Fit-out and centre costs are incurred before or while occupancy ramps.
Revenue driver · Fill desks and rooms Individuals and corporate teams reserve workstations, private offices, meeting rooms and related services. Revenue driver: Occupancy and revenue per workstation determine how productive each centre becomes.
Cash conversion · Collect recurring fees Members pay recurring workspace and service fees; managed sites can also generate management fees or a revenue share. Cash trigger: JustCo receives membership cash, while the property obligation depends on the contract model.
Listing and network
JustCo Holdings Limited listed on the SGX Mainboard on 22 May 2026 under JCO (ISIN SGXE40121159). The IPO offer price was S$0.94 per share, with 32.092 million offer shares and 74.291 million cornerstone shares; gross proceeds were approximately S$100 million. The IPO materials describe 54 centres and 37,500 workstations at launch.
Network indicator
Latest disclosed
Comparison / note
Operational centres
57
21 centres in committed pipeline to 78
Workstations
37,350
As at 30 June 2026
Occupancy
80%
82% in 1H2025; 75% in 1H2024
Revenue / workstation / month
US$468.4
US$422.5 in 1H2025
Contract mix
59% traditional / 41% management
As at 30 June 2026
First-half 2026 operating evidence
Revenue rose 24% year on year to US$80.780m. Cash EBITDA increased 147% to US$10.554m and the cash EBITDA margin was 13.1%, while reported loss was US$0.839m after IPO-related items and finance costs. Operating cash flow was US$45.010m and issuer-defined free cash flow was US$3.247m. JustCo defines that free-cash-flow measure as Cash EBITDA less tax paid and total capital expenditure; it is not the cash-flow-statement subtotal after lease principal and interest.
US$ million, six months ended 30 June
1H2026
1H2025
Change
Revenue
80.780
65.111
+24%
Cash EBITDA
10.554
4.296
+147%
Cash EBITDA margin
13.1%
6.6%
+6.5ppt
Operating cash flow
45.010
43.773
+3%
Loss for the period
(0.839)
(1.731)
n.m.
Cash capex (PPE + intangibles)
(6.776)
(3.070)
higher expansion spend
Segment snapshot
US$ million
Revenue
Cash EBITDA
South-east Asia
42.223
7.089
North Asia
27.075
5.398
Australia
10.882
(1.259)
India and Others
0.600
(0.674)
Total
80.780
10.554
Three audited years show the operating turn before listing
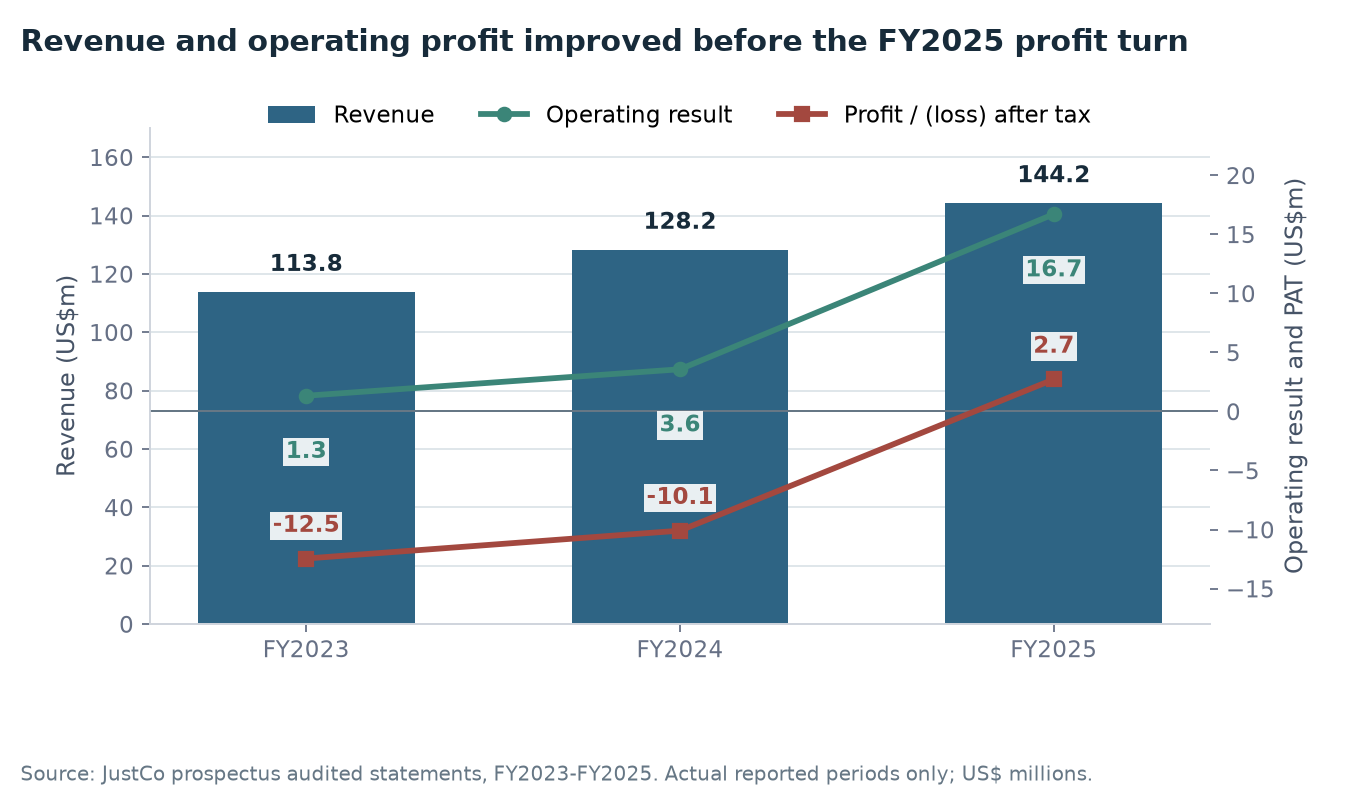
The prospectus carries audited FY2023 to FY2025 financial statements, allowing the first-half print to be read against more than one comparison period. Revenue increased from US$113.772m to US$144.193m over those three years. Results from operating activities rose from US$1.329m to US$16.706m, but the lease-heavy funding structure left net finance costs above US$11m in every year. Profit after tax moved from losses of US$12.454m and US$10.095m in FY2023 and FY2024 to a US$2.717m profit in FY2025.
Audited income and cash record — US$m
Line
FY2023
FY2024
FY2025
Revenue
113.772
128.220
144.193
Results from operating activities
1.329
3.571
16.706
Net finance costs
(11.329)
(12.728)
(14.315)
Share of equity-accounted investees
(2.080)
(0.403)
(0.438)
Profit / (loss) before tax
(12.080)
(9.560)
1.953
Profit / (loss) after tax
(12.454)
(10.095)
2.717
Cash EBITDA
3.4
6.2
13.5
Net operating cash flow
68.432
79.077
101.226
Purchase of property, plant and equipment
(5.664)
(9.049)
(11.523)
Lease-liability principal paid
(48.701)
(48.788)
(59.633)
Interest paid, including lease interest
(14.043)
(16.061)
(16.648)
Year-end cash equivalents
26.709
66.948
76.617
Revenue and the audited operating result improved across the three-year record; final profit turned positive only in FY2025 after net finance costs and the share of equity-accounted losses. Source: prospectus audited financial statements.
Operating cash is structurally much larger than accounting profit because depreciation, right-of-use accounting and lease payments appear in different parts of the statements. The cash-flow statement reported US$73.002m of depreciation and amortisation in FY2025. Lease principal and interest then used US$76.281m of financing cash in that year. A reader therefore needs both the operating-cash line and the lease-payment lines; neither is a complete cash-conversion measure on its own.
FY2025 also included the consolidation of Japan operations from 1 July. The prospectus attributes part of the 12.5% revenue increase to that change in perimeter, alongside higher occupancy and more occupied workstations. The operating-centre count consolidated in the financial statements rose from 41 at December 2024 to 50 at December 2025. The three-year improvement is real in the filed numbers, but it combines organic operating progress with a wider consolidation perimeter.
Sources: JustCo prospectus, summary and audited consolidated statements of comprehensive income and cash flows, pp.48–50 and A-8–A-13. Cash EBITDA is an issuer-defined non-IFRS measure; FY2025 here uses the audited-period disclosure rather than the separate pro-forma Japan presentation.
Network growth became more productive by FY2025
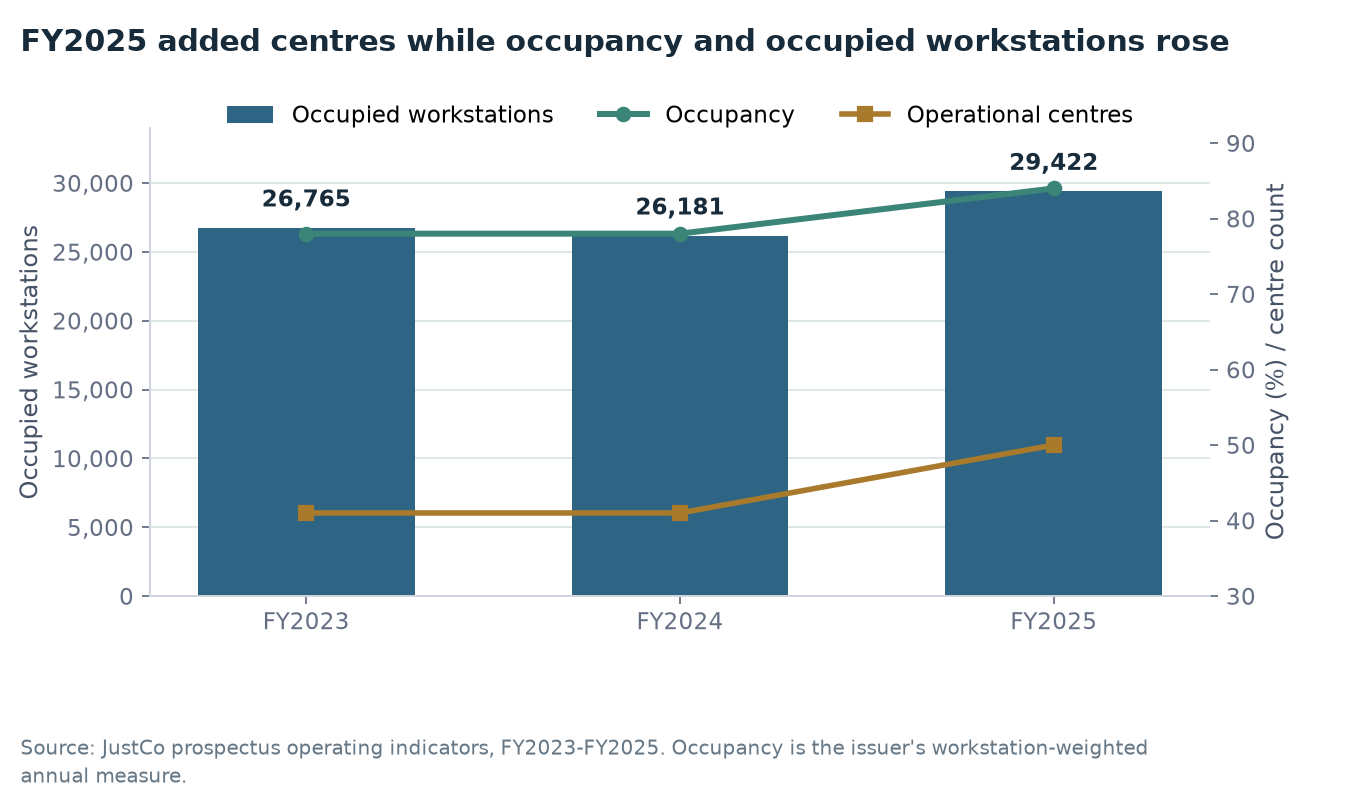
The physical footprint was not a straight-line series. Net lettable area fell from 1.64m square feet in FY2023 to 1.57m in FY2024, then rose to 1.77m in FY2025. Operational centres were flat at 41 in FY2023 and FY2024 before increasing to 50. Occupancy held at 78% for two years and rose to 84% in FY2025; occupied workstations increased to 29,422 after dipping slightly in FY2024.
Filed operating history
Indicator
FY2023
FY2024
FY2025
Operational footprint (m sq ft)
1.64
1.57
1.77
Operational centres
41
41
50
Occupancy
78%
78%
84%
Occupied workstations
26,765
26,181
29,422
Revenue per workstation per month (US$)
468.6
429.8
450.7
Cash EBITDA per workstation per month (US$)
14.0
20.7
41.3
Cash EBITDA margin
3.0%
4.8%
9.2%
Cash and bank balances (US$m)
88.447
90.936
103.972
FY2025 combined a larger consolidated centre count with higher occupancy and more occupied workstations. Source: prospectus operating indicators; actual reported periods only.
The prospectus also records member count rising from 3,176 at December 2023 to 4,035 at December 2025. Renewal success improved by 7.3 percentage points over the same period, while weighted membership tenure stayed around fifteen months. Renewal success is measured against workstations whose licences expired during the year; it counts the full expiring workstation complement for a renewing member even if the member renewed only part of it. That definition makes it a useful directional retention measure, but not the same as retained revenue.
Renewal and tenure evidence
Indicator
FY2023
FY2024
FY2025
Renewal success rate
64.7%
68.2%
72.0%
Weighted membership tenure (months)
15.0
15.4
15.2
At June 2026 the network had 57 operational centres and 37,350 workstations. Occupancy was 80%, below FY2025's annual 84% measure and 1H2025's 82%, but above 1H2024's 75%, while revenue per workstation per month increased to US$468.4 from US$422.5. These are differently dated measures: the annual occupancy rate sums occupied and available workstations across twelve months, whereas the half-year business update presents the current half-year comparison. They should not be spliced into a single monthly trajectory.
Sources: prospectus operating KPI presentation, pp.35–36, and renewal definitions, p.26; 1H2026 business update. FY2025 per-workstation and Cash EBITDA figures use the issuer's disclosed pro-forma presentation that includes Japan for the full period.
The occupied-desk mix spans company sizes, regions and industries
At December 2025, large corporates represented 53.3% of 29,422 occupied workstations, SMEs 28.2% and startups 18.6%. South-east Asia accounted for 55.3%, North Asia 30.9% and Australia 13.7%. These figures describe occupied workstations, not billed revenue or contractual term. They nevertheless show what kind of demand filled the network before the 2026 expansion.
Occupied-workstation composition at 31 December 2025
Lens
Category
Share
Member type
Large corporates
53.3%
Member type
Small and medium enterprises
28.2%
Member type
Startups
18.6%
Geography
South-east Asia
55.3%
Geography
North Asia
30.9%
Geography
Australia
13.7%
The industry presentation attributes 36.0% of the classified workstations to information and communication, 14.0% to professional, scientific and technical activities, 13.5% to financial and insurance activities, 12.2% to manufacturing, 4.7% to real estate and 3.7% to transportation and storage. A further 15.8% sat across other industries, while 4,764 workstations with unknown industry data were excluded from that industry calculation. The sector percentages therefore apply to the classified subset rather than all 29,422 occupied workstations.
Membership agreements typically run from six to 36 months. The offering spans one-person coworking access, private offices for teams of one to 49 and enterprise offices for teams of 50 or more. Meeting rooms, event spaces, virtual offices, administrative support, IT services and fit-out work add services revenue; that stream was approximately US$16.0m in FY2025. Its disclosed FY2023–FY2025 compound growth rate was 14.8%.
The multi-city proposition is visible in the prospectus case study of one large corporate that expanded from 17 workstations in South Korea in 2020 to 84 across South Korea, Singapore, Japan and Taiwan in 2025. The issuer explicitly labels that case illustrative rather than representative. It is evidence that the network can accommodate regional expansion for one customer, not a base rate for the member book.
Source: prospectus business and competitive-strength disclosures, pp.23–27 and 141–149. Percentages may not add exactly because the issuer rounded them.
Centre maturity determines when expansion reaches cash payback
The prospectus separates the development cycle into site sourcing, fit-out, occupancy ramp and stabilisation. Across the cited centre cohort, average centre-level Cash EBITDA breakeven occurred at about five months after launch, the reported 86% occupancy point at about ten months and payback at about sixteen months. Those are issuer cohort measures rather than guarantees for each opening.
mature centres opened after 1 January 2022, weighted by NLA
Traditional-lease payback
24.0 months
same mature-centre cohort
Management-contract payback
15.8 months
same mature-centre cohort
Mature cohort achieving payback
66%
same cohort at 31 December 2025
Within that cohort, about 25% of net lettable area was under traditional leases and 75% under management contracts. Of the 34% that had not achieved payback, 20 percentage points came from centres opened in 2022 during the pandemic period, five from 2023 and nine from August 2024 or later. The cohort composition matters: older pandemic openings and newer ramping sites sit together inside the unpaid share.
The contract model changes who funds the initial fit-out and who bears the fixed property obligation. Under a traditional lease, JustCo funds the upfront capital investment, pays rent and retains the operating benefit. Under management contracts, landlords fund all or a substantial portion of upfront capital and JustCo may retain a revenue or profit share, receive a recurring fee, pay a minimum base rent, or in some arrangements pay fixed rent and retain all workspace revenue. “Management contract” is therefore not one uniform fee-only structure.
The 1H2026 segment note labels centres operating for more than twelve months as mature and those operating for twelve months or less as non-mature. South-east Asia produced US$7.089m of total Cash EBITDA and North Asia US$5.398m, while Australia produced a US$1.259m loss and India and Others a US$0.674m loss. India included three centres in ramp-up, with two already opened during the half and one not yet operating at June. Australia’s mature centres improved on higher workstation rates, partly offset by lower occupancy. This is why aggregate occupancy alone cannot explain the segment result.
Sources: prospectus centre-development and payback discussion, pp.33–34; 1H2026 condensed interim statements, operating-segment note and management discussion, pp.9–20.
Lease liabilities are the main bridge from operating earnings to cash
JustCo's disclosed Cash EBITDA already deducts cash lease payments from EBITDA before lease-related expenses. The segment note begins with EBITDA before lease-related expenses, subtracts cash lease payments on lease liabilities and then adjusts for foreign exchange, share-based payments and one-off items. It therefore does not equal IFRS operating profit, and it should be read with the lease roll-forward and financing cash flow.
Lease-liability roll-forward in 1H2026 — US$m
Movement
Amount
Opening balance, 1 January
402.151
New lease additions
39.768
Lease modifications
4.314
Interest accretion
10.047
Payments
(42.182)
Exchange differences
(7.154)
Closing balance, 30 June
406.944
The US$42.182m of payments in the roll-forward reconciles closely to US$32.135m of lease principal and about US$10.047m of lease-interest accretion. At the same time, US$44.082m of additions and modifications added almost as much new lease obligation as was paid. The closing liability therefore rose US$4.793m even after six months of payments.
1H2026 cash-flow bridge — US$m
Cash-flow line
1H2026
Reading
Net operating cash generated
45.010
after working capital and tax
Purchase of property, plant and equipment
(6.705)
cash fit-out and asset spend
Purchase of intangibles
(0.071)
software and other intangibles
Net investing cash flow
(4.757)
also includes deposit withdrawals and deferred consideration
IPO share proceeds
78.296
financing inflow
Lease principal paid
(32.135)
financing outflow under IFRS 16 presentation
Interest paid, including lease interest
(10.184)
financing outflow
Net financing cash flow
32.248
IPO inflow less lease and listing-related outflows
Increase in cash equivalents
72.501
before opening cash and exchange movement
Operating cash was positive, but lease principal and interest absorbed US$42.3m while new leases and modifications added US$44.1m of obligation. Source: 1H2026 condensed interim statements.
The income statement shows the other side of that accounting. In 1H2026, depreciation and amortisation was US$41.864m and finance costs were US$11.067m, while the results from operating activities were US$10.354m and the final loss was US$0.839m. Management said the US$2.910m increase in finance costs came mainly from US$2.4m more lease interest following new-centre openings and the consolidation of Japan.
Cash and bank balances of US$169.374m included US$19.101m of pledged fixed deposits and US$5.057m with tenures beyond three months, leaving US$145.216m classified as cash equivalents. The pledged balance supports bank guarantees used as security deposits for some centre leases. Gross cash is therefore a different number from the immediately available cash-equivalent line used in the cash-flow statement.
Source: 1H2026 condensed interim statements, cash-flow statement, Notes 5 and 11, and management discussion, pp.6–22. Arithmetic in the narrative is computed from the filed movements.
Two cash bridges, with different starting points
For the six months ended 30 June 2026, in US$ million:
Issuer-defined free cash flow: Cash EBITDA 10.554 less tax paid 0.531, property, plant and equipment purchases 6.705 and intangible purchases 0.071 equals 3.247. Cash EBITDA already deducts cash lease payments; deducting lease principal or lease interest again would count them twice.
Limited cash-flow-statement subtotal: operating cash flow 45.010 less property, plant and equipment purchases 6.705, intangible purchases 0.071, lease principal paid 32.135 and total interest paid 10.184 equals −4.085. Operating cash flow is already after tax. The interest line includes lease interest and other interest; it is not lease interest alone.
The limited subtotal is neither normalized free cash flow nor total cash movement. It excludes interest received, deferred acquisition consideration, deposit withdrawals, share proceeds, share issue and IPO listing expenses, and fit-out subsidy principal. Exchange movements also affect closing cash. It does not replace the issuer's free-cash-flow measure.
Most IPO proceeds were still unspent at the first reporting date
The IPO and cornerstone issuance raised S$100.0m, reported as US$78.3m in the 1H2026 statements. At the results date, S$21.2m had been used and S$78.8m remained. Most of the balance was earmarked for strategic investments and capital expenditure supporting expansion; the public evidence records allocation and actual use, not a judgement on returns from future deployment.
IPO proceeds status at the 1H2026 announcement — S$m
Purpose
Allocated
Used
Balance
Strategic investments and expansion capital expenditure
81.7
15.3
66.4
General corporate purposes and working capital
10.0
0.0
10.0
Underwriting fees and offering expenses
8.3
5.9
2.4
Total
100.0
21.2
78.8
The proceeds table helps reconcile the rise in cash, but not every dollar of the S$78.8m balance is identical to group cash equivalents. The table is denominated in Singapore dollars, while the group statements use US dollars; cash also includes pre-existing balances, pledged deposits and foreign-exchange movement. The next filed proceeds update should therefore be matched purpose by purpose against centre openings, property and equipment additions and changes in lease obligations.
Source: 1H2026 condensed interim statements, “Use of IPO proceeds”, p.24. The issuer stated that utilisation was in accordance with the prospectus purposes.
Balance sheet and credit evidence
At 30 June 2026, cash and bank balances were US$169.374m and cash equivalents after pledged and long-dated deposits were US$145.216m. The statements disclose no external bank debt. Lease liabilities were US$406.944m, comprising US$337.526m non-current and US$69.418m current; this lease-heavy structure is the key credit lens even though bank debt is absent.
Credit read-through Liquidity improved after the IPO and operating cash flow is positive. A complete instrument-level credit opinion is not published: lease schedules, covenant terms, security packages and recovery evidence have not been independently validated in this initiation run.
Event tape to the cutoff
Date
Disclosure
Why it matters
15 May 2026
IPO launch and prospectus
Offer terms, network history and expansion plan
22 May 2026
SGX Mainboard listing
JCO begins trading; opening price S$0.835
26 Jun 2026
the boring office at The Octagon
Singapore CBD expansion
9 Jul 2026
JustCo Place, 160 Orchard Road
100% coworking pre-commitment from Deloitte; 123 coliving apartments
6 Aug 2026
1H2026 results and business update
Revenue, cash EBITDA, occupancy and contract mix
11 Aug 2026
CEO interest filing
Director dealing / ownership disclosure
18 Aug 2026
MSCI Global Micro Cap Index inclusion
Technical index-flow and visibility event; effective at close of 31 August
The SGX performance record reports a first-day close of S$0.775 and a 27 August 2026 close of S$0.590 (market capitalisation S$288.649m). These are context only; no public valuation or expected return is presented. No post-18 August issuer item was identified in the issuer newsroom or investor-relations mirror through the cutoff; complete exchange-tape pagination was not independently re-proven.
Questions to keep live
Can occupancy and revenue per workstation continue to rise as the 21-centre pipeline opens?
How does cash EBITDA, which already deducts cash lease payments, convert to issuer-defined free cash flow after tax and capital expenditure?
What are the maturity, break, renewal and security terms embedded in the lease portfolio?
Does the management-contract mix grow without diluting centre-level economics?
How does the newly listed group report FY2026 seasonality, one-off IPO costs and dividend capacity?
These bounded retrospective corrections clarify specific published facts or calculations. They retain each report's existing research cutoff and do not represent a full refresh or a finding that all possible issues are resolved.
JustCo Holdings Limited
Verified Fact. Occupancy was 80% in 1H2026 versus 82% in 1H2025 and 75% in 1H2024. Sources: Source. Limitation: The comparison does not establish demand at comparable centres because cohorts and geography differ.
What you can watch yourself
Every other test on this page waits for the company to file. These do not. Each row is a series you can look up yourself, free, today — with the level this reading was built against, the levels that would put it in question, and what the series cannot tell you.
SGX IPO performance record; read the latest recorded JCO close and compare it with the offer price. Singapore Exchange
Last recorded
0.59 SGD per share, 2026-08-27
Reference
0.94 SGD per share (IPO offer price, May 2026 listing)
Threshold status
No calibrated operating threshold; retained price markers are source history only.
How often to look
after each exchange performance update (the series prints event)
What it points to. The traded price is a market signal about liquidity and expectations, not a direct measure of centre occupancy, cash EBITDA or lease-service capacity.
Direction only — this pack does not carry a coefficient from this series to reported earnings.
What it cannot tell you. Price can move on liquidity, sentiment or index effects without changing occupancy, cash conversion, lease obligations or the underlying operating evidence.
Settled by the next company results, occupancy and pipeline update; the 31 August MSCI inclusion is a technical event, not a results date. Lead time: price moves can precede an operating disclosure but do not prove one.
Watchlist reviewed on 2026-08-29; each observation has its own date above. This watchlist date does not change the company research cutoff. A series moving past a level is a reason to re-read the case, not a recommendation. The same series across every company covered: what you can watch.
Download
A print-ready PDF of this page, for reading away from the screen: JustCo Holdings evidence library (PDF). It carries the same content as this page — the listing and network, first-half 2026 operating evidence, the three audited years, network economics, the member mix, centre maturity, the lease bridge, the IPO proceeds, the balance sheet and credit evidence, the event tape and open questions — and the same omissions: no rating, no fair value, no forecast.
Limitations. The 613-page SGX prospectus, 11-page 1H2026 business update and 27-page 1H2026 financial statements are retained in the private source library. The public page therefore carries reported evidence only and no rating, fair value or forecast. Corrections: email [email protected] with the source and page.
Reader questions & corrections
Ask about this company, challenge a source or suggest a factual correction. Only selected questions that SMID Research has reviewed and answered are published.
Submissions are private by default. Your email is encrypted and never published. Please do not send confidential or inside information, allegations about individuals, promotions, or requests for personalised investment advice.
Behind the lock The private vault contains the author's source register and research notes. It remains private and is not investment advice.
Transcripts
Find available event transcripts in the transcript library.