Lincotrade tenders at a fixed sum for interior fitting-out, additions and alterations and related construction work in Singapore, fabricates the joinery in its own workshops, subcontracts the trades and is paid as the customer's consultant certifies progress.
Latest figures
FY2026 revenue rose 75.8% to S$129.5m and profit attributable to owners reached S$8.1m, but operating cash flow was negative S$2.3m as contract assets tripled to S$22.4m; other financial liabilities reached S$34.0m, of which 83.7% was current and S$26.2m was bills payable of 7 to 112 days.
Main risk
The central risk is that profit recognised on cost incurred keeps outrunning certified collection, so growth has to be funded by short-dated secured bank bills whose limits and covenants the filings do not disclose.
Next proof
The next test is the audited FY2026 annual report expected in October 2026, then the order-book update for 30 September, historically released in mid-November, and results for the half year ending 31 December 2026.
No public letter rating, no valuation.
Information cut-off: 3 September 2026. The latest financial statement in scope is the FY2026 full-year announcement of 28 August 2026, for the year to 30 June 2026; those figures are preliminary, unaudited and unreviewed, and the audited FY2026 annual report had not been published at the cut-off.
Evidence balance
The live questionWill certified collections on the larger book convert recognised profit into cash, or must short-dated bills keep funding the gap?FY2026 was the year the two lines diverged: record revenue and profit arrived while operating cash flow turned negative, and a S$70.0m award has since been added on top of the June book.
What improved
Revenue rose 75.8% to S$129.5m, gross profit rose to S$17.3m, gross margin improved to 13.3% and profit attributable to owners reached S$8.1m; the order book stood at S$106.2m at 30 June 2026.
What became more demanding
Operating cash flow was negative S$2.3m as contract assets tripled to S$22.4m and current receivables rose to S$23.5m; other financial liabilities reached S$34.0m, 83.7% of it current, including S$26.2m of bills payable of 7 to 112 days.
Strongest alternative explanation
The build could be timing rather than structure: operating cash flow before working capital was S$12.4m, above the S$8.1m of profit, and the FY2025 contract-asset note transferred S$68.6m out to receivables as work was certified. Negative cash does not by itself establish that the work will fail to certify.
The decisive missing fact
How much of the S$22.4m of contract assets and S$23.5m of current receivables at 30 June 2026 had been certified and collected after the year end, what bills payable stood at then, and the committed limits and covenant definitions of those facilities.
Drawn from the evidence on this page: the improvement, the constraint, the benign reading and the fact that would settle it. It states no view on the shares.
About the private research record
Author-only research notes are available through the private view. They remain private and are not approved for public distribution.
On this page
Business anatomy · from inputs to customer value
Fit-out work becomes cash only after design, fabrication, installation and certification
The reported margin is set during tendering and execution; the balance-sheet risk appears when completed work waits for certification, collection and retention release.
Follow the operating chain from demand or inputs to customer outcome and cash.
Customer needDesign brief
Price the scope
What happensA commercial or residential customer defines the fit-out, alteration or construction scope.
Commercial triggerThe tender fixes price, programme, materials and execution risk.
Company actionFabrication
Build and procure
What happensCarpentry, materials, labour and subcontractors turn drawings into project components.
Value createdInputs are funded before every milestone is certified and paid.
Customer deliverySite execution
Install and certify
What happensSite teams coordinate trades, complete the fit-out and submit milestones for approval.
Revenue triggerProgress accounting can precede customer collection.
Cash conversionHandover
Collect and recycle
What happensAcceptance creates invoices and eventual collections; some cash remains in retention.
Cash triggerCollected cash funds the next job, debt, capex, dividends and associate commitments.
Original SMID Research comic. AI-assisted, analyst-directed monochrome artwork depicts the evidenced operating steps of Lincotrade & Associates Holdings; deterministic captions and dated mix figures state the economics using issuer disclosures available to 2026-09-03. The drawings are representative—not issuer artwork, an exact product or site design, a statement of scale, or a company forecast.
Investor translation
What matters after the operating picture
Four questions connect the business model to cash and balance-sheet risk. This is a factual reading aid, not a valuation or recommendation.
Value lever
Project volume, tender discipline, gross margin and in-house execution.
Cash bottleneck
Contract assets, receivables and retention build before customer cash arrives.
Balance-sheet pressure
Short-dated secured facilities cannot cover project funding and fixed uses.
Next proof
Audited working-capital notes, facility availability and positive operating cash.
Text version of this comic
Customer need · Price the scope A commercial or residential customer defines the fit-out, alteration or construction scope. Commercial trigger: The tender fixes price, programme, materials and execution risk.
Company action · Build and procure Carpentry, materials, labour and subcontractors turn drawings into project components. Value created: Inputs are funded before every milestone is certified and paid.
Customer delivery · Install and certify Site teams coordinate trades, complete the fit-out and submit milestones for approval. Revenue trigger: Progress accounting can precede customer collection.
Cash conversion · Collect and recycle Acceptance creates invoices and eventual collections; some cash remains in retention. Cash trigger: Collected cash funds the next job, debt, capex, dividends and associate commitments.
What Lincotrade does
Lincotrade fits out the insides of Singapore buildings. The work is offices, hotels, malls, data centres, schools, condominiums and showflats: partitions, ceilings, floors, doors, fixtures, the coordination of mechanical and electrical trades, and additions and alterations to premises already in use. Contracts are won by tender at a fixed sum. The joinery is fabricated in the group’s own workshops, the trades are subcontracted, the installation is managed on site, and the customer pays as a consultant certifies progress. Almost everything else on this page follows from that last sentence: revenue is recognised as cost is incurred, and cash arrives only after somebody else signs.
The group reports three revenue segments by customer type. In FY2026, the year to 30 June 2026, commercial work supplied S$121.6m of revenue, 93.9% of the group, at a 13.2% gross margin. Residential work, mostly carpentry and fit-out subcontracted from main contractors on condominium developments, supplied S$6.8m at 15.8%. Showflats supplied S$1.1m at 9.1%. That last line is the one worth holding on to: showflat revenue was S$18.0m in FY2023 and has been run down deliberately since. The mix is not an accident of demand; it is a choice about which work is worth tendering for.
Customers fall into three groups. Building owners and occupiers buy fit-out directly — the filings name an educational institution, PSA and CapitaLand entities among them. Main contractors subcontract fit-out and carpentry packages on new developments; the 2022 reverse-takeover circular’s customer table lists Shimizu, Nakano, Keong Hong, Lum Chang Building Contractors, Straits Construction and United TEC. Developers commission showflats and residential fit-out. Data-centre operators and their main contractors are a named source of recent intake, though the group does not disclose what share of revenue or of the order book data-centre work represents.
The business is Singapore. FY2026 revenue by customer location was S$128.2m from Singapore, S$1.3m from Malaysia and S$15,000 from the PRC — 99.0% domestic. The Malaysian revenue is a Johor subcontract; the PRC figure is the external sales of a Dongguan carpentry subsidiary that mainly supplies the group. Geographic diversification is not a useful lens here. Customer concentration, project execution and Singapore construction demand are.
What the group owns and holds by way of qualification matters more than its balance sheet does. It carries a BCA CR06 L6 registration — the grade that removes the tendering limit on public-sector interior works — and a General Builder Class 1 licence, together with ISO 9001 and bizSAFE Star certification. It fabricates joinery in its own Singapore workshops and in a Dongguan facility. Its headquarters at 5 Tuas Avenue 12 sits on a 20-year JTC leasehold taken in March 2024, with 6,276.8 square metres of gross floor area after the additions and alterations works and a 204-bed workers’ dormitory; 175 of those beds were occupied at 30 June 2026, 108 by the group’s own foreign workers and 67 rented to subcontractors.
The listing history explains the shape of the accounts. Lincotrade & Associates Pte Ltd, the operating company, was acquired by Fabchem China in a reverse takeover completed in August 2022; the consideration was S$25.0m, satisfied in 113,636,363 new shares issued at S$0.22. Because the operating company was the accounting acquirer, the FY2022 column of the group’s own comparatives is the operating company alone, and FY2023 carries the one-off non-cash charges of the transaction. Neither point is a criticism of the accounts; both are reasons not to read the five-year series as five like-for-like years.
Operating disclosure gap. The group does not publish headcount after the 2022 circular (113 full-time employees at that document’s latest practicable date), the data-centre share of revenue or of the order book, the backlog split by expected year of recognition, or any project-level margin. Growth therefore cannot be decomposed into volume, price and mix from the public record, and the cost of foreign labour cannot be sized.
The five-year record, and what is not comparable in it
FY2026 was a record year on every reported line except cash. Revenue rose 75.8% to S$129.5m, gross profit rose to S$17.3m, gross margin improved to 13.3%, profit attributable to owners reached S$8.1m and earnings per share were 4.54 Singapore cents on a weighted average of 177,737,528 shares. Net asset value per share attributable to owners rose from 7.21 cents to 10.89 cents. Dividends declared for the year came to 1.78 cents a share: an interim of 0.88 cents paid on 30 March 2026 and a proposed final of 0.90 cents, subject to approval. Against S$8.1m of profit that is a payout of 40.1%.
S$m except per share
FY2022
FY2023
FY2024
FY2025
FY2026
Revenue
39.3
69.9
67.9
73.6
129.5
Gross profit
4.7
7.3
7.9
9.2
17.3
Gross margin
11.9%
10.4%
11.6%
12.5%
13.3%
Profit attributable to owners
0.6
(8.7)
2.3
2.6
8.1
Earnings per share
0.55c
(5.24)c
1.33c
1.49c
4.54c
Dividends declared per share
—
0.00c
0.70c
0.66c
1.78c
Net cash from operating activities
1.0
4.7
5.5
0.8
(2.3)
Purchases of property, plant and equipment
(0.1)
(0.4)
(10.3)
(1.1)
(3.1)
Free cash flow
0.9
4.3
(4.8)
(0.4)
(5.4)
Cash and cash equivalents
6.2
12.7
11.5
12.6
17.7
Other financial liabilities
10.7
13.1
17.3
20.8
34.0
Project working capital / revenue
22.1%
10.5%
7.7%
9.5%
15.5%
Net asset value per share
—
—
—
7.21c
10.89c
Sources: annual reports FY2022 to FY2025 and the FY2026 results announcement of 28 August 2026. FY2022 is Lincotrade & Associates Pte Ltd alone, the accounting acquirer in the reverse takeover. Free cash flow is operating cash flow less purchases of property, plant and equipment. Other financial liabilities for FY2022 to FY2024 are the current and non-current balance-sheet lines added together; FY2025 and FY2026 are the note 19 totals. Project working capital is contract assets plus current trade and other receivables less trade and other payables, over revenue. Dashes mark figures the filings read for this page do not carry on a comparable basis.
Three things in that table are not what they look like. FY2023’s loss is not an operating loss. The year carries S$9.6m of deemed reverse-acquisition expenses and S$1.2m of share-based payments to the sponsor and arranger, both non-cash and both consequences of the listing rather than of the fit-out business; operating cash flow that year was positive S$4.7m. FY2024’s capital spending is not a run rate. The S$10.3m includes the purchase of the Tuas property, won in a JTC tender at S$9.6m in January 2024; capital spending in every other year of the series ran between S$0.1m and S$3.1m. And FY2024 was the trough, not the base. Revenue fell to S$67.9m, profit attributable to owners was S$2.3m, and the order book at 30 June 2024 stood at S$39.5m, the lowest figure the group has disclosed. Two years later the same three numbers were S$129.5m, S$8.1m and S$106.2m. A business that can move that far in two years can move back.
The half-year split is the part of the record most likely to be skipped, and it is the part that carries the most information about FY2026.
S$m
1H FY2025
2H FY2025
1H FY2026
2H FY2026
Revenue
33.7
40.0
53.3
76.2
Gross profit
4.1
5.1
8.0
9.3
Gross margin
12.2%
12.8%
15.0%
12.2%
Profit attributable to owners
0.7
1.8
3.9
4.2
Net cash from operating activities
4.1
(3.3)
0.9
(3.2)
First halves are the six months to 31 December as reported. Second halves are the full year less the first half, which is arithmetic rather than a figure the issuer publishes. Half-year gross margins are derived the same way.
Revenue accelerated through the year and margin went the other way: 15.0% in the first half, 12.2% in the second. Operating cash flow was negative in both second halves. The second half of FY2026 is the most recent evidence of what the business earns and collects when it is running at full stretch, and it is materially weaker on both counts than the full-year averages the headline reports.
On the reliability of the numbers: the auditor is RSM SG Assurance LLP, and the opinions on record are unmodified. The FY2025 key audit matters were the accounting for construction and renovation contracts — all S$73.6m of that year’s revenue recognised over time on the input, or cost-to-cost, method, with the estimate of costs to complete named as a significant judgement — and the impairment of trade and retention receivables of S$17.3m and contract assets of S$7.4m, together 47% of total assets. Both matters bear directly on FY2026, where contract assets tripled. The FY2026 figures on this page have not yet been through an audit.
The order book, the awards, and what an award is not
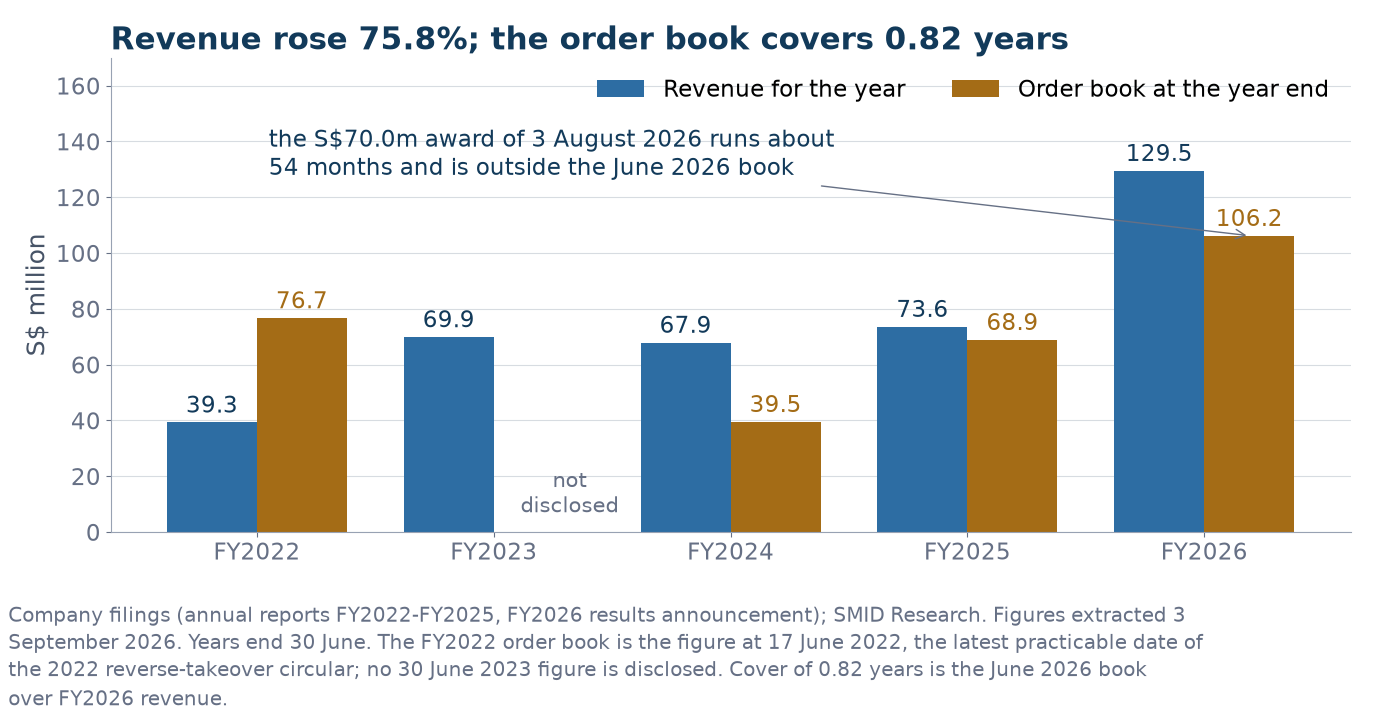
The order book is cover, not revenue. Revenue for each year against the order book disclosed at that year end, S$m. The June 2026 book of S$106.2m is 0.82 years of FY2026 revenue. Source: annual reports FY2022–FY2025, the FY2026 results announcement and the 2022 reverse-takeover circular.
Lincotrade discloses its outstanding order book at quarter ends, in the results announcements and in press releases that usually follow the quarter by six to ten weeks. The series is the single most useful public number the company publishes, because revenue in the following two to four quarters comes out of it. Twelve readings are on the record.
As at
Order book
What the filing said
17 June 2022
S$76.7m
Latest practicable date of the reverse-takeover circular; to be fulfilled over the following two years
30 September 2023
S$70.0m
After two office fit-out wins totalling S$28.1m announced on 17 October 2023
31 December 2023
S$47.0m
Half-year results
30 June 2024
S$39.5m
The lowest figure on record
30 September 2024
S$56.0m
After S$31.0m of wins in the July to September quarter, including a first Johor commercial contract
31 December 2024
S$53.9m
Half-year results
31 March 2025
S$81.0m
Comparative given in the May 2026 order announcement
30 June 2025
S$68.9m
Full-year results; 89.6% commercial per the press release
30 September 2025
S$113.0m
After S$61.0m of wins in the quarter, all Singapore
31 December 2025
S$117.2m
Includes a S$29.1m data-centre contract secured in the first half
31 March 2026
S$107.0m
After seven commercial wins of S$16.8m, one of them a S$8.2m public-sector project
30 June 2026
S$106.2m
Excludes the S$70.0m award announced on 3 August 2026
Read the series rather than the last row. The book fell from S$76.7m to S$39.5m over the two years to June 2024, then nearly tripled to S$113.0m over the following fifteen months, and has drifted sideways since: S$113.0m, S$117.2m, S$107.0m and S$106.2m across the four quarters to June 2026. What happened in FY2026 is that the intake surge of the preceding eighteen months was converted into revenue. Implied intake — revenue for the year plus the change in the book — was S$103.0m in FY2025 and S$166.8m in FY2026, a book-to-bill of 1.29 times. At 30 June 2026 the book was 0.82 years of FY2026 revenue. On the same arithmetic the June 2025 book was 0.94 years of FY2025 revenue and the June 2024 book was 0.58 years of FY2024 revenue.
On 3 August 2026 the group announced its largest contract to date: approximately S$70.0m of additions, alterations and office fit-out works at an educational institution, commenced on 1 August 2026 and running approximately 54 months. Added to the June book that is a pro-forma S$176.2m. Three things about it are worth stating plainly. It is equal to 54% of FY2026 revenue but is spread over roughly four and a half years, so its average annual contribution is a fraction of that. It puts one counterparty behind close to 40% of the pro-forma book for four years, and the filings do not name the institution or disclose the certification and payment cycle. And a fixed contract sum carried for 54 months places the risk of construction, labour and overhead cost inflation on the contractor unless an escalation clause says otherwise; whether one exists is not disclosed.
The issuer’s own outlook at 28 August 2026 was that demand for interior fitting-out should remain positive on the Building and Construction Authority’s projections, while management remained mindful of rising construction, labour and overhead costs, inflation, geopolitics and tighter foreign-worker policies. It quoted BCA’s projected total construction demand for 2026 of S$47bn to S$53bn, a midpoint of S$50bn, and BCA’s projected average annual demand of S$39bn to S$46bn, a midpoint of S$42.5bn, for the four years from 2027. National construction demand is context for the size of the tender pool; it is not a measure of what Lincotrade wins, at what margin, or when it gets paid.
Evidence boundary. An order book is a contracted sum, not scheduled revenue and not collected cash. Lincotrade does not publish the backlog by expected year of recognition, the margin carried in it, the billing milestones, the retention terms, performance security, or the customer split. The S$70.0m award should not be added mechanically to any single year’s revenue.
FY2026: why a record profit was not cash
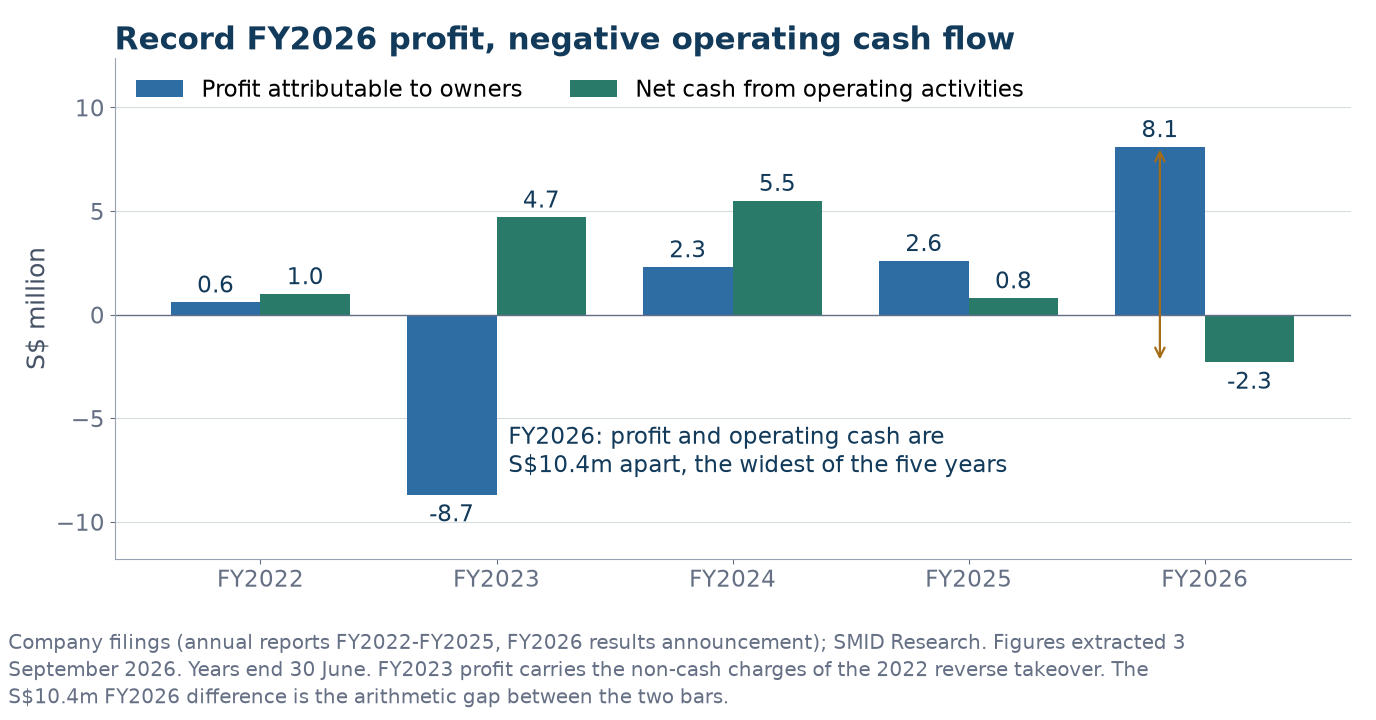
The two lines separated in FY2026. Profit attributable to owners against net cash from operating activities, S$m. FY2023 profit carries the non-cash charges of the reverse takeover. Source: annual reports FY2022–FY2025 and the FY2026 results announcement.
Operating cash flow before working-capital movements was S$12.4m in FY2026, comfortably above the S$8.1m of profit attributable to owners. Everything that went wrong with the cash happened in the working-capital lines below it.
FY2026 operating cash flow, S$m
Amount
What it is
Operating cash flow before working capital
12.4
Profit before tax plus depreciation, interest and other non-cash items
Change in contract assets
(15.0)
Work done and recognised but not yet certified for billing
Change in trade and other receivables
(11.0)
Certified and billed but not yet collected
Change in trade and other payables
13.0
Subcontractors and suppliers funding part of the build
Change in inventories
0.3
—
Change in other non-financial assets
(0.4)
—
Cash generated from operations
(0.8)
After the working-capital movements above
Interest paid
(0.6)
Classified in operating activities
Income tax paid
(1.0)
—
Net cash from operating activities
(2.3)
Against S$8.1m of profit attributable to owners
Source: FY2026 results announcement, consolidated statement of cash flows. Components are stated as reported and do not always sum exactly to the subtotals because each is rounded to one decimal.
The balance sheet says the same thing in stock terms. Contract assets rose from S$7.4m to S$22.4m over the year, a threefold increase against revenue growth of 75.8%. Current trade and other receivables rose from S$12.4m to S$23.5m; within that, trade receivables from outside parties went from S$10.4m to S$19.5m and current retention receivables from S$1.8m to S$4.1m. A further S$4.9m of retention sits in non-current receivables, money the group will not see until between one and two years after the relevant projects complete. On the other side, trade and other payables rose from S$17.8m to S$30.8m, of which trade payables to outside parties were S$24.7m and retention payables S$5.9m.
The group’s own turnover-day disclosure moved less than those balances suggest: receivable days went from 52 to 55 and payable days from 78 to 80, both computed by the issuer excluding retention balances. That is the honest version of the working-capital story. On the measure the company reports, the cycle barely changed; what changed is the scale of the business running through it, plus the S$15.0m of work sitting in contract assets, which the days calculation does not touch at all. Contract assets are the line that behaves least like a receivable: they are work the company has done and taken profit on, which no customer has yet agreed to be billed for.
The ratio that captures it is cash conversion, operating cash flow over profit after tax: 2.44 times in FY2024, 0.29 times in FY2025 and negative 0.29 times in FY2026. Free cash flow after capital spending was negative S$5.4m in FY2026, against negative S$0.4m in FY2025 and negative S$4.8m in the year of the Tuas purchase. In the same year the group paid S$2.7m of dividends and bought S$0.1m of its own shares into treasury. The cash for all of it came from a S$13.0m net increase in bills payable and S$2.1m of net placement proceeds.
None of this says the profit is wrong. Under the input method, profit is recognised as cost is incurred against an estimate of total contract cost; if the estimates are right and the customers pay, the cash arrives later and the two series converge. The FY2025 contract-asset note shows exactly that mechanism working in a normal year: the balance opened at S$2.4m, took up S$73.6m of revenue and transferred S$68.6m out to receivables as work was certified, closing at S$7.4m. The FY2026 question the filings cannot answer is how much of the S$22.4m of contract assets and S$23.5m of receivables at 30 June 2026 had been certified and collected by the end of September, and what bills payable stood at on that date.
Evidence boundary. The announcement discloses no post-balance-sheet collections, no ageing of contract assets, no project-level breakdown of the contract-asset balance, and no expected-credit-loss movement for FY2026. Whether the FY2026 build is timing or structure is not decidable from the public record.
Margin, and the working-capital cycle underneath it
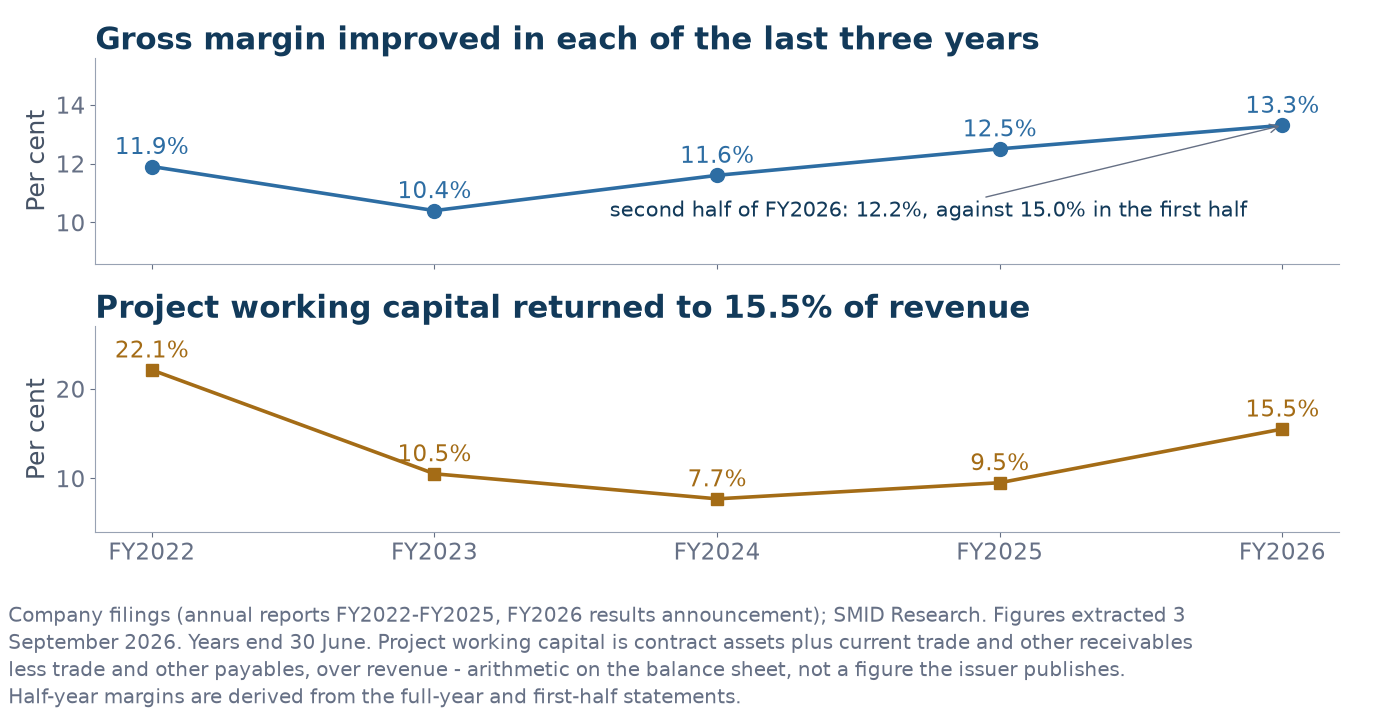
Two series that have to be read together. Reported gross margin and project working capital as a share of revenue. Project working capital is contract assets plus current trade and other receivables less trade and other payables — arithmetic on the balance sheet, not a figure the issuer publishes. Source: annual reports FY2022–FY2025 and the FY2026 results announcement.
Gross margin has improved in each of the last three years, from a 10.4% low in FY2023 to 11.6%, 12.5% and 13.3%. Read at the half-year the picture is less linear. FY2024 ran 10.6% then 13.3%; FY2025 ran 12.2% then 12.8%; FY2026 ran 15.0% then 12.2%. The record year contains both the strongest half in the series, at 15.0%, and an exit rate of 12.2% — the same as the weakest half of FY2025. A reader forecasting from this page has to decide which of those two numbers describes the work now in the book, and the filings give no project-level margin with which to decide it.
Segment margins moved in different directions in FY2026. Commercial improved from 12.1% to 13.2%, which is what carried the group figure given commercial is 93.9% of revenue. Residential slipped from 16.5% to 15.8%. Showflats fell from 15.9% to 9.1% on S$1.1m of revenue, small enough that it changes nothing at group level but consistent with a segment being wound down rather than optimised.
Below gross profit the cost base is small and largely fixed. The FY2026 segment reconciliation shows unallocated employee benefits of S$3.3m, unallocated corporate expenses of S$2.4m and unallocated depreciation of S$0.9m. Administrative expenses were S$4.1m and other expenses S$2.6m. Profit before tax was S$10.3m and the tax charge S$2.3m, of which S$2.1m was current tax and S$0.2m a prior-year adjustment. Operating leverage on a fixed overhead is a real part of why a 75.8% revenue increase produced a more than threefold increase in profit.
The working-capital series is the counterweight. Project working capital — contract assets plus current trade and other receivables less trade and other payables — ran 22.1% of revenue in FY2022, fell to 7.7% by FY2024, and is back to 15.5%. In absolute terms it was S$5.2m at the FY2024 trough and S$20.1m at 30 June 2026. Every point of that ratio is roughly S$1.3m of cash at FY2026 revenue. That is the arithmetic that connects the two panels of the chart above: the margin improvement since the FY2023 low is worth about S$3.7m of annual gross profit at FY2026 revenue, and the working-capital build of the last two years absorbed about four times that.
Funding: short-dated, secured, and undisclosed at the edges
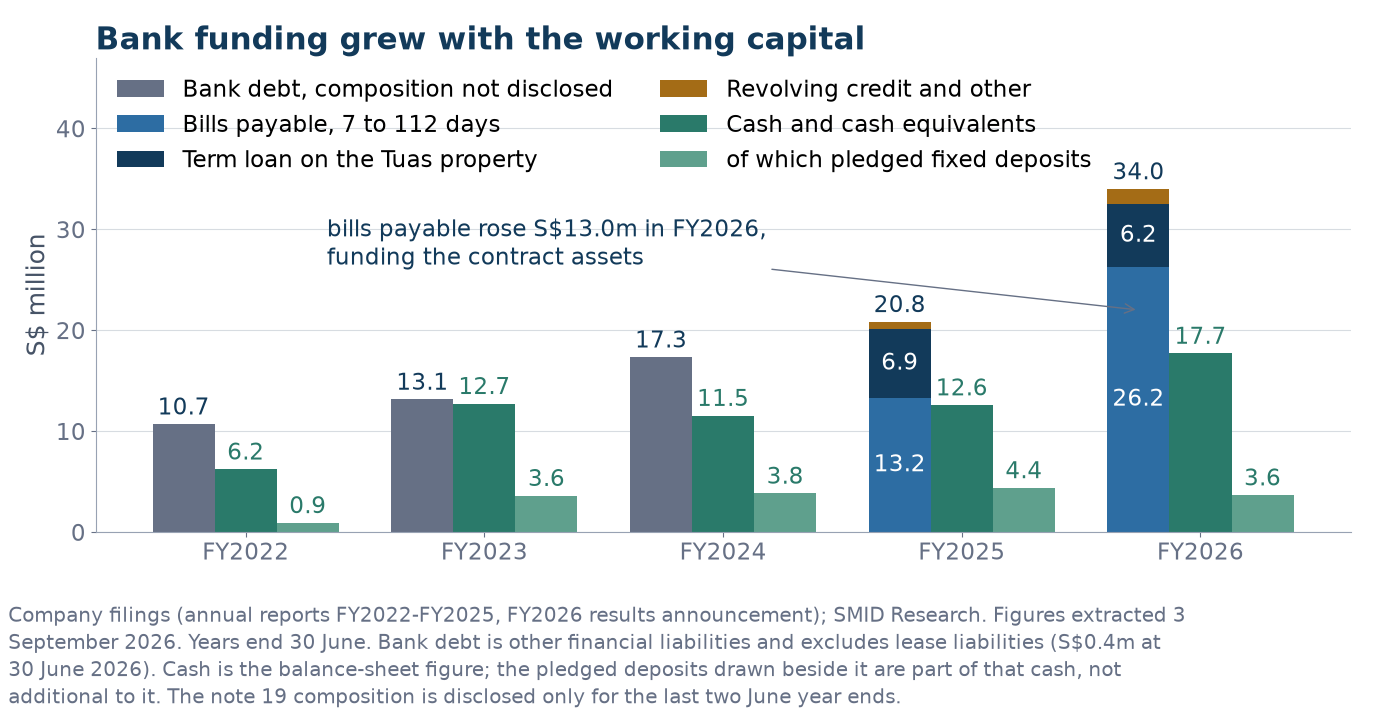
The funding grew where the working capital did. Other financial liabilities against balance-sheet cash and the pledged fixed deposits inside it, S$m. The note 19 composition is disclosed only for the last two June year ends. Source: annual reports FY2022–FY2025 and the FY2026 results announcement.
At 30 June 2026 the group carried S$34.0m of other financial liabilities against S$17.7m of balance-sheet cash, of which S$3.6m was pledged as security for bank facilities and is not freely available. Adding S$0.4m of lease liabilities gives gross debt of S$34.4m and net debt of S$16.7m.
At 30 June, S$m
FY2025
FY2026
What it is
Bills payable
13.2
26.2
Trade bills of 7 to 112 days, floating rate
Term loan on the Tuas property
6.9
6.2
Secured on the JTC leasehold
Revolving credit
0.6
1.5
Secured on leasehold property, drawn at company level
Working-capital term loan
0.1
0.0
Fixed at 2.00%; fully repaid during FY2026
Other financial liabilities
20.8
34.0
Note 19 total
Lease liabilities
0.1
0.4
—
Cash and cash equivalents
12.6
17.7
Balance-sheet figure
of which pledged fixed deposits
4.4
3.6
Security for bank facilities
Net debt
8.3
16.7
Gross debt less balance-sheet cash
Current share of financial liabilities
70.0%
83.7%
Due within twelve months
Gross debt / EBITDA
4.25x
2.82x
Screening ratio; EBITDA adds back the bills interest charged to cost of sales
Interest cover, total-interest basis
4.9x
12.6x
Includes the bills interest reported inside cost of sales
Cash / current financial liabilities
0.86x
0.62x
Short-duration funding exposure
Sources: FY2026 results announcement note 19 and the FY2025 audited annual report. EBITDA including bills interest was S$4.9m in FY2025 and S$12.2m in FY2026. Ratios are group screening computations from the stated figures; they are not covenant calculations, and the covenant definitions the lenders actually use are not disclosed.
The shape matters more than the level. This is not a leveraged balance sheet by the coverage ratios — interest cover on the total-interest basis improved from 4.9 times to 12.6 times, and gross debt to EBITDA fell from 4.25 times to 2.82 times as earnings grew faster than the debt. It is a balance sheet with a duration problem. S$26.2m of the S$34.0m is bills payable with tenors of 7 to 112 days, floating rate; the FY2025 annual report puts the rate range on those bills at 3.37% to 5.30%. Cash covers 0.62 times the current financial liabilities, down from 0.86 times. The business is funded by a facility that has to be rolled every few weeks against certified work, and the size of that facility is not public.
Two disclosures make that dependency concrete. First, all the disclosed bank borrowings are secured — over the Tuas property, over S$3.6m of pledged deposits, and with personal guarantees from directors. Second, during FY2025 the working-capital term loan breached the gearing covenant in the operating subsidiary’s facility letter, which required a gearing ratio below 1.5. The lender made no demand for accelerated repayment and agreed before the year end to waive the requirement; the loan was fully repaid during FY2026. It is a resolved event, and it is the only covenant threshold the public record contains.
The FY2025 annual report gives the only maturity profile on file, on an undiscounted contractual basis: S$14.9m of other financial liabilities falling due within one year, S$3.7m in two to five years and S$3.5m beyond five years, S$22.0m in total. No equivalent profile has been published for FY2026, and the annual report is where it would appear.
Interest is split across two lines and is easy to under-count. FY2026 bank loan interest was S$0.3m and lease interest was negligible, both in finance costs; a further S$0.6m of bills-payable interest was charged inside cost of sales, where it reduces gross margin instead of appearing below it. Total borrowing interest was S$0.9m. Any coverage ratio built from the finance-costs line alone overstates cover by roughly a factor of three.
Evidence boundary. Facility limits, committed and undrawn capacity, current covenant definitions and headroom, the review dates on the bills lines, which directors give which guarantees, and the FY2026 maturity ladder are all absent from the public record. Unknown headroom is not zero headroom; it is unknown, and the FY2026 annual report is the document that would close it.
Ownership, governance and where the capital is going
Lincotrade is closely held. The last full register on file is dated 16 September 2025, in the FY2025 annual report, against 172,027,726 shares then in issue.
Holder at 16 September 2025
Shares
Share of issued capital
Tan Jit Meng, co-founder
45,454,545
26.42%
Soh Loong Chow Jackie, co-founder
45,454,545
26.42%
Wee Henry, direct
24,411,499
14.19%
Wee Henry, deemed
15,399,000
8.95%
Tan Chee Khoon
23,520,518
13.67%
Moomoo Financial Singapore, nominee
9,941,618
5.78%
Citibank Nominees Singapore
9,864,000
5.73%
Nomura Singapore
6,859,000
3.99%
The register has moved since. Tan Chee Khoon held 30,376,450 shares after a market purchase on 23 July 2026; Wee Henry held 39,810,499 direct and deemed on 8 July 2026; on 31 August 2026 the chief executive, Soh Loong Chow Jackie, acquired 83,300 shares at S$0.33246, taking him to 45,537,845, and Tan Kok Heng acquired 30,000 shares, taking him to 245,800. The share count itself changed twice in the year: 182,027,726 shares were in issue at 30 June 2026 with 271,600 in treasury, leaving 181,756,126 outstanding; by 28 August 2026 treasury holdings had risen to 1,136,000 and shares outstanding were 180,891,726. On those figures the estimated free float is about 10.8% of the company, or roughly S$6m of stock at the market price. That estimate treats the two nominee blocks as float and is arithmetic on the register, not a disclosed figure.
Capital has moved in four directions since listing. One placement. On 2 December 2025 the group issued 10,000,000 new shares at S$0.22 — a 3.14% premium to the S$0.2133 volume-weighted average price of 24 November 2025 — to Lion Global Investors as investment manager, ICH Synergrowth Fund and Ginko-AGT Global Growth Fund, with SAC Capital as placement agent. Net proceeds of S$2.107m, after S$91,000 of costs, were applied in full to repaying trade facilities, as confirmed in the use-of-proceeds announcement of 8 January 2026. A placement struck at a premium, taken by institutions, and used to pay down working-capital debt is a materially different event from a discounted issue to unnamed subscribers, and the distinction is worth preserving. Share buy-backs. The first purchase under the 2025 mandate was 154,700 shares at S$0.26 to S$0.27 on 25 March 2026; a further 1,900 shares were bought at S$0.325 on 10 July 2026. Dividends. The policy adopted on 14 February 2024 is to distribute not less than 20% of consolidated profit attributable to owners, excluding non-recurring, one-off and exceptional income; on 30 January 2026 the board announced a floor of not less than 40% for FY2026 only. FY2026 dividends of 1.78 cents represent a 40.1% payout and cost S$3.230m in aggregate, of which the proposed final of 0.90 cents is S$1.628m on 180,891,726 shares. Neither policy is a legally binding commitment, and the 40% floor was for one year. A share plan. The Lincotrade Performance Share Plan 2025, approved on 30 October 2025, caps the aggregate of all share-based schemes at 15% of issued shares excluding treasury, with controlling shareholders and their associates capped at 25% of that pool in aggregate and 10% each. No awards had vested by 30 June 2026 and no shares were under option.
The board changed three times in nine months. On 17 November 2025 co-founder Soh Loong Chow Jackie, then 58, became an executive director and chief executive; co-founder Tan Jit Meng, 61, left the board while remaining managing director of the operating subsidiary; Tan Chee Khoon became chief operating officer. On 1 May 2026 Dr Tan Kok Heng, 62, was re-designated from independent non-executive chairman to executive chairman with a stated remit covering capital deployment, joint-venture partnerships and asset management; Kwong Choong Kuen became lead independent director and the board committees ran temporarily with two members each. On 16 July 2026 two new independent directors joined, Tan Keng Keat and Faye Chong Wen Qi. For context on the chairman’s re-designation, the FY2025 annual report discloses that Dr Tan Kok Heng received total remuneration of S$61,400 under a three-month agreement, of which 36.6% (about S$22,472 from the rounded percentage) was consultancy fees relating to Malaysian property development while he was still the independent chairman. Reported FY2025 remuneration for Tan Jit Meng was S$473,604, and the three key management personnel together received approximately S$1.1m.
The executive chairman’s remit is not abstract. Two commitments outside the fit-out business are already on the balance sheet or in the announcements. Linc Venture Land Sdn Bhd is a 30% associate acquired for RM300,000 of equity plus RM9.7m of 3% cumulative redeemable non-convertible preference shares subscribed over 14 months from January 2025. Its project is The Shang Residence, 449 freehold units in Kuchai Lama, Kuala Lumpur, soft-launched on 28 February 2026 with an official launch expected in the second half of 2026 and completion targeted for 2029. At 30 June 2026 the group carried S$3.039m of preference-share cost and S$0.092m of equity cost against a cumulative share of losses of S$0.281m, and the cumulative preference dividend of about RM204,000 — S$65,000 — was undeclared and unpaid. Linc-A Pte Ltd is a 50%-owned company incorporated on 21 April 2026 with capital raised to S$200,000, which signed a non-binding term sheet on 28 April 2026 to acquire the whole of Opto-Pharm Pte Ltd, a manufacturer of ophthalmic pharmaceutical solutions, from Mr Khoo Min. The discussions were still open at 28 August 2026 and no price has been disclosed. Neither commitment is large against the group balance sheet today. Both are outside the business the company is qualified to do, and both are calls on the same cash that funds contract assets.
One legal matter closed during the period. On 20 December 2024 Ternary Centennial Pte Ltd demanded 5% of the operating subsidiary’s enlarged share capital, or S$1,806,500, under a business-introduction agreement dated 1 April 2021; the board rejected the allegation, a statement of claim was served on 18 March 2025, and a notice of discontinuance of all actions was filed on 1 July 2025. No proceedings were outstanding at the cut-off.
Two disclosed relationships belong in the record without further comment. SAC Capital is the group’s continuing sponsor on Catalist and acted as placement agent for the December 2025 placement. Research on the company published by its sponsor, and by other houses, is not summarised on this page. Third-party price targets are not reproduced here.
The share price and what came with its moves
Over the window Lincotrade & Associates returned +24.5% on a dividend-adjusted basis; the Straits Times Index returned +77.1% and the median of the 3 listed comparisons +204.6%.
Click a quarter — on the chart or in the return strip under it — to read its filings beside its large moves.
Key: Lincotrade & Associates (BFT) as a solid line; Straits Times Index rebased, dashed; peer median rebased, dotted; the benchmark runs off scale from Oct 25 and is clipped there; the peer median runs off scale from May 24 and is clipped there; filing ticks above the axis; ex-dividend ticks on it; numbered pins are moves with a written note; plain dots are other detected moves.
For most of this window Lincotrade barely traded: of the 33 detected moves, eleven were set by sessions of 4,000 shares or fewer and four by prints of 100 or 200 shares. A close struck on 100 shares is a single trade, not a repricing, and the move percentages on this page should be read that way until volume arrives in late 2025.
Key moves
The five largest moves over a day or up to two weeks, with no day counted twice.
Each move is shown next to the market over the same days (and peers, where shown). News listed with a move was published within its dates; that does not mean the news caused the move. The quarter view has all the news.
Index: Straits Times Index. Peers: the median of four listed companies used as a sector check; the notes name them and their limits.
Q3 2023
4 Sep 2023 – 29 Sep 2023 (part quarter)
BFT +0.0%STI −0.7%Peer median −2.3%Range S$0.29–S$0.29Close S$0.29
The company announced the retirement of Mr Lu King Seng as an independent director on the conclusion of the forthcoming annual general meeting. No successor was named in the announcement.
Q4 2023
2 Oct 2023 – 29 Dec 2023
BFT −31.4%STI +0.7%Peer median +2.4%Range S$0.08–S$0.29Close S$0.20
The two contracts cover office space in Singapore, one for a local developer and one for a customer in the aviation sector, with durations of between four and 18 months and completion expected by the end of FY2024 and FY2025 respectively. The company said the order book would generally be fulfilled within two years, and that the two contracts were not expected to have a material impact on earnings per share or net tangible assets per share for the financial year ending 30 June 2024. The same release recorded the group's first exhibition in Saudi Arabia, held in Riyadh from 10 to 12 September 2023.
Guidance: The company said the strengthened order book gave visibility over the next few years and that it would continue to pursue new projects in Singapore while exploring overseas opportunities.Same session: BFT +0.0% · STI +0.3% · peers +0.0%
Large price moves
121 Nov 2023 · −72% · index −1% · peers 0%
223 Nov 2023 · +116% · index 0% · peers 0%
3week to 24 Nov 2023 · −39% · index −1% · peers +3%
Q1 2024
2 Jan 2024 – 28 Mar 2024
BFT −0.1%STI −0.5%Peer median +5.6%Range S$0.10–S$0.20Close S$0.20
Lincotrade & Associates Pte Ltd received a letter of award dated 5 January 2024 from JTC Corporation on 15 January 2024. The property is a two-storey factory with a land area of about 6,498.50 square metres and a gross floor area of about 5,490.41 square metres. A tender deposit of S$480,000 had been paid, with S$478,999.90 due by 29 January 2024 and the balance of S$8,630,999.10 before the commencement date. The company said it intended to relocate its operations and dormitories from 39 Sungei Kadut Loop, whose lease was due to expire on 28 February 2025, and that temporary workers' dormitories could be considered on the site for up to three years subject to approvals.
The appointment took the board to four: Dr Tan Kok Heng as independent and non-executive chairman, Mr Tan Jit Meng as managing director, Mr Kwong Choong Kuen and Mr Wee Shuo Siong Milton. Mr Kwong also joined the nominating and remuneration committees.
The policy excludes non-recurring, one-off and exceptional income. The board retains discretion over the frequency and form of payments and may review, amend or cancel the policy. The company said the policy is not a forecast of future results and does not constitute a legally binding commitment on future dividends.
Gross profit rose 5.2% to about S$4.5 million and the gross margin edged up from 10.5% to 10.6%. The prior-year loss carried about S$10.8 million of one-off non-cash reverse-takeover expenses; on the company's adjusted basis, profit before tax rose 24.2% from S$1.7 million. Commercial revenue rose 29.3% and residential revenue 48.0%, taking the commercial share of group revenue from 67.0% in 6M2023 to 82.9%. Net asset value per share was 6.14 Singapore cents. The group generated about S$4.6 million of operating cash flow and held about S$15.7 million of cash at 31 December 2023, with an order book of about S$47.0 million.
Guidance: Citing the Building and Construction Authority's projection of S$32 billion to S$38 billion of total construction demand in 2024, the company said it expected demand for its interior fitting-out services to remain positive, while expecting construction, labour and other operating costs to keep rising. The order book of about S$47.0 million was said to be generally fulfilled over the next two years.Same session: BFT +0.0% · STI −0.1% · peers −0.5%
Large price moves
426 Feb 2024 · −50% · index 0% · peers 0%
5week to 1 Mar 2024 · −42% · index −2% · peers 0%
68 Mar 2024 · +70% · index 0% · peers 0%
Q2 2024
1 Apr 2024 – 28 Jun 2024
BFT −5.6%STI +3.4%Peer median +35.7%Range S$0.12–S$0.20Close S$0.18
Large price moves
7week to 19 Apr 2024 · +51% · index −1% · peers +2%
Q3 2024
1 Jul 2024 – 30 Sep 2024
BFT −3.3%STI +7.6%Peer median +3.0%Range S$0.10–S$0.18Close S$0.18
Gross profit rose 8.6% to about S$7.9 million and the gross margin improved to 11.6% from 10.4%. Commercial revenue rose 16.3% to about S$56.3 million and residential revenue 27.5% to about S$4.3 million, while showflats revenue fell 60.1% to about S$7.2 million as the larger showflat projects were substantially completed in FY2023. Profit before tax was S$2.8 million against a S$8.0 million loss in FY2023, which had carried the one-off reverse-takeover expenses. Net asset value per share was 6.05 Singapore cents. The total dividend of 0.70 cents represents a payout of about 52.6% of net profit attributable to shareholders, above the 20% floor in the policy adopted in February 2024. The order book stood at about S$39.5 million at 30 June 2024.
Guidance: The company said it intended to relocate its operations and dormitories to the JTC factory in the first quarter of 2025, with additions and alterations works of about S$1.8 million expected to be undertaken during FY2025, and that it would continue to tender for larger projects in Singapore.Same session: BFT +0.0% · STI −0.2% · peers +0.0%
The Malaysian subsidiary, Lincotrade & Associates (Malaysia) Sdn Bhd, will supply, deliver and install a fire-rated drywall system and gypsum board wall cladding for an infrastructure development in Johor. The works were targeted for completion by the first quarter of 2025. It is the group's first commercial project in Malaysia since the subsidiary was set up in August 2023.
Same session: BFT +0.0% · STI +0.5% · peers −0.9%
Large price moves
822 Jul 2024 · −47% · index 0% · peers −2%
9week to 26 Jul 2024 · −47% · index −1% · peers −5%
1020 Sep 2024 · +68% · index 0% · peers 0%
Q4 2024
1 Oct 2024 – 31 Dec 2024
BFT +19.8%STI +5.6%Peer median +4.9%Range S$0.10–S$0.21Close S$0.21
The order book compares with about S$39.5 million at 30 June 2024 and, the company said, will generally be fulfilled within two years. The new work includes the Johor sub-contract announced in September 2024.
Same session: BFT +12.9% · STI +0.5% · peers −0.4%
The company said its subsidiary, Lincotrade & Associates Pte Ltd, received the notice on 20 December 2024 through the claimant's legal advisers, under a 1 April 2021 letter of engagement for business introduction services entitling the claimant to compensation equal to 5% of the subsidiary's enlarged share capital on a successful business combination. The company said it has no agreement with the claimant, that all business introduction services have been fully paid for and that there is no basis for any further payment.
Lincotrade & Associates Pte Ltd received an offer for extension of stay dated 19 December 2024 from JTC Corporation and accepted it on 31 December 2024. The company said the extension gives the group time to undertake the proposed additions and alterations works at the Tuas factory, which will become its main base of operations, and that it was still waiting for the authorities to complete their review of that submission.
Same session: BFT +0.0% · STI −0.2% · peers +0.0%
Large price moves
113 Oct 2024 · −43% · index 0% · peers 0%
12week to 4 Oct 2024 · −43% · index 0% · peers 0%
Q1 2025
2 Jan 2025 – 28 Mar 2025
BFT −50.0%STI +4.9%Peer median +30.5%Range S$0.07–S$0.20Close S$0.10
Lincotrade Capital Pte. Ltd. entered into a shareholders' agreement on 8 January 2025 for 30% of Linc Venture, a Malaysian company incorporated on 11 November 2024 whose principal activities are property development and investment holding. The remaining 70% is held by six individuals, the largest being Mr Tee Kai Loon with 35%, the managing director, co-founder and sole shareholder of Malacca property developer Shang Height Realty Sdn. Bhd. Lincotrade Capital will also subscribe for 9.7 million redeemable non-convertible cumulative preference shares for RM9.7 million over a period of 14 months from January 2025.
Gross profit fell to S$4.1 million from S$4.5 million and profit before tax to S$1.0 million from S$2.2 million. Commercial revenue fell to S$28.9 million from S$35.4 million, residential to S$1.7 million from S$2.2 million and showflats to S$3.1 million from S$5.1 million. No interim dividend was recommended: the board said it wished to take the full-year result into consideration in view of the group's current capital requirements, having paid a maiden interim dividend of 0.38 Singapore cents for the year-earlier half.
Guidance: Citing the Building and Construction Authority's projection of S$47 billion to S$53 billion of total construction demand in 2025, the company said it expected demand for its services to remain positive and noted that its Malaysian subsidiary had secured more than RM10 million of contracts during the half. It expected construction, labour and other operating costs to continue rising. The order book of about S$53.9 million at 31 December 2024 was said to be generally fulfilled over the next two years.Same session: BFT +0.0% · STI +0.2% · peers −0.3%
The claim follows the December 2024 notice. It asks for an order that Lincotrade & Associates Pte Ltd transfer the entitled shares, or damages assessed on their value as at the formal request of 4 November 2024, together with damages for foregone dividends, interest and indemnity costs. The company repeated its view that there is no basis for the allegation.
Same session: BFT +0.0% · STI +0.3% · peers +2.0%
Large price moves
132 Jan 2025 · −14% · index 0% · peers −2%
147 Jan 2025 · +14% · index 0% · peers 0%
1520 Jan 2025 · −56% · index 0% · peers 0%
16week to 24 Jan 2025 · −56% · index 0% · peers +2%
1720 Mar 2025 · −27% · index +1% · peers 0%
1826 Mar 2025 · +40% · index 0% · peers 0%
Q2 2025
1 Apr 2025 – 30 Jun 2025
BFT −40.0%STI −0.2%Peer median +4.6%Range S$0.06–S$0.11Close S$0.06
The dormitory forms part of the additions and alterations works at 5 Tuas Avenue 12, targeted for completion by the last quarter of 2025; solar panels are also to be installed. Separately, the group secured new projects worth about S$42.0 million between January and March 2025, lifting the order book from about S$53.9 million at 31 December 2024 to about S$81.0 million, which the company said would generally be fulfilled within two years.
Same session: BFT +0.0% · STI +0.1% · peers −0.3%
Large price moves
199 May 2025 · −33% · index +1% · peers 0%
2016 May 2025 · +32% · index 0% · peers 0%
2116 Jun 2025 · +40% · index 0% · peers 0%
2226 Jun 2025 · −34% · index 0% · peers 0%
Q3 2025
1 Jul 2025 – 30 Sep 2025
BFT +68.3%STI +8.5%Peer median +24.0%Range S$0.06–S$0.11Close S$0.11
The company said no legal action had been commenced against the company itself and that, as at the date of the announcement, the group was not subject to any ongoing legal proceedings relating to the allegation. It added that the discontinuance was not expected to have any material impact on net tangible assets per share or earnings per share for the financial year ending 30 June 2026.
The company said the change was for commercial reasons. RHB confirmed it was not aware of any non-compliance with the Catalist Rules that had not been brought to SAC's attention.
Gross profit rose 17.3% to S$9.2 million and the gross margin to 12.5%. Commercial revenue rose 17.3% to S$66.1 million, while residential revenue fell 18.3% to S$3.5 million and showflats revenue 44.3% to S$4.0 million. Net asset value per share was 7.21 Singapore cents. The order book rose 74.4% to S$68.9 million at 30 June 2025 from S$39.5 million a year earlier, of which 89.6% was commercial work. The final dividend represents a payout of about 44% of profit attributable to owners. The company attributed the higher cost base to its new subsidiaries in Singapore and overseas.
Guidance: The company said it expected demand for its interior fitting-out services in the financial year ending 30 June 2026 to remain positive on the Building and Construction Authority's projection of S$47 billion to S$53 billion of construction demand in 2025, while expecting costs to continue rising. It said the additions and alterations works at the Tuas factory, including the 204-bed dormitory, were progressing as planned and targeted for completion by the last quarter of 2025.Same session: BFT +9.3% · STI +0.4% · peers +1.5%
Large price moves
2315 Sep 2025 · +17% · index 0% · peers +1%
Q4 2025
1 Oct 2025 – 31 Dec 2025
BFT +101.2%STI +8.0%Peer median +8.3%Range S$0.10–S$0.23Close S$0.20
The board described the change as part of the group's leadership renewal, with the nominating committee and the board approving the re-designation of Mr Soh, a co-founder, from his previous position.
Next session (18 Nov): BFT +0.0% · STI −0.9% · peers −1.5%
The comparison is S$56.0 million at 30 September 2024. All of the newly secured projects are commercial projects in Singapore and are expected to be completed over the next two years. The company said that, barring unforeseen circumstances, they are expected to contribute positively to the group's financial results over the duration of the contracts.
The company entered into a placement agreement with SAC Capital Private Limited on 24 November 2025. The placement is not underwritten and is being made on a best-endeavours basis as an exempt offering under section 272B of the Securities and Futures Act 2001, so no prospectus or offer information statement was issued. Trading was halted before the open that day and the halt was lifted the same evening.
The company said subscribers included Lion Global Investors Limited, as investment manager for and on behalf of its clients, ICH Synergrowth Fund and Ginko-AGT Global Growth Fund, and that the net proceeds were to be used for working capital. SAC Capital Private Limited acted as placement agent.
The offer for extension of stay was dated 20 November 2025 and accepted on 24 November 2025. The company said it was still waiting for the authorities to inspect and approve the additions and alterations works at the Tuas factory.
Large price moves
2428 Oct 2025 · +21% · index 0% · peers −2%
256 Nov 2025 · +13% · index +2% · peers 0%
2612 Nov 2025 · +22% · index +1% · peers 0%
Q1 2026
2 Jan 2026 – 31 Mar 2026
BFT +48.4%STI +5.1%Peer median +1.5%Range S$0.19–S$0.34Close S$0.29
Expenses of about S$91,000 were deducted from the S$2.2 million gross. The company said the proceeds were used to repay trade facilities that had been drawn to pay suppliers and subcontractors, in line with the intended use disclosed in the placement announcements.
The company attributed the expected improvement mainly to the execution of ongoing projects from a higher outstanding order book, in line with its 17 November 2025 announcement. It said the figures were a preliminary assessment that had not been finalised by the board or reviewed by the external auditors, and that results would be released on or before 14 February 2026.
Guidance: The company said the results for the six months to 31 December 2025 would be released on or before 14 February 2026.Same session: BFT +0.0% · STI −0.5% · peers +1.2%
The commitment covers interim dividends if any, excludes non-recurring, one-off and exceptional income, and is subject to the group's cash flow, working capital, financial performance and market conditions. The company said the 20% policy announced on 14 February 2024 remains in force for all other financial periods.
Gross profit rose 94.0% to S$8.0 million and profit before tax 386.2% to S$4.7 million. Commercial revenue rose 66.0% to S$47.9 million and residential revenue 166.0% to S$4.7 million, while showflats revenue fell to S$0.7 million from S$3.1 million, which the company attributed mainly to higher market competition. The half-year profit attributable to owners of S$3.9 million exceeded the S$2.6 million reported for the whole of FY2025. The order book reached a record S$117.2 million at 31 December 2025. The interim dividend represents a payout of about 41% of profit attributable to owners for the half.
Guidance: The company said it expected demand for its interior fitting-out services in 2026 to remain positive on the Building and Construction Authority's projection of S$47 billion to S$53 billion of construction demand, while management was mindful of rising construction, labour and other operating costs. The S$117.2 million order book was said to be generally fulfilled over the next two years. It said it was awaiting approval for the temporary occupation permit at the Tuas factory.Same session: BFT +16.0% · STI −1.6% · peers +1.7%
The site at 5 Tuas Avenue 12 was tendered for S$9.6 million in January 2024 on a 20-year tenure from 26 March 2024, with a land area of about 6,498.50 square metres and an original gross floor area of about 5,490.41 square metres. Solar panels are to be installed. The company said the expanded dormitory would save recurring accommodation costs for its workers and that the un-utilised beds offered the potential for a recurring income stream.
The soft launch ceremony was held on 28 February 2026. The company said the official launch was then expected by June 2026 and the project expected to be completed by 2029. Lincotrade holds 30% of Linc Venture Land Sdn. Bhd.
The purchase is the first reported under the mandate whose start date is given as 30 October 2025, which authorises a maximum of 17,202,772 shares. Cumulative purchases to date were 154,700 shares, or 0.09% of the issued share capital.
Large price moves
2719 Jan 2026 · +13% · index 0% · peers 0%
2827 Jan 2026 · +21% · index +1% · peers −1%
2913 Feb 2026 · +16% · index −2% · peers +2%
3016 Feb 2026 · +19% · index 0% · peers 0%
Q2 2026
1 Apr 2026 – 30 Jun 2026
BFT +3.4%STI +5.8%Peer median +1.3%Range S$0.29–S$0.35Close S$0.30
Lincotrade Capital Pte. Ltd. holds 50% of the S$10 issued capital. Clear Bright Sky Holdings Pte. Ltd., wholly owned by Andre Soh Yu Xian, the son of chief executive and controlling shareholder Soh Loong Chow Jackie, holds 30%, and Wee Henry, a controlling shareholder, holds 20%.
The term sheet was entered into on 28 April 2026 and is subject to contract; no party is obliged to complete until definitive agreements including a sale and purchase agreement are executed, except for the exclusivity period and the payment and refund of the deposit. The target is a Singapore-incorporated company registered at 13 Tuas Avenue 12 and wholly owned by the vendor.
The contracts were secured between 1 January and 31 March 2026 and include a public sector project with a contract value of S$8.2 million. The order book compares with S$81.0 million at 31 March 2025. The company said data centre projects remain part of the outstanding order book, reflecting its participation in the sector since 2016, and that the new Tuas facility is expected to enhance operational efficiency with dormitory operations creating additional recurring income opportunities.
Same session: BFT −3.1% · STI +1.0% · peers −0.3%
Large price moves
3113 May 2026 · +13% · index +1% · peers +1%
329 Jun 2026 · +16% · index +1% · peers 0%
3310 Jun 2026 · −10% · index −1% · peers 0%
Q3 2026
1 Jul 2026 – 3 Sep 2026 (part quarter)
BFT +6.6%STI +10.9%Peer median −10.5%Range S$0.30–S$0.39Close S$0.33
Mr Tan joined the audit and remuneration committees; Ms Chong was appointed chairperson of the nominating committee. Mr Kwong Choong Kuen was appointed chairman of the remuneration committee on the same date.
The contract, for additions and alterations and office fit-out works at an educational institution in Singapore, commenced on 1 August 2026 and runs for about 54 months. It exceeds the group's previous record contract of S$35.0 million awarded in January 2023. The company also reported S$42.7 million of new contracts secured between 1 April and 30 June 2026, the majority commercial projects in Singapore expected to be completed over the next two years. It said that, barring unforeseen circumstances, the new contracts are expected to strengthen the order book and contribute positively to financial performance over the duration of the projects.
The company attributed the expected improvement mainly to the execution of ongoing projects from a higher outstanding order book, in line with its 29 May 2026 announcement, and said the assessment was preliminary and had not been finalised by the board or reviewed by the external auditors.
Guidance: The company said the FY2026 results would be released on or before 29 August 2026.Same session: BFT −2.6% · STI −0.0% · peers −2.9%
Gross profit rose 87.1% to S$17.3 million and profit before tax 243.7% to S$10.3 million. Commercial revenue rose 84.0% to S$121.6 million and residential revenue 91.6% to S$6.8 million, while showflats revenue fell 72.3% to S$1.1 million. The order book stood at S$106.2 million at 30 June 2026, before the S$70.0 million contract secured in July 2026. The total dividend of 1.78 Singapore cents represents a payout of 40% of profit attributable to owners excluding non-recurring, one-off and exceptional income, matching the commitment given in January 2026.
Guidance: The company said it expected demand for its interior fitting-out services in 2026 to remain positive on the Building and Construction Authority's projection of S$47 billion to S$53 billion of construction demand, while management was mindful of rising costs. The S$106.2 million order book was said to be generally fulfilled over the next two years. It said the associate's Kuala Lumpur development was expected to be officially launched in the second half of 2026 with construction targeted for completion by 2029, and repeated that the proposed acquisition of Opto-Pharm remained subject to definitive agreements.Same session: BFT −3.9% · peers +0.8%
Notes and sources
Share price record
How this section was built
The detector flagged 33 large moves in the window — 33 single sessions — before any news was read. All 33 are left over after both controls, unexplained by them. Of those, 3 followed a filing by timestamp, 1 coincided with one in the same session or week and 29 have nothing filed against them beyond routine notices and are recorded as unexplained rather than explained away.
This section records the 36-month price history and puts every large move through two subtractions and reports what is left over, not what caused it: first the Straits Times Index, then the median of the four listed comparisons — ISOTeam, OKP Holdings, BRC Asia and Lum Chang Creations — which trade the same sessions. The Left over column is the session’s return less that peer median; the index column carries the market control beside it.
Each quarter panel pairs two records. Key developments are the filings that carried information — results and profit guidance, order-book and contract announcements, capacity, board, dividend and capital events — with the figures as filed, the guidance the company gave and the close on the day; a filing after the 09:00 open is read against the next session. Large price moves are the threshold-detected sessions, detected before any news was read and dispositioned from the two controls and the enumerated tape; ten rows were written up by hand and carry a numbered pin, the rest are dots on the line.
One caution belongs at the top rather than in a footnote. For most of this window Lincotrade barely traded: of the 33 detected moves, eleven were set by sessions of 4,000 shares or fewer and four by prints of 100 or 200 shares. A close struck on 100 shares is a single trade, not a repricing, and the move percentages on this page should be read that way until volume arrives in late 2025.
How to read the tags.Market-wide and Sector-wide mean the index or the peer median moved with the share over the same session or week; Residual means the move is still large after both are subtracted. A residual is what is left over, not a cause: it does not establish that the company’s own news moved the price, and an unchanged or thinly traded price is not proof that no information arrived. Returns use the dividend-adjusted close; a filing released after the open is read against the next session.
Prices are Yahoo Finance daily closes for BFT.SI over 4 September 2023 to 3 September 2026 (756 sessions); returns and the detection thresholds run on the dividend-adjusted series, so an ex-dividend date is never counted as a move. The filings tape is the issuer's own announcement and publication index, enumerated on 3 September 2026. Where an SGXNet broadcast time was recoverable it is carried; a filing after the 09:00 open is read against the next session, and a filing with no established time is read as an unordered same-session association.
Limitations bound every row above. The filings tape is the issuer’s own announcement and publication index at www.lincotrade.com.sg, enumerated on 3 September 2026 and covering 30 June 2022 to 3 September 2026; the SGX announcements API returned 401 to this build, and the SGX company-announcements page would not load, so the exchange’s own index was not enumerated as a cross-check. That matters most for release times. The issuer index carries a website posting time, not the SGXNet broadcast time: on the eighteen filings in this window whose SGXNet cover page was recoverable, the two differed every time — the 17 November 2025 chief-executive appointment was posted to the website at 13:03 and broadcast at 17:21, and the 30 April 2026 chairman re-designation was posted at 11:44 and broadcast at 18:41. Six of those verified times belong to filings that are entries in this register and are carried there, and two more are the trading-halt notices quoted in the 24 November 2025 entry; the other ten are daily share buy-back notices. For every other development the release time is left blank rather than filled with the website’s posting time, and the entry is read as an unordered same-session association. Where a filing and a session fall on different days the sequence is still established, and the notes say so. Broker notes, block trades, index reviews and trade press were not examined. The 2 March 2026 and 11 June 2026 rows on the issuer’s index are third-party broker research and are not developments filed by the company, so they are not in the register. The peer control is four listed Singapore construction and building-services companies, one of which, Lum Chang Creations, only began trading in July 2025, so the sector control rests on three names for the first two-thirds of the window.
A quarter shows only the columns it has. An empty developments column means: No filings beyond routine disclosures (meeting paperwork, interest notices, record-date notices) this quarter. An empty moves column means: No session cleared the large-move threshold this quarter.
The full move register — every large move and its market and sector controls
Every threshold-detected move in the window — 27 sessions and 6 weekly windows — with its market and sector controls, dispositioned in the price-driver register. Ten rows were written up by hand and carry a numbered pin on the chart; the rest are dispositioned mechanically from the two controls and the enumerated tape, and say so in their own words.
#
Session
BFT
STI
Peers
Left over
Control result
What the evidence supports
1
21 Nov 2023
−71.9%
−0.5%
+0.0%
−71.9%
Residual
The window's largest single-session fall, on a 4,000-share print — 0.1× the median volume of the preceding 60 sessions. Against an index move of −0.5% and a peer median of +0.0%, the whole 71.9% is left over. The recorded close went from 0.285 to 0.08, and back to 0.173 two sessions later (row 2). No filing beyond routine notices in the prior three sessions. On volume this thin the close is a single trade rather than a repricing, and the arithmetic above should be read that way. ISOTeam +0.0% · OKP +0.0% · BRC Asia +0.0%
2
23 Nov 2023
+116.2%
−0.1%
+0.0%
+116.2%
Residual
The reversal of the 21 November print, two sessions later: 0.08 to 0.173 on 17,600 shares, 0.4× median volume, against an index move of −0.1% and an unmoved peer median, so about 116 points are left over. No filing beyond routine notices in the prior three sessions. Taken together the two sessions moved the recorded close from 0.285 to 0.173 on fewer than 22,000 shares. ISOTeam +0.0% · OKP +0.0% · BRC Asia +0.6%
3
24 Nov 2023
−39.3%
−1.0%
+2.5%
−41.8%
Residual
The week to 24 Nov 2023 took the close from 0.285 to 0.173, −39.3% against an index move of −1.0% and a peer median of +2.5%, leaving about 42 points. The week included no filing beyond routine notices. It records the same two prints as rows 1 and 2. ISOTeam +2.5% · OKP +0.0% · BRC Asia +5.4%
4
26 Feb 2024
−49.5%
−0.4%
+0.0%
−49.5%
Residual
Against an index move of −0.4% and a peer median of +0.0%, about 49 points are left over; 4,000 shares, 0.1× median volume, taking the close from 0.198 to 0.1. No filing beyond routine notices in the prior three sessions. ISOTeam +0.0% · OKP −2.0% · BRC Asia +0.0%
5
1 Mar 2024
−41.9%
−1.5%
+0.0%
−41.9%
Residual
The week to 1 March 2024 took the close from 0.198 to 0.115 on 118,000 shares, 3.3× median volume and the heaviest week of the window to that point. The index fell 1.5% and the peer median did not move, leaving about 42 points. The week included no filing beyond routine notices; the 6M2024 results, the dividend policy and the maiden interim dividend of 0.38 Singapore cents had all been filed on 14 February, the week before. ISOTeam +0.0% · OKP +4.1% · BRC Asia −0.5%
6
8 Mar 2024
+69.6%
+0.4%
+0.0%
+69.6%
Residual
Against an index move of +0.4% and a peer median of +0.0%, about 70 points are left over; 3,400 shares, 0.1× median volume, taking the close from 0.115 to 0.195. No filing beyond routine notices in the prior three sessions. ISOTeam +0.0% · OKP −2.0% · BRC Asia +1.1%
7
19 Apr 2024
+50.8%
−1.3%
+1.6%
+49.3%
Residual
The week to 19 Apr 2024 took the close from 0.122 to 0.184, +50.8% against an index move of −1.3% and a peer median of +1.6%, leaving about 49 points. The week included no filing beyond routine notices. The vendor series records no shares traded in the week. ISOTeam +2.4% · OKP −1.9% · BRC Asia +1.5%
8
22 Jul 2024
−46.7%
−0.3%
−1.7%
−45.1%
Residual
Against an index move of −0.3% and a peer median of −1.7%, about 45 points are left over; 10,000 shares, 0.3× median volume, taking the close from 0.184 to 0.098. No filing beyond routine notices in the prior three sessions. ISOTeam −1.7% · OKP −1.5% · BRC Asia −1.7%
9
26 Jul 2024
−46.7%
−0.6%
−4.5%
−42.3%
Residual
The week to 26 Jul 2024 took the close from 0.184 to 0.098, −46.7% against an index move of −0.6% and a peer median of −4.5%, leaving about 42 points. The week included no filing beyond routine notices. It records the same session as row 8. ISOTeam +0.0% · OKP −4.5% · BRC Asia −4.6%
10
20 Sep 2024
+68.4%
−0.2%
+0.0%
+68.4%
Residual
Against an index move of −0.2% and a peer median of +0.0%, about 68 points are left over; 100 shares, 0.0× median volume, taking the close from 0.098 to 0.165. No filing beyond routine notices in the prior three sessions. A 100-share print sets the close without repricing the company. ISOTeam +3.4% · OKP −2.8% · BRC Asia +0.0%
11
3 Oct 2024
−42.7%
−0.2%
+0.0%
−42.7%
Residual
Against an index move of −0.2% and a peer median of +0.0%, about 43 points are left over; 200 shares, 0.0× median volume, taking the close from 0.178 to 0.102. No filing beyond routine notices in the prior three sessions. ISOTeam +1.7% · OKP −1.4% · BRC Asia +0.0%
12
4 Oct 2024
−42.7%
+0.4%
+0.0%
−42.7%
Residual
The week to 4 Oct 2024 took the close from 0.178 to 0.102, −42.7% against an index move of +0.4% and a peer median of +0.0%, leaving about 43 points. The week included no filing beyond routine notices. It records the same 200-share print as row 11. ISOTeam +0.0% · OKP −4.2% · BRC Asia +1.3%
13
2 Jan 2025
−14.3%
+0.3%
−1.5%
−12.8%
Residual
The first session of 2025 fell 14.3% from 0.21 to 0.18 on 900 shares, 0.0× median volume, against an index up 0.3% and a peer median down 1.5%, leaving about 13 points. It is the first session after the company announced, on 31 December 2024, that JTC had extended the lease of its Sungei Kadut premises from 28 February to 31 December 2025. The order of filing and session is established only to the day, and a 900-share close carries little information either way. ISOTeam −1.7% · OKP −1.5% · BRC Asia +2.0%
14
7 Jan 2025
+13.9%
+0.2%
+0.4%
+13.5%
Residual
Against an index move of +0.2% and a peer median of +0.4%, about 13 points are left over; 100 shares, 0.0× median volume, taking the close from 0.18 to 0.205. No filing beyond routine notices in the prior three sessions. A 100-share print sets the close without repricing the company. ISOTeam +1.8% · OKP +0.0% · BRC Asia +0.4%
15
20 Jan 2025
−56.1%
−0.1%
+0.4%
−56.5%
Residual
Against an index move of −0.1% and a peer median of +0.4%, about 56 points are left over; 2,000 shares, 0.1× median volume, taking the close from 0.205 to 0.09. No filing beyond routine notices in the prior three sessions. ISOTeam +0.0% · OKP +3.0% · BRC Asia +0.4%
16
24 Jan 2025
−56.1%
−0.2%
+1.5%
−57.6%
Residual
The week to 24 Jan 2025 took the close from 0.205 to 0.09, −56.1% against an index move of −0.2% and a peer median of +1.5%, leaving about 58 points. The week included no filing beyond routine notices. It records the same 2,000-share print as row 15. ISOTeam +0.0% · OKP +1.5% · BRC Asia +7.4%
17
20 Mar 2025
−26.5%
+0.6%
+0.0%
−26.5%
Residual
The session after the company announced the receipt of a statement of claim seeking 5% of its operating subsidiary’s enlarged share capital, or damages in the alternative: the close fell 26.5% from 0.102 to 0.075 on 52,100 shares, 1.3× median volume. The index rose 0.6% and the peer median did not move, so about 26 points are left over. The claim was discontinued on 1 July 2025. ISOTeam +0.0% · OKP +0.0% · BRC Asia −0.3%
18
26 Mar 2025
+40.0%
+0.2%
+0.0%
+40.0%
Residual
Against an index move of +0.2% and a peer median of +0.0%, about 40 points are left over; 1,800 shares, 0.0× median volume, taking the close from 0.075 to 0.105. No filing beyond routine notices in the prior three sessions. ISOTeam +1.3% · OKP +0.0% · BRC Asia +0.0%
19
9 May 2025
−33.0%
+0.7%
+0.0%
−33.0%
Residual
Against an index move of +0.7% and a peer median of +0.0%, about 33 points are left over; 51,800 shares, 1.3× median volume, taking the close from 0.112 to 0.075. No filing beyond routine notices in the prior three sessions. ISOTeam +0.0% · OKP +0.0% · BRC Asia +0.3%
20
16 May 2025
+32.0%
+0.1%
−0.3%
+32.3%
Residual
Against an index move of +0.1% and a peer median of −0.3%, about 32 points are left over; 19,700 shares, 0.5× median volume, taking the close from 0.075 to 0.099. No filing beyond routine notices in the prior three sessions. ISOTeam +0.0% · OKP −2.2% · BRC Asia −0.3%
21
16 Jun 2025
+39.7%
−0.1%
+0.0%
+39.7%
Residual
Against an index move of −0.1% and a peer median of +0.0%, about 40 points are left over; 24,300 shares, 0.6× median volume, taking the close from 0.068 to 0.095. No filing beyond routine notices in the prior three sessions. ISOTeam +1.4% · OKP −1.2% · BRC Asia +0.0%
22
26 Jun 2025
−33.7%
+0.3%
+0.3%
−34.0%
Residual
Against an index move of +0.3% and a peer median of +0.3%, about 34 points are left over; 34,900 shares, 0.9× median volume, taking the close from 0.095 to 0.063. No filing beyond routine notices in the prior three sessions. ISOTeam +2.8% · OKP +0.0% · BRC Asia +0.3%
23
15 Sep 2025
+16.5%
−0.1%
+0.5%
+16.0%
Residual
Against an index move of −0.1% and a peer median of +0.5%, about 16 points are left over; 2,800 shares, 0.1× median volume, taking the close from 0.085 to 0.099. No filing beyond routine notices in the prior three sessions. The FY2025 results had been filed on 29 August 2025, twelve sessions earlier. ISOTeam +1.1% · OKP +1.8% · BRC Asia −0.2% · Lum Chang Creations −1.7%
24
28 Oct 2025
+21.0%
+0.2%
−2.0%
+23.0%
Residual
Up 21.0% from 0.10 to 0.121 on 98,800 shares, 2.4× median volume, against an index up 0.2% and a peer median down 2.0% — about 23 points left over. Nothing beyond the annual report, the AGM paperwork and the AGM-day dividend notice had been filed; the record order book and the change of chief executive came three weeks later. It is the first of the sessions that took the close from 0.106 at the end of September 2025 to 0.21 at the end of November. ISOTeam −2.4% · OKP −2.0% · BRC Asia −0.7% · Lum Chang Creations −2.0%
25
6 Nov 2025
+12.9%
+1.5%
+0.0%
+12.9%
Residual
Against an index move of +1.5% and a peer median of +0.0%, about 13 points are left over; 45,500 shares, 1.1× median volume, taking the close from 0.14 to 0.158. No filing beyond routine notices in the prior three sessions. ISOTeam +0.0% · OKP +0.0% · BRC Asia −0.7% · Lum Chang Creations +0.0%
26
12 Nov 2025
+22.0%
+0.6%
+0.4%
+21.7%
Residual
646,000 shares and 16.0× median volume, the heaviest session of the window to that date, taking the close up 22.0% from 0.168 to 0.205 against an index up 0.6% and a peer median up 0.4%, leaving about 22 points. No filing beyond routine notices in the prior three sessions; the S$61.0 million of new contracts, the record S$113.0 million order book and the appointment of a new chief executive were announced five sessions later, on 17 November 2025. ISOTeam +0.0% · OKP +1.0% · BRC Asia +0.7% · Lum Chang Creations −1.1%
27
19 Jan 2026
+13.2%
−0.3%
+0.1%
+13.0%
Residual
Against an index move of −0.3% and a peer median of +0.1%, about 13 points are left over; 309,600 shares, 7.6× median volume, taking the close from 0.19 to 0.215. The filings in the preceding week were the placement use-of-proceeds statement of 8 January 2026 and substantial-shareholder interest notices; the tape carries no other material filing in the prior three sessions. ISOTeam −1.2% · OKP +0.0% · BRC Asia +0.2% · Lum Chang Creations +3.2%
28
27 Jan 2026
+20.9%
+1.3%
−1.1%
+22.0%
Residual
Against an index move of +1.3% and a peer median of −1.1%, about 22 points are left over; 100 shares, 0.0× median volume, taking the close from 0.215 to 0.26. No filing beyond routine notices in the prior three sessions. A 100-share print sets the close without repricing the company. ISOTeam −2.3% · OKP −0.7% · BRC Asia +0.0% · Lum Chang Creations −1.4%
29
13 Feb 2026
+16.0%
−1.6%
+1.7%
+14.3%
Residual
The session on which the 6M2026 results and the interim dividend were filed: up 16.0% from 0.25 to 0.29 on 1,634,200 shares, 40.4× median volume, against an index down 1.6% and a peer median up 1.7%, leaving about 14 points. The SGXNet broadcast times of the two filings could not be established for this build, so whether the session traded before or after them is not established. The results reported revenue up 58.2% to S$53.3 million, profit attributable to owners up 438.5% to S$3.9 million and a record S$117.2 million order book. ISOTeam +5.7% · OKP −2.9% · BRC Asia +0.2% · Lum Chang Creations +3.1%
30
16 Feb 2026
+19.0%
+0.0%
+0.3%
+18.7%
Residual
The first session after the 6M2026 results: up 19.0% from 0.29 to 0.345 on 2,619,500 shares, 64.7× median volume and the heaviest session of the window, against a flat index and a peer median up 0.3%, leaving about 19 points. Over the two sessions of 13 and 16 February the close rose from 0.25 to 0.345 on more than 4.2 million shares. ISOTeam −2.2% · OKP −1.2% · BRC Asia +3.2% · Lum Chang Creations +1.8%
31
13 May 2026
+12.9%
+1.2%
+1.0%
+11.9%
Residual
Against an index move of +1.2% and a peer median of +1.0%, about 12 points are left over; 155,000 shares, 3.8× median volume, taking the close from 0.31 to 0.35. No filing beyond routine notices in the prior three sessions. The only filing in the preceding week was a director's interest notice. ISOTeam +0.0% · OKP +0.0% · BRC Asia +2.0% · Lum Chang Creations +1.9%
32
9 Jun 2026
+15.5%
+1.2%
+0.2%
+15.3%
Residual
Up 15.5% from 0.29 to 0.335 on 191,800 shares, 4.7× median volume, against an index up 1.2% and a peer median up 0.2%, leaving about 15 points. No filing beyond routine notices in the prior three sessions; the S$16.8 million of third-quarter contracts and the S$107.0 million order book had been announced seven sessions earlier, on 29 May 2026. The following session gave back 10.4% (row 33). ISOTeam +4.0% · OKP −0.6% · BRC Asia +0.5% · Lum Chang Creations +0.0%
33
10 Jun 2026
−10.4%
−1.3%
+0.3%
−10.8%
Residual
Against an index move of −1.3% and a peer median of +0.3%, about 11 points are left over; 67,000 shares, 1.7× median volume, taking the close from 0.335 to 0.3. No filing beyond routine notices in the prior three sessions. It gives back most of the previous session's rise (row 32). ISOTeam +0.0% · OKP −1.3% · BRC Asia +0.7% · Lum Chang Creations +1.9%
Key developments: sources, timing and notes
15 Sep 2023 · Independent director Lu King Seng to retire at the annual general meeting to be held on or around 25 October 2023.BoardSource: SGXNet announcement, 15 Sep 2023
17 Oct 2023 · Two interior fitting-out contracts worth about S$28.1 million lift the order book to about S$70.0 million as at 30 September 2023.ContractReaction (same session, order not established): BFT +0.0% · STI +0.3% · peers +0.0%Source: Press release, 17 Oct 2023
16 Jan 2024 · Successful tender for a JTC factory at 5 Tuas Avenue 12 at a bid price of S$9,589,999, on a 20-year lease running from 26 March 2024.CapacityReaction (same session, order not established): BFT +0.0% · STI −0.5% · peers +0.0%Source: SGXNet announcement, 16 Jan 2024
14 Feb 2024 · Dividend policy adopted: dividends, including interim dividends, of not less than 20% of consolidated net profit attributable to shareholders.DividendReaction (same session, order not established): BFT +0.0% · STI −0.1% · peers −0.5%Source: SGXNet announcement, 14 Feb 2024
14 Feb 2024 · 6M2024 results: revenue up 4.6% to S$42.7 million and profit before tax of S$2.2 million against a S$9.0 million loss a year earlier, with a maiden interim dividend of 0.38 Singapore cents.ResultsReaction (same session, order not established): BFT +0.0% · STI −0.1% · peers −0.5%Source: Half-year financial statements, 14 Feb 2024 · Press release, 14 Feb 2024
28 Aug 2024 · FY2024 results: revenue down 2.9% to S$67.9 million but net profit of S$2.3 million against a prior-year loss, with a final dividend of 0.32 Singapore cents taking the year's total to 0.70 cents.ResultsReaction (same session, order not established): BFT +0.0% · STI −0.2% · peers +0.0%Source: Full-year financial statements, 28 Aug 2024 · Press release, 28 Aug 2024
3 Sep 2024 · Maiden Malaysian commercial project: sub-contract works in Johor with an initial contract value of about RM2.3 million that could rise to about RM12 million.ContractReaction (same session, order not established): BFT +0.0% · STI +0.5% · peers −0.9%Source: Press release, 3 Sep 2024
4 Nov 2024 · New projects worth about S$31.0 million secured between July and September 2024 take the order book to about S$56.0 million as at 30 September 2024.ContractReaction (same session, order not established): BFT +12.9% · STI +0.5% · peers −0.4% · 1.0× median volumeSource: Press release, 4 Nov 2024
23 Dec 2024 · Notice received from Ternary Centennial Pte. Ltd. demanding 5% of the enlarged share capital, or S$1,806,500 in the alternative.Legal and regulatoryReaction (same session, order not established): BFT +0.0% · STI +0.9% · peers −0.4%Source: SGXNet announcement, 23 Dec 2024
31 Dec 2024 · JTC lease at 39 Sungei Kadut Loop extended from 28 February 2025 to 31 December 2025.CapacityReaction (same session, order not established): BFT +0.0% · STI −0.2% · peers +0.0%Source: SGXNet announcement, 31 Dec 2024
8 Jan 2025 · Subscription for 300,000 shares, or 30%, of Linc Venture Land Sdn. Bhd., alongside RM9.7 million of redeemable preference shares to be taken up over 14 months.AcquisitionReaction (same session, order not established): BFT +0.0% · STI +1.5% · peers +0.8%Source: SGXNet announcement, 8 Jan 2025
13 Feb 2025 · 6M2025 results: revenue down 21.2% to S$33.7 million and profit after tax down to S$0.8 million from S$1.8 million, with the order book at about S$53.9 million.ResultsReaction (same session, order not established): BFT +0.0% · STI +0.2% · peers −0.3%Source: Half-year financial statements, 13 Feb 2025 · Press release, 13 Feb 2025
19 Mar 2025 · Statement of claim received on 18 March 2025 seeking transfer of 5% of the subsidiary's enlarged share capital, or damages in the alternative.Legal and regulatoryReaction (same session, order not established): BFT +0.0% · STI +0.3% · peers +2.0%Source: SGXNet announcement, 19 Mar 2025
23 May 2025 · Approvals obtained for a 204-bed ancillary workers' dormitory at the Tuas factory, and the order book strengthens to about S$81.0 million as at 31 March 2025.CapacityReaction (same session, order not established): BFT +0.0% · STI +0.1% · peers −0.3%Source: Press release, 23 May 2025
1 Jul 2025 · Notice of discontinuance received on 1 July 2025; the claimant has discontinued all actions against the subsidiary.Legal and regulatoryReaction (same session, order not established): BFT +0.0% · STI +0.6% · peers +1.4%Source: SGXNet announcement, 1 Jul 2025
7 Aug 2025 · SAC Capital Private Limited appointed continuing sponsor with effect from 8 August 2025, in place of RHB Bank Berhad.AnnouncementSGXNet broadcast time not established for this filing from the sources reachable for this build; the issuer website's posting time is not the broadcast time, so the entry is read as an unordered same-session association.Source: SGXNet announcement, 7 Aug 2025
29 Aug 2025 · FY2025 results: revenue up 8.5% to S$73.6 million and profit attributable to owners up 11.5% to S$2.6 million, with a final dividend of 0.66 Singapore cents.ResultsReaction (same session, order not established): BFT +9.3% · STI +0.4% · peers +1.5% · 0.0× median volumeSource: Full-year financial statements, 29 Aug 2025 · Press release, 29 Aug 2025
30 Oct 2025 · Record date of 11 November 2025 set for the FY2025 final dividend of S$0.0066 per share, payable on 25 November 2025.DividendSGXNet broadcast time not established for this filing from the sources reachable for this build; the issuer website's posting time is not the broadcast time, so the entry is read as an unordered same-session association.Source: SGXNet announcement, 30 Oct 2025
17 Nov 2025 · Jackie Soh Loong Chow, 58, appointed executive director and chief executive officer with effect from 17 November 2025, as Tan Jit Meng ceases as executive director and managing director.BoardReaction (next session, 18 Nov): BFT +0.0% · STI −0.9% · peers −1.5%Source: SGXNet announcement, appointment, 17 Nov 2025 · SGXNet announcement, cessation, 17 Nov 2025
17 Nov 2025 · New projects worth S$61.0 million secured between July and September 2025 take the order book to a record S$113.0 million as at 30 September 2025.ContractReaction (same session, order not established): BFT +0.0% · STI −0.1% · peers +0.0% · 0.2× median volumeSource: Press release, 17 Nov 2025
24 Nov 2025 · Proposed placement of up to 10,000,000 new shares at S$0.22 each, raising up to S$2.2 million, at a 3.14% premium to the S$0.2133 volume-weighted average price.PlacementReaction (same session, order not established): BFT +0.0% · STI +0.6% · peers +2.0%Source: SGXNet announcement, 24 Nov 2025
3 Dec 2025 · Placement completed: 10,000,000 shares at S$0.22 fully taken up, raising gross proceeds of S$2.2 million.PlacementReaction (same session, order not established): BFT +0.0% · STI +0.4% · peers −0.2% · 1.3× median volumeSource: SGXNet announcement, completion, 3 Dec 2025 · Press release, 3 Dec 2025
26 Dec 2025 · JTC lease at 39 Sungei Kadut Loop extended again, from 31 December 2025 to 31 March 2026.CapacitySGXNet broadcast time not established for this filing from the sources reachable for this build; the issuer website's posting time is not the broadcast time, so the entry is read as an unordered same-session association.Source: SGXNet announcement, 26 Dec 2025
8 Jan 2026 · Placement net proceeds of S$2,109,000 fully utilised for general working capital.AnnouncementSGXNet broadcast time not established for this filing from the sources reachable for this build; the issuer website's posting time is not the broadcast time, so the entry is read as an unordered same-session association.Source: SGXNet announcement, 8 Jan 2026
30 Jan 2026 · Profit guidance: the group expects to report a significant improvement in profit before tax for the six months to 31 December 2025 against the same period a year earlier.ResultsReaction (same session, order not established): BFT +0.0% · STI −0.5% · peers +1.2% · 3.4× median volumeSource: SGXNet announcement, 30 Jan 2026
30 Jan 2026 · Dividends for FY2026 to be not less than 40% of consolidated net profit attributable to shareholders, double the standing 20% policy.DividendReaction (same session, order not established): BFT +0.0% · STI −0.5% · peers +1.2% · 3.4× median volumeSource: SGXNet announcement, 30 Jan 2026
13 Feb 2026 · 6M2026 results: revenue up 58.2% to S$53.3 million and profit attributable to owners up 438.5% to S$3.9 million, with an interim dividend of 0.88 Singapore cents.ResultsReaction (same session, order not established): BFT +16.0% · STI −1.6% · peers +1.7% · 14.9× median volumeSource: Half-year financial statements, 13 Feb 2026 · Press release, 13 Feb 2026
13 Feb 2026 · Record date of 19 March 2026 set for the 6M2026 interim dividend of S$0.0088 per share, payable on 30 March 2026.DividendSGXNet broadcast time not established for this filing from the sources reachable for this build; the issuer website's posting time is not the broadcast time, so the entry is read as an unordered same-session association.Source: SGXNet announcement, 13 Feb 2026
24 Feb 2026 · Temporary occupation permit obtained for the new Tuas headquarters with its 204-bed ancillary workers' dormitory, with gross floor area increased to 6,276.80 square metres.CapacityReaction (same session, order not established): BFT −4.5% · STI −0.4% · peers +1.0% · 1.9× median volumeSource: Press release, 24 Feb 2026
2 Mar 2026 · Associate Linc Venture unveils The Shang Residence, a 449-unit freehold residential project in Kuchai Lama, Kuala Lumpur.Business updateSGXNet broadcast time not established for this filing from the sources reachable for this build; the issuer website's posting time is not the broadcast time, so the entry is read as an unordered same-session association.Source: Press release, 2 Mar 2026
25 Mar 2026 · First daily share buy-back notice: 154,700 shares bought on the market for total consideration of S$41,187.39, held as treasury shares.Buy-backSource: SGXNet announcement, 25 Mar 2026
21 Apr 2026 · Linc-A Pte. Ltd. incorporated as a 50%-owned subsidiary alongside interested persons, for interior fitting-out of assets in the living sector.AnnouncementReaction (same session, order not established): BFT +0.0% · STI +0.2% · peers +1.1% · 0.6× median volumeSource: SGXNet announcement, 21 Apr 2026
28 Apr 2026 · Non-binding term sheet for the 50%-owned Linc-A to acquire 12,000,000 shares, being 100% of Opto-Pharm Pte Ltd, from Mr Khoo Min.AcquisitionReaction (same session, order not established): BFT +4.9% · STI −0.1% · peers −0.5% · 3.1× median volumeSource: SGXNet announcement, 28 Apr 2026
29 May 2026 · Seven new commercial contracts worth S$16.8 million in the March 2026 quarter take the order book to S$107.0 million as at 31 March 2026.ContractReaction (same session, order not established): BFT −3.1% · STI +1.0% · peers −0.3% · 0.2× median volumeSource: Press release, 29 May 2026
3 Aug 2026 · Letter of acceptance received for a contract of about S$70.0 million, the largest single contract in the group's history, on top of S$42.7 million of new contracts in the June 2026 quarter.ContractReaction (same session, order not established): BFT +0.0% · STI −0.3% · peers −0.1% · 8.9× median volumeSource: SGXNet announcement, award of contract, 3 Aug 2026 · Press release, 3 Aug 2026
13 Aug 2026 · Profit guidance: the group expects to report a significant improvement in profit before tax for the financial year ended 30 June 2026 against FY2025.ResultsReaction (same session, order not established): BFT −2.6% · STI −0.0% · peers −2.9% · 3.9× median volumeSource: SGXNet announcement, 13 Aug 2026
28 Aug 2026 · FY2026 results: revenue up 75.8% to S$129.5 million and profit attributable to owners up 215.3% to S$8.1 million, with a final dividend of 0.90 Singapore cents taking the year's total to 1.78 cents.ResultsReaction (same session, order not established): BFT −3.9% · peers +0.8% · 1.3× median volumeSource: Full-year financial statements, 28 Aug 2026 · Press release, 28 Aug 2026
The next public tests
FY2026 annual report, expected October 2026. The audit of the record year, the borrowing note with facility terms and the maturity ladder, note 4E with FY2026 customer concentration, the contract-asset and expected-credit-loss notes, the related-party section and the governance disclosures on the chairman’s remit. This is the single document that closes most of the list above.
The proposed final dividend of 0.90 cents. S$1.628m on 180,891,726 shares, for approval at the annual general meeting and payment thereafter. Watch approval and payment; one distribution is not evidence of recurring cash conversion, particularly in a year when operating cash flow was negative.
The order-book update for 30 September 2026, historically released in mid-November. The first read on intake after the S$70.0m award, and the first chance to see whether the book is growing beyond that one contract.
Half-year results for the six months to 31 December 2026, historically released by mid-February, usually preceded by a profit-guidance announcement in late January. The lines to read are gross margin against the 12.2% second-half exit rate, operating cash flow, contract assets, current receivables and bills payable.
Opto-Pharm. A definitive agreement with disclosed terms and funding, or a lapse. A transaction large enough to require a shareholders’ circular would change the perimeter of the group.
The Shang Residence. The official launch, expected in the second half of 2026 per the March 2026 announcement, take-up, and note 17 at the next reporting date — including whether the preference dividend in arrears is declared.
First grants under the Performance Share Plan 2025. The size of the first tranche against the 15% aggregate cap, and whether the controlling shareholders participate.
What you can watch yourself
Every other test on this page waits for the company to file. These do not. Each row is a series you can look up yourself, free, today — with the level this reading was built against, the levels that would put it in question, and what the series cannot tell you.
BCA's January construction-prospects release; read total construction demand, and the August review that revises it. Building and Construction Authority, Singapore
Last recorded
50 S$bn, 2026-01-22
What the reading assumes
50.5 S$bn (BCA reported actual, 2025)
Watch / alert
47 and 39 S$bn, on a move below — currently between the assumed level and the watch level
How often to look
twice yearly, at the January forecast and the August review (the series prints event)
What it points to. Total construction demand sets the size of the tender pool one to two years ahead of fit-out awards; a smaller pool means fewer and more contested tenders for a contractor whose intake is won project by project.
Direction only — this pack does not carry a coefficient from this series to reported earnings.
What it cannot tell you. Total construction demand is dominated by public civil works, housing and the mega-projects (Changi Terminal 5, Tuas port, MRT lines) that this company does not fit out; the commercial and institutional fit-out pool can shrink while the total rises, and one data-centre or office award moves Lincotrade's intake more than a S$5bn change in national demand does. Lincotrade's share of national demand is about 0.25% and volatile, so the sign of the effect is defensible and the coefficient is not.
Settled by the next quarterly order-book release and the half-year results, due 2026-11-30. Lead time: award to output runs into following years; BCA states the lag but does not quantify it.
Open the latest quarterly order-book press release or the half-year results announcement and read the order book figure in S$ million. Lincotrade & Associates Holdings (SGXNet press releases and results announcements)
Last recorded
106 SGD millions, 2026-06-30
What the reading assumes
68.9 SGD millions (order book at 30 June 2025, the base from which FY2026 revenue of S$129.5m was delivered, 2025-06-30)
Watch / alert
80 and 60 SGD millions, on a move below — currently between the assumed level and the watch level
How often to look
each quarterly order-book release and each results announcement (the series prints quarterly)
What it points to. Revenue over the next two to four quarters is drawn from the book; the book does not reveal margin or the pace at which customers certify work, so the tier is directional.
Direction only — this pack does not carry a coefficient from this series to reported earnings.
What it cannot tell you. The book counts awarded contract value, not certified work: a S$70m contract over 54 months lifts the book by the same amount as five one-year projects but adds only about S$15m a year of revenue, so a rising book can coexist with flat near-term revenue; and the book says nothing about margin, cancellations or slow certification, which is where FY2026's cash went.
Settled by the half-year results: revenue and segment revenue, due 2027-02-14. Lead time: two to four quarters from award to revenue; the S$70m award runs 54 months.
Watchlist reviewed on 2026-09-03; each observation has its own date above. This watchlist date does not change the company research cutoff. A series moving past a level is a reason to re-read the case, not a recommendation. The same series across every company covered: what you can watch.
Notes and sources
What the filings still do not answer
How much of the S$22.4m of contract assets and S$23.5m of current receivables at 30 June 2026 had been certified and collected after the year end, and what bills payable stood at on the same date.
The committed limits, tenor, review dates and covenant definitions of the bills-payable and revolving-credit facilities, the headroom against them, and which directors give which personal guarantees.
The FY2026 customer concentration. The last figures on file are FY2025, where the largest customer was 21.6% and the largest three 43.6% of revenue, against 38.2% and 68.2% in FY2024 and 22.1% and 55.7% in FY2023.
Who the educational institution behind the S$70.0m award is, its certification and payment cycle, and whether the contract sum is fixed for 54 months or subject to escalation.
What share of the S$106.2m order book is data-centre work, and how the backlog splits by expected year of recognition.
Project-level margins, retention terms, performance security and any provision for onerous contracts.
The board’s written mandate for the executive chairman’s capital-deployment role: the return hurdle, the funding limit, and the threshold above which an acquisition would go to shareholders.
The terms, price and funding of any binding Opto-Pharm transaction, and any further equity or shareholder-loan requirement at Linc Venture before The Shang Residence completes.
Headcount and foreign-worker numbers, and therefore the exposure to levy and dependency-ratio changes. The last figure on file is 113 full-time employees in the 2022 circular.
Audited confirmation of the FY2026 result, and the FY2026 maturity profile of the borrowings.
Download
A print-ready PDF of this page, for reading away from the screen: Lincotrade & Associates Holdings evidence library (PDF). It carries the same content as this page — what the company does, the five-year record, the order book and awards, why FY2026 profit was not cash, margin and working capital, funding, ownership and capital allocation, the share price, open evidence gaps and the next public tests — and the same omissions: no rating, no fair value, no forecast.
Basis. Figures are as reported by the issuer unless the arithmetic is described as derived. FY2026 is preliminary, unaudited and unreviewed. Second-half figures, half-year gross margins, implied order intake, project working capital, free cash flow, cash conversion and the free-float estimate are simple computations from stated figures and are labelled as such where they appear. Screening ratios are group computations and are not covenant calculations. The order-book series is taken from the issuer’s own quarter-end disclosures. Price data is a 36-month daily closing series to 3 September 2026, with the Straits Times Index and four SGX-listed peers as controls. This page publishes no forecast, no valuation and no view on the share price.
Where the filings differ from each other. Two presentation differences between what was first announced and what was later audited are worth knowing about, because a reader working from announcements alone would carry the wrong figure. In the FY2024 cash flow statement, the announcement netted the Tuas property purchase against the loan that financed it, showing capital expenditure of S$2.7m and financing outflows of S$4.5m; the audited statement grosses the two up, showing capital expenditure of S$10.3m and new loans of S$7.7m, with financing inflows of S$3.2m. Operating cash flow of S$5.5m and the net change in cash are identical on both presentations. In the FY2025 balance sheet, the unaudited announcement split other financial liabilities S$6.850m non-current and S$13.974m current; the audited accounts reclassified the revolving credit and show S$6.240m and S$14.584m, with the S$20.824m total unchanged. This page uses the audited presentation in both cases. A third, smaller difference: the FY2023 top-two customer figure prints as S$28.933m in the FY2024 annual report and S$28.993m in the FY2023 annual report, a S$60,000 discrepancy; the later comparative is used here.
Corrections log
Correction status at 3 September 2026: no post-publication corrections had been recorded by that date. Later dated corrections are listed below and do not advance this page’s research cutoff. This page replaces an earlier version dated 1 September 2026, which was written against a superseded working file; the figures, the charts and the source list were rebuilt from the filings for this version. Corrections are welcome through the contact page and will be dated and described here.
Reader questions & corrections
Ask about this company, challenge a source or suggest a factual correction. Only selected questions that SMID Research has reviewed and answered are published.
Submissions are private by default. Your email is encrypted and never published. Please do not send confidential or inside information, allegations about individuals, promotions, or requests for personalised investment advice.
Behind the lock The private vault contains the author's research notes and source register. It remains private and is not approved for public distribution.
Private boundary. The author-only record is not approved for public distribution. This public page deliberately omits any rating, valuation, scenario output and portfolio action.
These bounded retrospective corrections clarify specific published facts or calculations. They retain each report's existing research cutoff and do not represent a full refresh or a finding that all possible issues are resolved.
Lincotrade & Associates Holdings
Internal Inconsistency. The S$61,400 figure is total remuneration; 36.6%, about S$22,472 using the rounded percentage, was consultancy fees. Source basis: FY2025 annual report, page 31 table 4. Limitation: The consultancy amount is approximate because the published percentage is rounded.
Transcripts
Find available event transcripts in the transcript library.
· Entry Into a SPA in Relation to the Proposed Acquisition of 100% of Opto-Pharm Pte Ltd · SGX
· Update Announcement – Change of Interest in Linc-a Pte. Ltd. and Entry Into the Sha in Relation to the Proposed Joint Venture with Interested Persons · SGX
Earlier announcements, before 3 September 2026 (31)
· Lincotrade Achieves Record FY2026 Results with Net Profit More than Tripling to S$8.1 Million; Proposed Final Dividend of 0.90 Singapore Cents Per Share, Dividend Payout of 40% for FY2026 · SGX
· Appointment of Independent Non-Executive Directors and New Composition of the Board and the Board Committees of the Company · SGX
· Lincotrade Secures New Projects with an Aggregate Contract Value of S$16.8 Million in 3Q2026; Order Book Strengthens to S$107.0 Million · SGX
· A. Re-Designation and Appointment of Dr Tan Kok Heng as Executive Chairman B. Appointment of Mr Kwong Choong Kuen as Lead Independent Director C. Re-Composition of the Board and the Board Committees · SGX
· Non-Binding Term Sheet in Relation to the Proposed Acquisition of Shares in the Issued and Paid-Up Share Capital of Opto-Pharm Pte Ltd · SGX
· Incorporation of Subsidiary and Entry Into Term Sheet for the Proposed Joint Venture with Interested Persons · SGX
· Lincotrade Delivers Revenue Growth of 8.5% with Net Profit Growth of 11.5% in FY2025; Proposed Final Dividend of 0.66 Singapore Cents Per Share for FY2025 · SGX
· Lincotrade Obtains Approvals to Build an Ancillary Workers Dormitory of 204 Beds at its Tuas Factory; Order Book Strengthened to Approximately S$81.0 Million as at 31 March 2025 · SGX
· Lincotrade Clinches Maiden Commercial Project in Malaysia; To Provide Sub-Contract Works for an Infrastructure Development in Johor, Malaysia · SGX
· Lincotrade Posts Net Profit of S$2.3 Million in FY2024; Proposed Dividend of 0.32 Singapore Cents Per Share, Bringing Total Dividend to 0.70 Singapore Cents Per Share for FY2024 · SGX
· Lincotrade Continues Growth Momentum in 6M2024 with Net Profit Before Tax Increasing 24.2%; Maiden Interim Dividend of 0.38 Singapore Cents Per Share Declared · SGX
· Lincotrade 6 months to 31 December 2023 financial announcement Final · SGX
· Appointment of Independent Non-Executive Director and New Composition of the Board and the Board Committees · SGX
· Award of Jtc Factory Located at 5 Tuas Avenue 12 · SGX
· Lincotrade Strengthens Order Book with Two New Interior Fitting-Out Projects with an Aggregate Contract Value of S$28.1 Million · SGX
Titles are from the linked SGX filing, with common words abbreviated. Summaries are written by AI and may contain inaccuracies; refer to the original announcement. Items after 3 September 2026 are not reflected in this page's analysis; earlier items are listed for reference, may not be discussed in it, and may have been updated by later announcements.