Pan-United produces and delivers ready-mixed concrete, earning on volume, mix and operating efficiency across a fleet and batching network.
Latest figures
FY2025 operating cash flow was S$80.0m, but cash capital expenditure rose to S$48.0m; at 30 June 2026 cash was S$86.2m against S$21.0m of borrowings and S$39.5m of lease liabilities, leaving S$25.7m of net cash on the company's stricter definition.
Main risk
The central risk is that heavy capacity spending and receivable swings absorb more cash as construction demand changes.
Next proof
The next test is the next filing's concrete volume, margin, capex and working-capital conversion.
No public rating. Information cutoff 20 August 2026; latest financial filing is the 1H2026 financial statements of 13 August 2026, with the 18 August treasury-share transfer also considered. Every figure below is as reported in a primary filing or computed from one, with the computation shown. Nothing here is a recommendation.
Evidence balance
The live questionAs contractors pay for delivered concrete, does the 1H2026 revenue growth convert to cash faster than receivables and plant spending absorb it?In 1H2026 revenue grew far faster than operating cash flow, and management gave no FY2026 capital-expenditure figure, so the next filing decides whether the growth is funding itself.
What improved
1H2026 revenue rose 37% to S$549.6m and net attributable profit 49% to S$30.6m; EBITDA rose 48% to S$60.8m with the computed margin at 11.1% against 10.2%, and the interim dividend was raised to 1.5 cents from 1.0.
What became more demanding
Operating cash flow was S$27.0m against S$25.9m as trade and other receivables absorbed S$26.0m; cash fell to S$86.2m from S$99.8m while bank borrowings rose to S$21.0m from S$10.5m, after S$24.5m of dividends.
Strongest alternative explanation
The S$26.0m receivable build could simply track a 37% revenue step rather than collection stress; AR2025 note 16 discloses that trade receivables with certain customers carry settlement arrangements including trade credit insurance, amounting to S$166.506m, though the insured proportion and the deductible are not disclosed.
The decisive missing fact
The FY2026 capital-expenditure figure. Management said only that depreciation would stay around the FY2025 level and that FY2026 capex would follow its business plans, with no figure given, leaving the next filing's capex and working-capital conversion as the stated test.
Drawn from the evidence on this page: the improvement, the constraint, the benign reading and the fact that would settle it. It states no view on the shares.
About the private research record
Also on file behind the rated view 🔒 (author-only): a private credit initiation, the integrated 25-sheet spread with FY2026E-FY2029E forecasts, monthly industry data, DCF and credit schedules, plus the refreshed private initiation and deck. Kept private; not for distribution.
On this page
Business anatomy · from inputs to customer value
Concrete is manufactured and delivered as one timed service
Ready-mixed concrete remains usable only when batching, digital dispatch, truck delivery and the site pour stay inside a tight operating window.
Follow the operating chain from demand or inputs to customer outcome and cash.
InputsRecipe
Measure the raw materials
What happensCement, aggregates, water and admixtures are measured to the project’s required mix.
Capital at workInput cost and mix design establish the batch economics.
Company actionPlant
Batch to specification
What happensPan-United combines the materials at a local batching plant into ready-mixed concrete.
Value createdThe saleable product is created only when the live batch is made.
Delivery constraintTimed delivery
Route the mixer truck
What happensDigital dispatch sends each live batch by mixer truck, with pumps supporting the final site delivery.
Margin driverFleet utilisation and journey timing shape delivery cost.
Customer outcomeCustomer site
Reach the scheduled pour
What happensThe concrete arrives while usable and is accepted into the contractor’s project pour.
Who paysThe contractor or project customer pays for the specified, delivered batch.
Original SMID Research comic. AI-assisted, analyst-directed monochrome artwork depicts the evidenced operating steps of Pan-United Corporation; deterministic captions and dated mix figures state the economics using issuer disclosures available to 2026-08-20. The drawings are representative—not issuer artwork, an exact product or site design, a statement of scale, or a company forecast.
Investor translation
What matters after the operating picture
Four questions connect the business model to cash and balance-sheet risk. This is a factual reading aid, not a valuation or recommendation.
Value lever
Concrete volume, selling spread and return on plants, fleet and digital dispatch capacity.
Cash bottleneck
Raw materials, trucks and receivables absorb cash before contractors pay for delivered batches.
Balance-sheet pressure
Working-capital needs and capital spending overtake operating cash and committed facilities.
Next proof
Volume, unit margin, receivable days, maintenance spending and operating cash.
Text version of this comic
Inputs · Measure the raw materials Cement, aggregates, water and admixtures are measured to the project’s required mix. Capital at work: Input cost and mix design establish the batch economics.
Company action · Batch to specification Pan-United combines the materials at a local batching plant into ready-mixed concrete. Value created: The saleable product is created only when the live batch is made.
Delivery constraint · Route the mixer truck Digital dispatch sends each live batch by mixer truck, with pumps supporting the final site delivery. Margin driver: Fleet utilisation and journey timing shape delivery cost.
Customer outcome · Reach the scheduled pour The concrete arrives while usable and is accepted into the contractor’s project pour. Who pays: The contractor or project customer pays for the specified, delivered batch.
What the company is
Pan-United batches and delivers ready-mixed concrete and trades cement, aggregates and refined petroleum products, with operations in Singapore, Malaysia and Vietnam. Singapore was 89% of FY2025 revenue (S$801.3m of S$898.4m).
The structural fact that shapes the industry: concrete has a shelf life of roughly two hours, so it must be batched near the pour and cannot be imported (management, 34th AGM, 23 April 2026). Competition is therefore a function of batching-plant sites on leased land, which is why leasehold-land depreciation rose from S$8.2m to S$15.0m in FY2025 as new sites were taken on.
Two reportable segments
FY2025, S$'000
External revenue
Segment result
Segment assets
Segment liabilities
Additions to PP&E
Concrete & Cement
889,805
98,279
446,780
190,951
65,734
Trading & Others
8,631
777
78,363
8,218
229
Group
898,436
99,056
525,143 (+ associate and intangibles = 543,785 total assets)
199,169 (+ leases and borrowings = 247,961 total)
65,963
Source: Annual Report 2025, note 34(a). Both reconciliations tie exactly and are recorded as identity checks in the workbook. Caution on Trading & Others: its segment assets are dominated by the group's cash and investment-holding companies rather than operating assets, so a return-on-segment-assets figure for it is a return on the group cash pile and is not economically meaningful.
The as-filed history
Nothing before FY2018 is comparable. On 15 December 2017 Pan-United demerged its Chinese port business (Xinghua Port) by capital reduction and distribution in specie, and Xinghua Port Holdings listed on HKEX. Shareholders' funds fell from S$328.9m to S$191.5m and total assets from S$780.6m to S$421.9m between FY2017 and FY2018. Earlier perimeter changes: Pan-United Marine demerged in 2004, shipping disposed in 2016, and the Indonesian granite quarry (PT Pacific Granitama) in April 2023.
S$'000
FY2018
FY2019
FY2020
FY2021
FY2022
FY2023
FY2024
FY2025
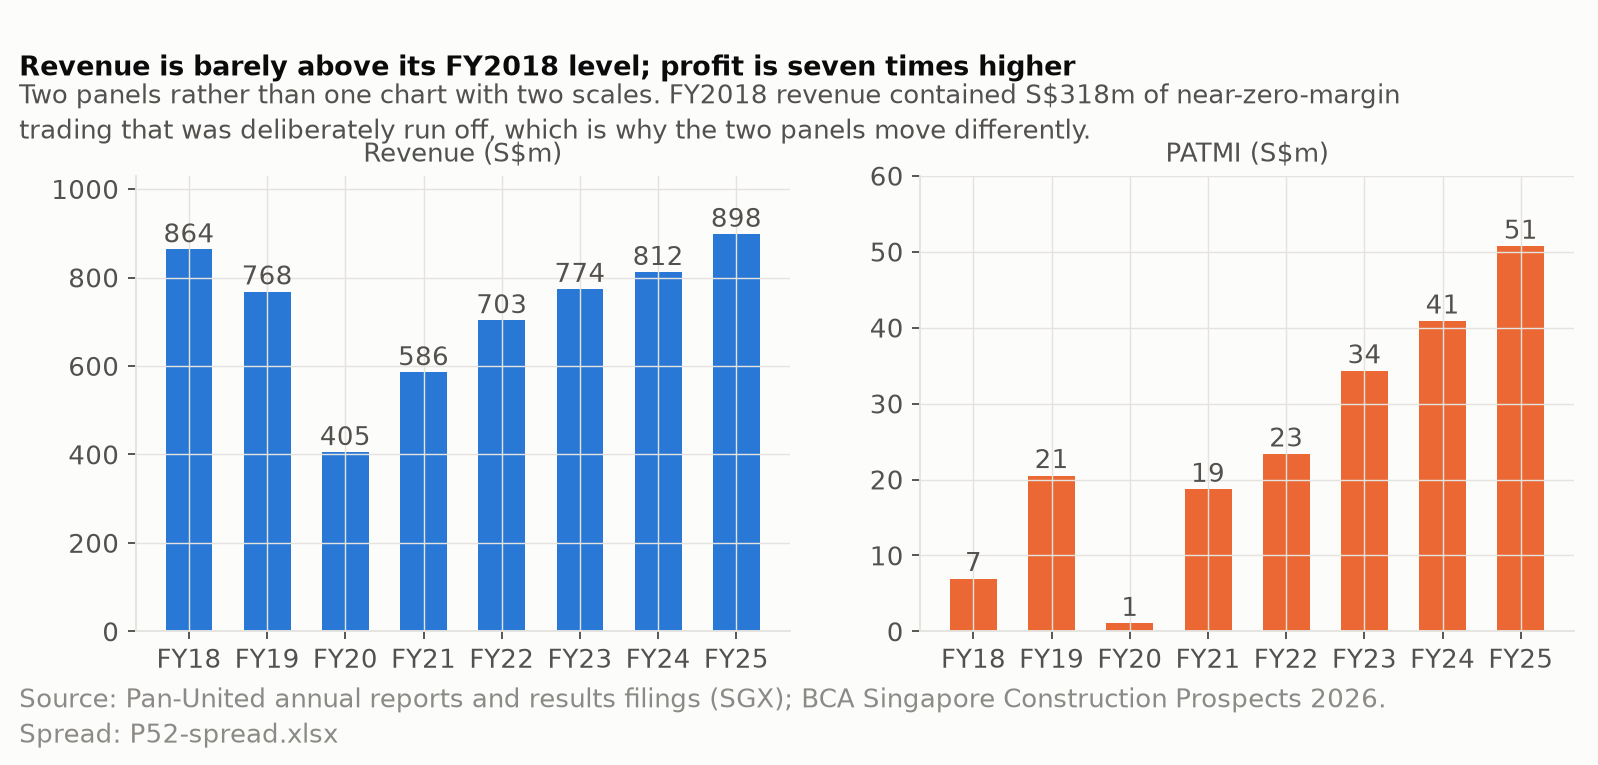
Revenue
863,530
768,258
405,024
585,559
703,261
774,138
812,297
898,436
EBITDA (as filed)
28,217
53,635
27,957
41,879
51,510
67,992
75,246
99,056
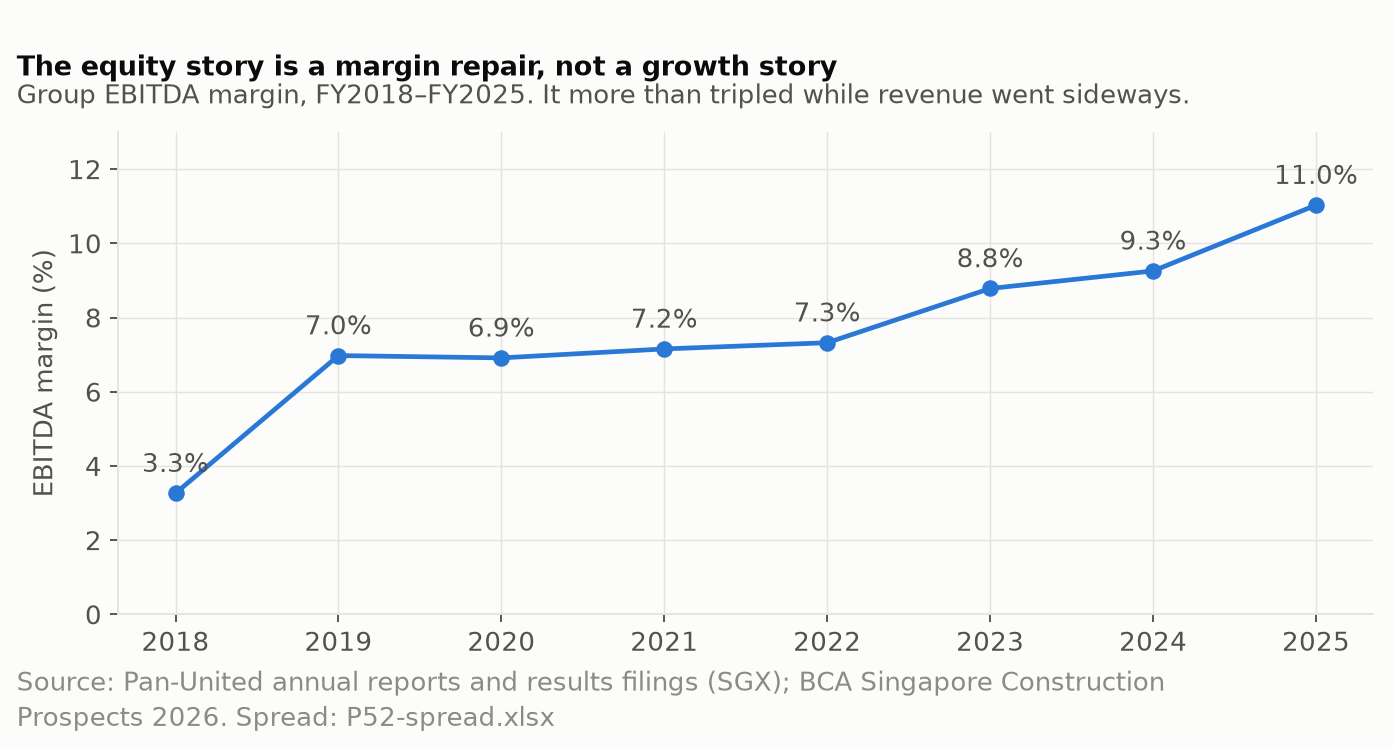
EBITDA margin
3.3%
7.0%
6.9%
7.2%
7.3%
8.8%
9.3%
11.0%
PATMI
6,950
20,511
1,036
19,350
23,350
34,297†
40,855
50,714
Operating cash flow
1,992
42,620
59,610
57,543
20,642
61,267
87,983
79,957
Cash capex (PP&E)
11,424
4,779
6,168
5,510
11,486
9,717
16,257
47,967
DPS declared (cents)
0.8
1.6
0.8
1.6
1.8
2.3
3.0
4.5
† FY2023 PATMI is the audited figure. Note also that FY2021 revenue, EBITDA and PATMI above are the re-presented continuing-operations figures from AR2022 (S$585.559m / S$41.879m / S$19.350m), not the originally reported totals; FY2023 DPS is 2.3 cents as declared; and FY2023 group assets and liabilities are the AR2024 audited figures. The unaudited announcement of 7 February 2024 stated S$36.311m; a Rule 704(6) announcement on 2 April 2024 restated it to S$34.297m (EPS 5.22c to 4.93c) on realisation of foreign-currency translation reserves through the income statement on the subsidiary disposal. Net assets and cash were unchanged. Both versions are held in the source library.
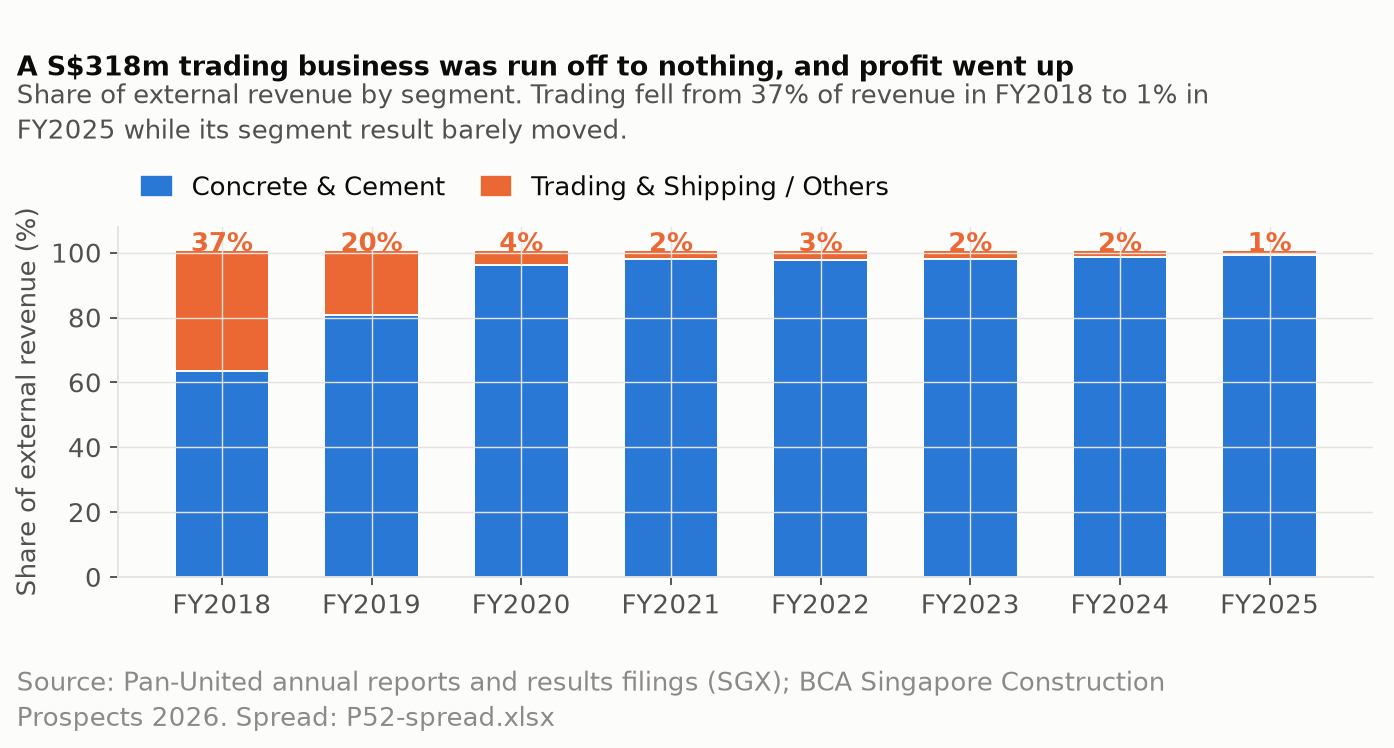
Revenue in FY2025 is barely above its FY2018 level; profit is roughly seven times higher. Two panels rather than one chart with two scales.The arithmetic behind the previous chart: external revenue in the trading segment fell from S$317.8m in FY2018 to S$8.6m in FY2025, while its segment result moved only from S$3,952k to S$777k.Group EBITDA margin as filed, FY2018 to FY2025.
The half-year series, which the annual figures hide
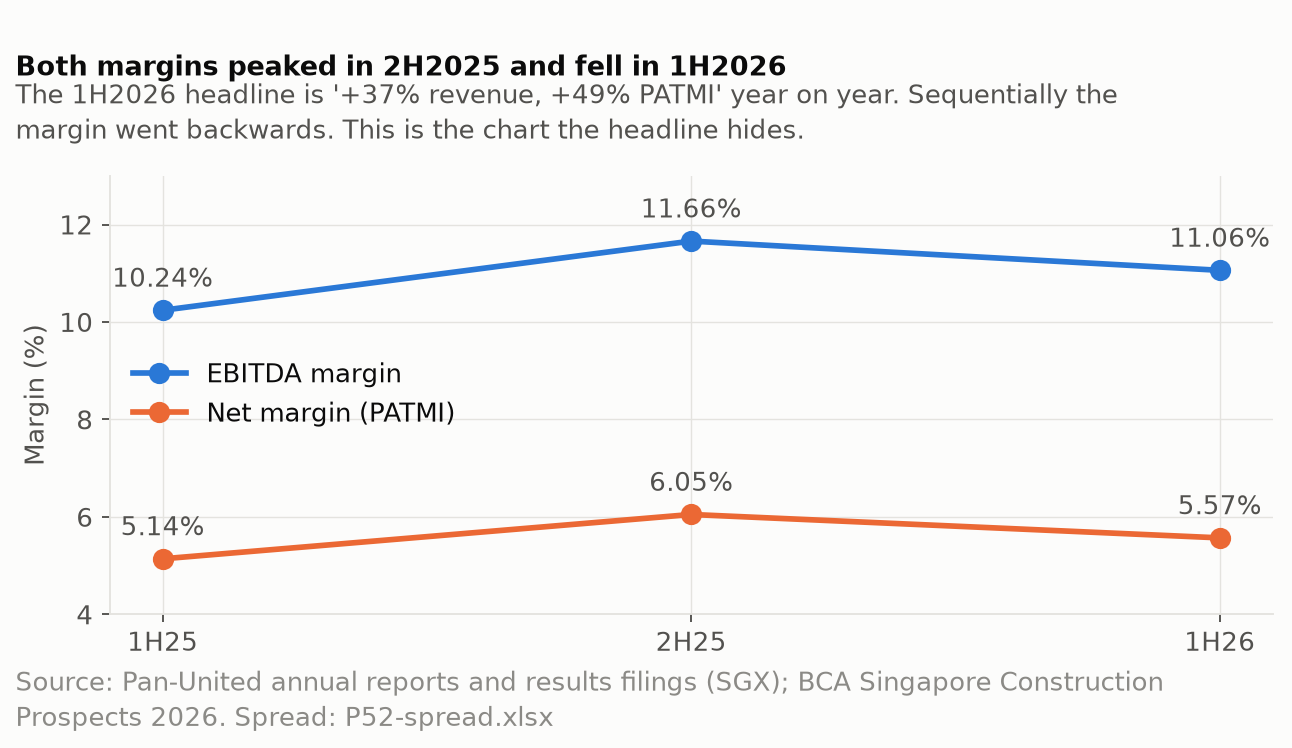
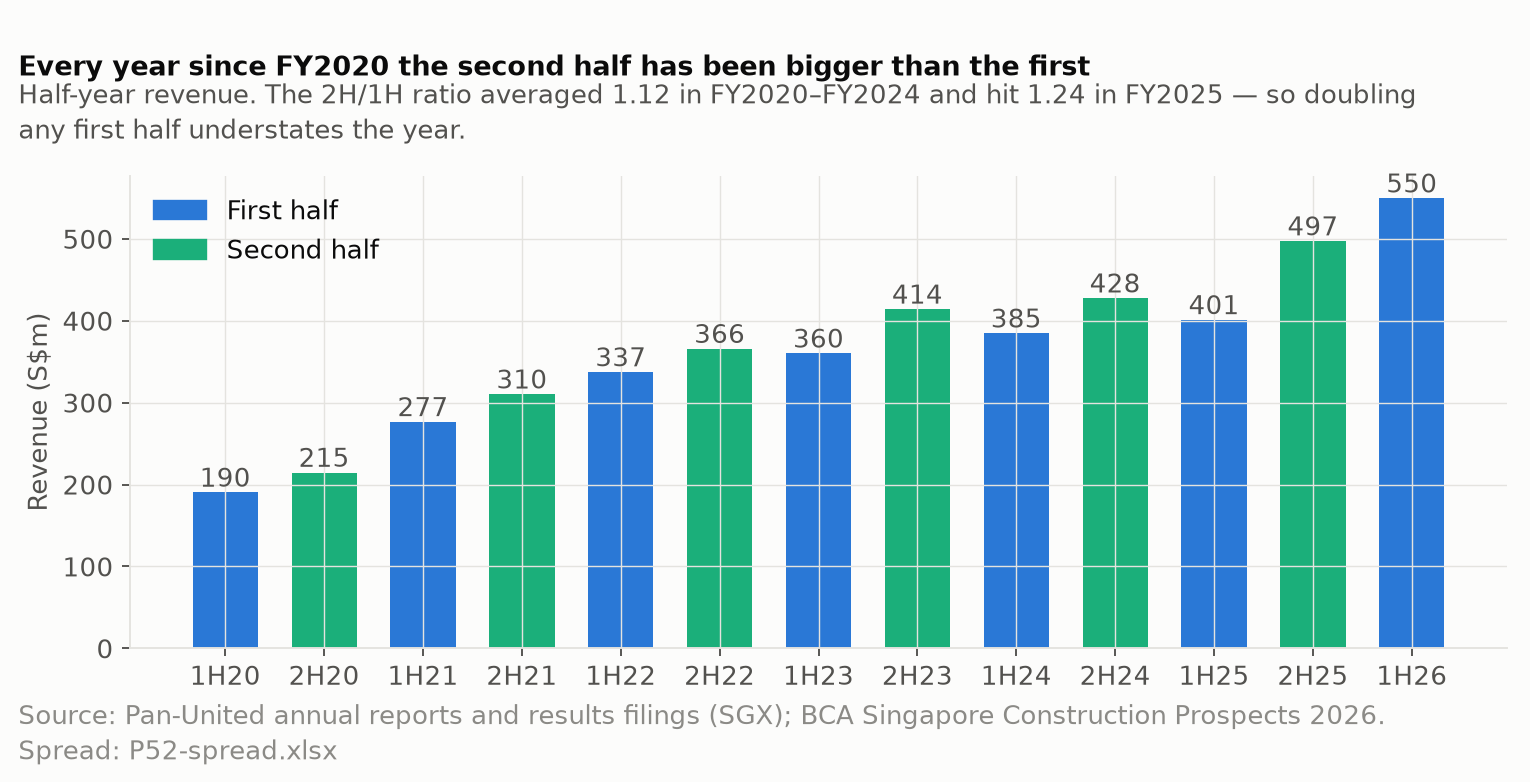
Pan-United reports half-yearly (quarterly reporting ceased 6 March 2020). Reading only the year-on-year headline of the 1H2026 release — revenue +37%, PATMI +49% — misses what the sequential series shows.
S$'000
1H2025
2H2025 (derived)
1H2026
Revenue
401,148
497,288
549,555
EBITDA
41,075
57,981
60,802
EBITDA margin
10.24%
11.66%
11.06%
PATMI
20,612
30,102
30,620
Net margin
5.14%
6.05%
5.57%
Sequential PATMI change
−7.5%
+46.0%
+1.7%
Second-half figures are derived by subtracting the reported first half from the reported full year; the subtraction is shown so it can be checked. Two observations follow from the arithmetic and neither is a view on the shares: revenue rose 10.5% sequentially where the recent seasonal pattern has been a 5–7% decline from a second half into the following first half, so the revenue acceleration is genuine; and both margins were higher in 2H2025 than in 1H2026.
A currency sensitivity to test the efficiency explanation. For 1H2025 and 1H2026, reported EBITDA of S$41.075m and S$60.802m divided by revenue of S$401.148m and S$549.555m gives margins of 10.239% and 11.064%: an increase of 82.45 basis points. Removing only the disclosed net currency loss of S$2.501m in the first period and gain of S$0.845m in the second gives (41.075 + 2.501) / 401.148 = 10.863% and (60.802 − 0.845) / 549.555 = 10.910%, an increase of 4.73 basis points. This is a derived, partial sensitivity, not issuer-adjusted EBITDA or a complete recurring-earnings measure. It limits what the headline margin change can establish about technology savings; it does not prove those savings are absent, since they could offset other cost increases. Source: 1H2026 financial statements, notes 4 and 13, pp10 and 16–17.
The margin series by half. The year-on-year headline and the sequential series point in different directions.Every year since FY2020 the second half has been larger than the first, by 8% to 24%. Doubling any first half therefore understates the year.
The industry series
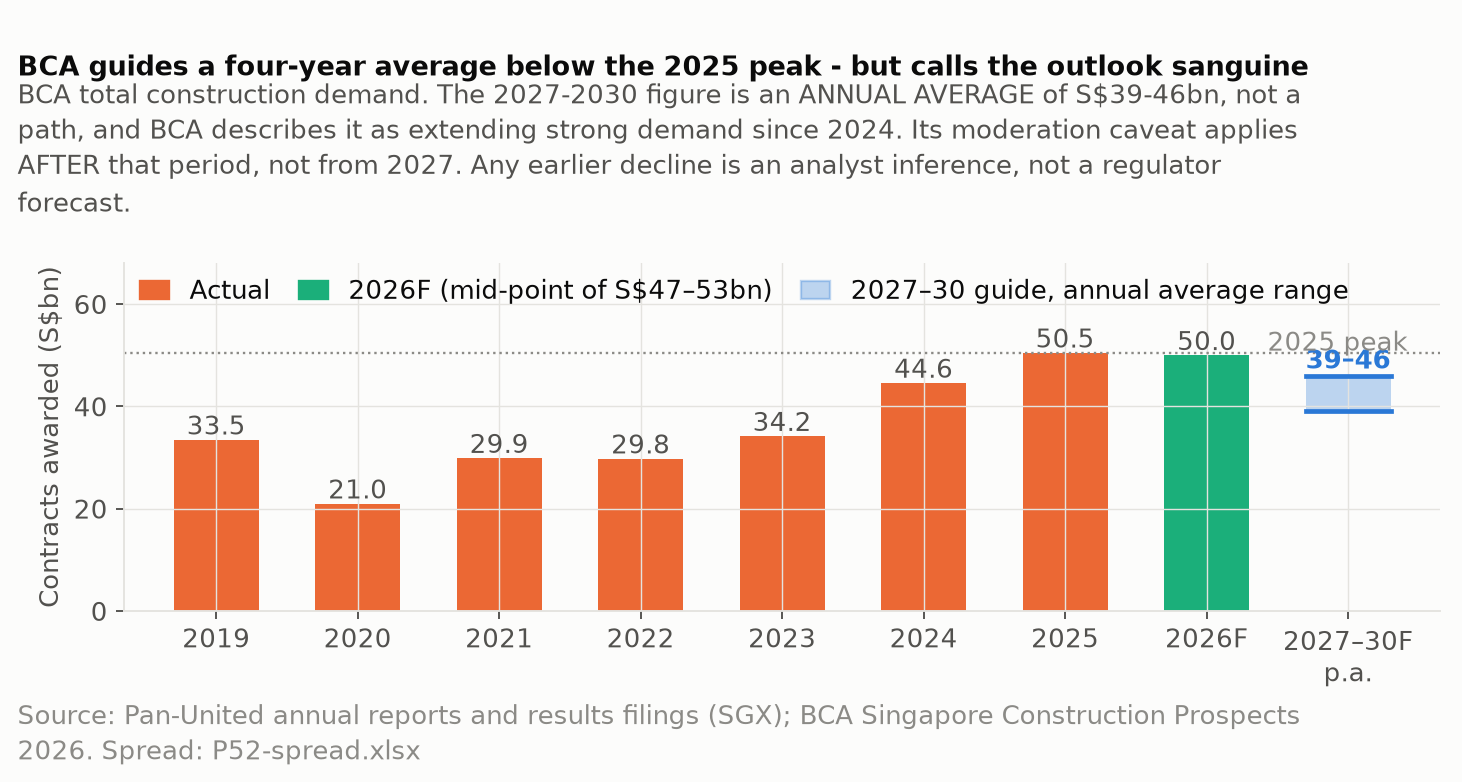
Singapore's Building and Construction Authority publishes the demand data this business runs on. Two definitions matter before reading the table. First, “construction demand” is the nominal value of contracts awarded (BCA footnote 2), not a volume — project mix, concrete intensity and tender-price inflation all sit between an award dollar and a cubic metre. Second, the 2027–2030 figure is a four-year annual average, not a path: BCA describes it as “extending the strong construction demand since 2024”, calls the medium-term outlook “sanguine”, and places its caveat that demand could eventually moderate after that period. BCA states that output reflects contracts awarded in past years but publishes no lag interval.
Calendar year
2019
2020
2021
2022
2023
2024
2025p
2026F
2027–30F p.a.
Construction demand, contracts awarded (S$bn)
33.5
21.0
29.9
29.8
34.2
44.6
50.5
47–53
39–46
Ready-mixed concrete demand (million m³)
—
—
—
—
—
13.39
14.53
15.0–16.0
—
Grade 40 pump RMC price (S$/m³, December)
—
—
—
—
—
120.5
125.0
—
—
Source: BCA, Singapore Construction Prospects 2026, 22 January 2026, Tables 1 and 2. BCA states its forecast "may be subject to significant revision" and reviews it each August. BCA also states that, as Changi Terminal 5 is an exceptional project during the medium term, industry demand "could eventually moderate" after that period.
BCA's published series. The 2027–2030 annual average is 8.9%–22.8% below the exceptional 2025 preliminary figure, while BCA itself describes the medium-term outlook as sanguine. An earlier version of this page and its chart asserted that the regulator had published the top of the cycle; that over-read the source and has been corrected.
Latest ready-mix indicators
Official quarterly demand and monthly market-price data help reconcile the first-half acceleration without assuming market-share gains. Ready-mixed-concrete demand rose from 3.120m m³ in 1Q2025 to 4.031m m³ in 1Q2026, up 29.2% y/y. The DOS/data.gov.sg monthly market-price series rose from S$129.5/m³ in December 2025 to S$143.3/m³ in June 2026, after peaking at S$145.6/m³ in April. These are market indicators, not Pan-United's realised volume or ASP.
Two official AiR Digital releases omitted from the retained local pack were also considered: the 25 August 2025 platform/customer update and the 9 June 2026 ISO/IEC 27001:2022 certification release. They establish product and adoption progress but do not disclose recurring revenue, margin or cash generation.
Company against industry
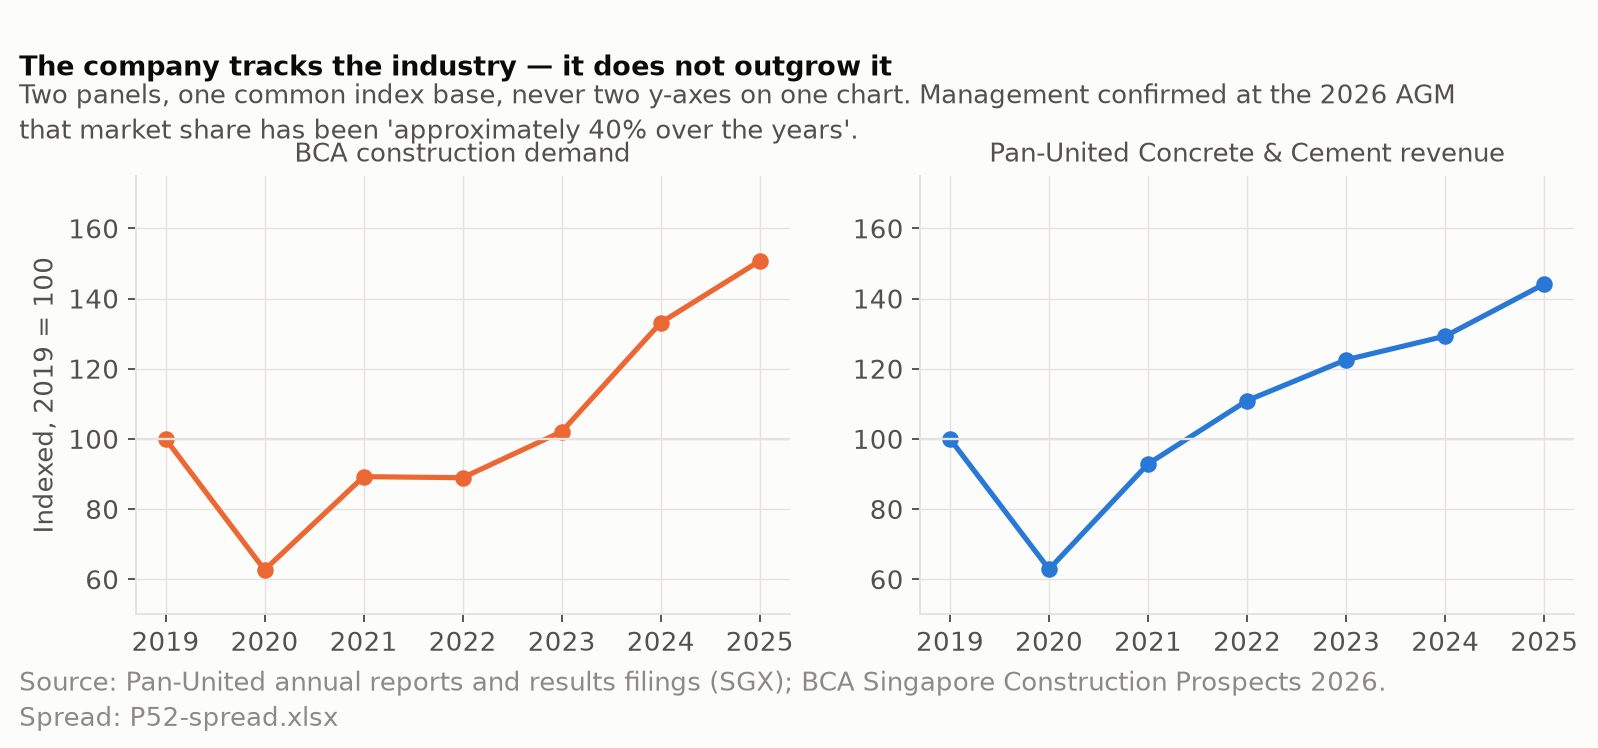
Pan-United's Singapore revenue was S$801.3m in FY2025. BCA's volume × price for 2025 — 14.53m m³ at S$125.0/m³ — is about S$1,816m, and the ratio computes to roughly 44%. Treat that as a crude order-of-magnitude cross-check, not a bound: S$125/m³ is a December price for a single grade (Grade 40 pump), not a full-year blended all-grade average, so the denominator is not an assured market value; and the numerator is Singapore all-product revenue including cement, aggregates and refined petroleum. At the 34th AGM on 23 April 2026 management stated that market share "has consistently achieved approximately 40% over the years"; the basis of that figure is not disclosed. An earlier version of this page called the 44% an upper bound. It is not one.
Both series indexed to a common base of 2019 = 100, in two panels rather than on two axes.
Cash and capital
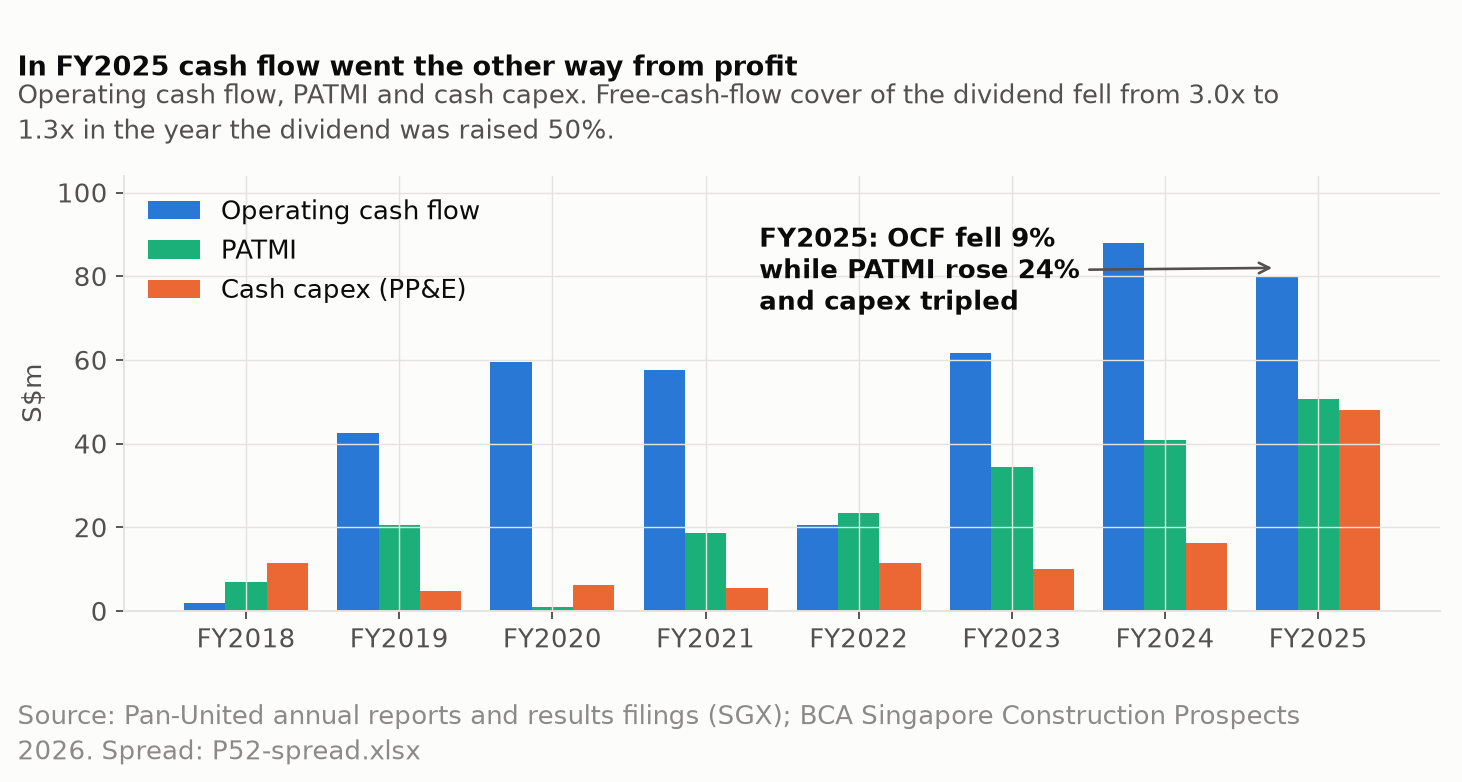
In FY2025 operating cash flow fell 9% while PATMI rose 24%, and cash capex rose from S$16.3m to S$48.0m. Free cash flow after capex and intangibles was S$29.9m against dividends paid of S$23.0m.
At 30 June 2026 the group held cash of S$86.2m against borrowings of S$21.0m and lease liabilities of S$39.5m. On the company's own stricter definition — cash less borrowings less leases — net cash was S$25.7m, against S$51.0m at 31 December 2025. There is no bond and no medium-term note programme.
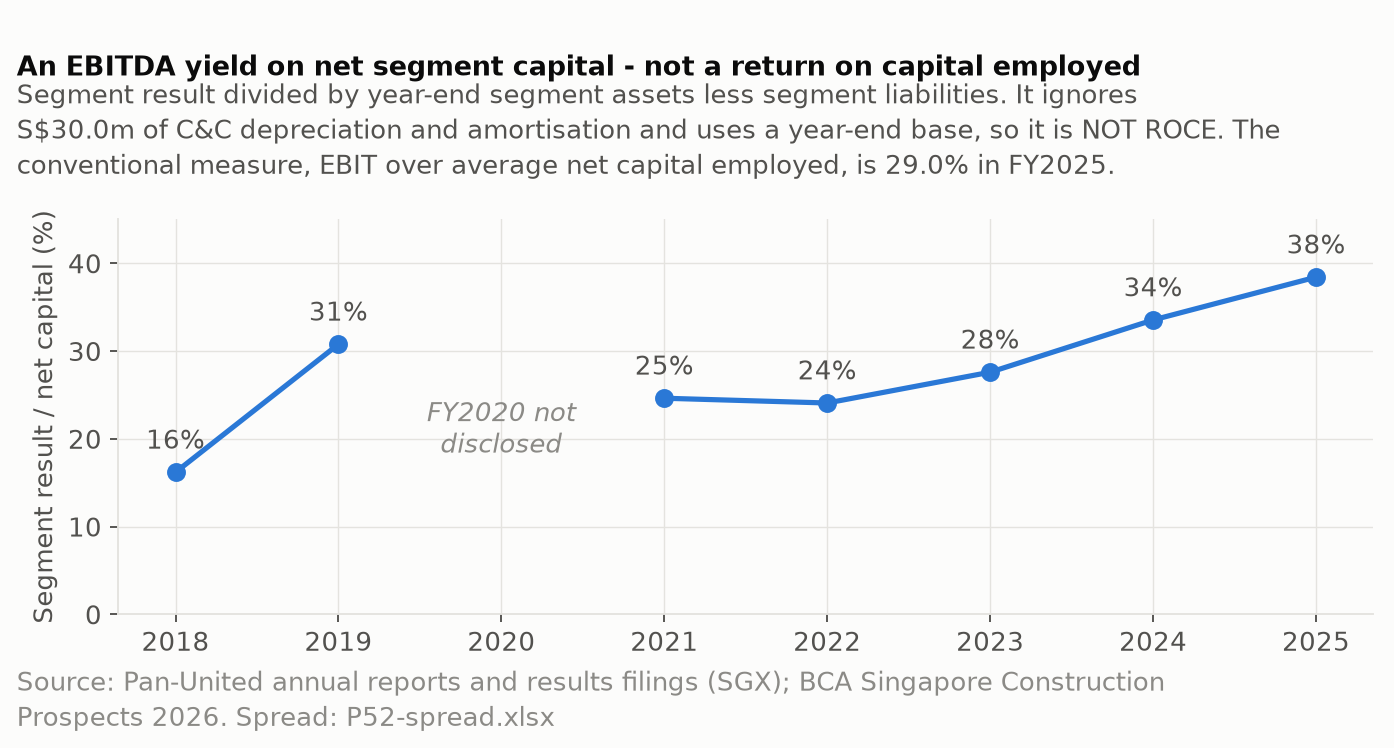
This historical chart is an asset-yield proxy: segment result divided by year-end segment assets less segment liabilities. Note 34(a) states that line before depreciation, amortisation and interest, so it is an EBITDA measure — which is why the chart calls it segment EBITDA and this caption calls it by the filing’s own name. It is not conventional return on capital, which uses EBIT and an average base — the segment result less the S$30.0m of segment depreciation and amortisation, over the average of the opening and closing net-capital bases. On that convention FY2025 is 29.0% — the figure the chart’s subtitle carries, so the two agree. Segment assets exclude intangibles and segment liabilities exclude leases and borrowings, so either base is a proxy for capital employed rather than invested capital. FY2020 is shown as a break because the required segment detail was not disclosed, and the line is not interpolated across it.
Where the cash actually went
S$’000, from the consolidated cash flow statement and its Note A reconciliation in the FY2021, FY2023, FY2024 and FY2025 annual reports. FY2023 is the audited column — the unaudited results announced on 7 February 2024 put operating cash flow at 61,617 and cash capex at 10,067. The audited accounts remove S$350,000 from both — the operating inflow and the investing outflow — which is why the net increase in cash is identical at 628 in the two documents. FY2022’s booked additions are the total, 13,069 — the cash flow statement shows 12,706 for continuing operations and 363 for the discontinued one, and only the total reconciles to the 11,486 actually paid.
S$’000
FY2021
FY2022
FY2023
FY2024
FY2025
Operating cash flow
57,543
20,642
61,267
87,983
79,957
Additions to property, plant and equipment, as booked
15,738
13,069
39,434
29,144
65,963
… of which actually paid in cash
5,510
11,486
9,717
16,257
47,967
… non-cash right-of-use additions
9,803
1,383
28,062
12,324
7,428
… reinstatement provision raised
425
200
1,655
563
10,568
Additions to intangible assets (cash)
3,265
4,157
2,186
2,348
2,114
Lease principal repaid
6,667
6,328
6,555
7,553
9,689
Dividends paid to shareholders
9,123
11,207
12,578
17,444
23,035
Dividends paid to non-controlling interests
329
341
419
424
424
Treasury shares purchased
705
2,162
1,379
781
775
Bank borrowings drawn
68,908
105,758
60,848
18,723
6,995
Bank borrowings repaid
109,491
96,462
93,127
25,408
12,430
… net (repayment)/draw
(40,583)
9,296
(32,279)
(6,685)
(5,435)
Cash and cash equivalents at year end
64,149
64,646
64,373
107,011
99,787
The capex line in the segment note is not a cash number, and in one of these five years it was four times the cash number. Pan-United books S$39.4m of additions to property, plant and equipment in FY2023 — and paid S$9.7m. The segment note states this a third way again, as S$41.6m of “additions to non-current assets”, because it folds in the intangibles as well. The other S$29.7m is a right-of-use asset raised against a lease (S$28.1m) plus a reinstatement provision (S$1.7m): both are real obligations, neither left the bank that year. The gap runs the other way in FY2025, where S$66.0m booked contains S$48.0m of actual cash — the largest cash outlay on plant in the five years, by a factor of three — and an unusually large S$10.6m reinstatement provision. A reader taking “additions to PP&E” from the segment table as capex would have overstated the FY2023 cash spend fourfold and the FY2025 cash spend by 37%.
The other thing the table shows is a company retiring debt in four of the five years, on a shrinking scale. FY2022 is the exception, with S$105.8m drawn against S$96.5m repaid. Gross repayments exceeded drawings by S$40.6m in FY2021 and S$32.3m in FY2023; by FY2025 the whole financing line is down to S$7.0m drawn against S$12.4m repaid. Cash sat at almost exactly S$64m at the end of FY2021, FY2022 and FY2023 — 64,149, then 64,646, then 64,373 — while that deleveraging was paid for out of operations. It then jumped to S$107.0m in FY2024 and fell back to S$99.8m in FY2025 as cash capex tripled. Dividends rose in every one of the five years, from S$9.1m to S$23.0m — a 2.5x increase against a 39% rise in operating cash flow.
FY2022 is the outlier in the top row, and it is a working-capital year rather than an earnings year. Operating cash flow before working capital was S$51.2m; trade and other receivables absorbed S$29.2m, and cash from operations came out at S$26.7m. The same receivable build repeated in FY2023 — S$32.1m — but payables, accruals and provisions gave back S$28.0m that year, which is most of why the year converted three times as much cash. Not all of it: operating cash flow before working capital also rose from S$51.2m to S$70.8m, so about half the improvement is the working-capital swing and about half is the business earning more.
Ownership and governance — as filed
Control. Ng Han Whatt, Jane Kimberly Ng Bee Kiok and Ng Bee Bee held 398,250,000 shares jointly (56.86%) at 16 March 2026; Ng Han Whatt a further 6,750,000 (0.96%) and Patrick Ng Bee Soon 34,962,037 (4.99%). The twenty largest shareholders held 84.61%.
Leadership. A new Executive Chairman, a new Chief Executive Officer and a new Independent Director were all announced on 15 July 2024. The CEO, Ken Loh Kah Soon, was an internal appointment already serving on the boards of the operating subsidiaries.
Auditor. Deloitte & Touche LLP was appointed for FY2025 in place of Ernst & Young LLP, approved at the AGM of 24 April 2025. The chairman recorded thanks to Ernst & Young "for their services for the past 33 years". The FY2025 opinion is unmodified with one Key Audit Matter: expected credit losses on trade receivables, which were S$179.3m or 33.0% of total assets.
Regulatory correspondence. Four replies to SGX queries were filed between 2020 and 2022, concerning the FY2019, FY2020 and FY2021 annual reports and the FY2020 financial statements.
Related-party transactions. There is no shareholders' mandate for interested person transactions under Listing Manual Rule 920; the company states there were no material interested person transactions in FY2025 and its Rule 907 table is nil; and no material contract involving the interest of any director or controlling shareholder was entered into since the previous year end. The only related-party transaction in the accounts is rental income of S$24,000 (FY2024: S$21,000) from companies related to directors (note 30(a)). Key management compensation was S$5,975,000, of which directors S$1,392,000 (note 30(b)). Stated because it is unusual: for a company in which one family holds about 62.8%, that is very little related-party activity.
Trade credit insurance. AR2025 note 16 discloses that trade receivables with certain customers carry settlement arrangements including trade credit insurance underwritten by reputable insurers, amounting to S$166.506m (FY2024: S$139.123m) — roughly 93% of the S$179.3m net trade receivable book. The annual report does not disclose what proportion of the S$166.506m balance is insured or the deductible/co-insurance. Management separately characterised this at the April 2026 AGM as insurance on “most of” its customers. An earlier version of this page stated that this appeared nowhere in the annual report. That was wrong; the annual report carries the more useful figure.
Disclosed at the AGM only. Management stated that a stop-work order was issued to one plant under construction in 2025 following an inspection that identified safety lapses, with the suspension lasting six weeks. That does not appear in the annual report.
The share price and what came with its moves
Over the window Pan-United returned +356.7% on a dividend-adjusted basis; the Straits Times Index returned +80.0% and the median of the 3 listed comparisons +409.5%.
Click a quarter — on the chart or in the return strip under it — to read its filings beside its large moves.
Key: Pan-United (P52) as a solid line; Straits Times Index rebased, dashed; peer median rebased, dotted; the peer median runs off scale from Aug 25 and is clipped there; filing ticks above the axis; ex-dividend ticks on it; numbered pins are moves with a written note; plain dots are other detected moves.
Key moves
The five largest moves over a day or up to two weeks, with no day counted twice.
Each move is shown next to the market over the same days (and peers, where shown). News listed with a move was published within its dates; that does not mean the news caused the move. The quarter view has all the news.
Index: Straits Times Index. Peers: the median of three listed companies used as a sector check; the notes name them and their limits.
Q3 2023
22 Aug 2023 – 29 Sep 2023 (part quarter)
P52 +1.3%STI +1.8%Peer median +4.1%Range S$0.38–S$0.41Close S$0.39
Revenue growth was attributed to the Concrete and Cement business. Net attributable profit from continuing operations rose to S$15.2m from S$14.5m; EBITDA was S$28.9m against S$26.6m with the margin described as comparable year on year (computed: 8.0%). Raw-material, subcontract and other direct costs rose 5%, and the company cited higher staff cost and interest expense from the higher-rate environment. Share of results of the associate fell 44% to S$2.0m on lower sales volume. The interim dividend of 0.5 cents went ex on 22 August 2023, the first session of the price window.
Guidance: The company cited BCA's 2023 construction-demand projection of S$27-32 billion (2022: S$29.8 billion) and said Singapore construction activity was expected to remain healthy for the rest of 2023 despite labour shortages and high construction and financing costs; Malaysia 'muted', Vietnam facing headwinds.
Q4 2023
2 Oct 2023 – 29 Dec 2023
P52 −2.6%STI +0.7%Peer median +2.4%Range S$0.37–S$0.40Close S$0.38
Large price moves
11 Nov 2023 · +5% · index 0% · peers 0%
Q1 2024
2 Jan 2024 – 28 Mar 2024
P52 +15.8%STI −0.5%Peer median +5.6%Range S$0.37–S$0.47Close S$0.44
Pan-United joined Chevron Singapore, Keppel, Surbana Jurong, Air Liquide Singapore, Osaka Gas Singapore and Pavilion Energy in the Low Carbon Technology Industry Consortium MOU. The stated areas include CO2 mineralisation for use in the built environment; no financial terms, capital commitment or timetable were disclosed. Broadcast at 12:08, during the trading session.
Installation was to complete in 1Q 2024 under a three-year 2022 MOU with Shell Singapore on decarbonisation. The company restated its target of being a carbon-neutral ready-mix concrete company by 2050; Shell said it was also exploring electrification of the trucking fleet and the reuse of its industrial by-products as raw material. No investment amount was disclosed.
Net attributable profit including the discontinued operation was reported as S$36.3m against S$23.4m (later restated, see 2 Apr 2024). EBITDA from continuing operations was S$68.0m against S$51.5m (computed margin 8.8% against 7.3%), attributed to the Concrete and Cement business. Raw-material, subcontract and other direct costs rose 7% and staff costs 18%; interest expense rose with rates. The second half was the stronger one: 2H2023 revenue of S$414.0m was up 13% and 2H2023 attributable profit from continuing operations of S$20.4m was up 57%. Share of results of the associate fell 53% to S$2.8m on lower volume and prices. Operating cash flow was S$61.6m; cash was S$64.4m and bank borrowings fell to S$21.3m from S$54.6m. Total FY2023 dividend 2.3 cents against 1.8 cents.
Guidance: The company cited BCA's 2024 construction-demand projection of S$32.0-38.0 billion (2023 preliminary: S$33.8 billion), public sector about 55% of demand, and ready-mix concrete volume of 12.0-13.0 million m3 (2023: 12.25 million m3), while flagging tight manpower, energy-price volatility and geopolitical supply-chain risk.Next session (8 Feb): P52 +3.9% · STI −0.4% · peers +0.0%
Principal activities are the marketing and provision of technology solutions. The company said the incorporation was not expected to have a material impact on FY2024 net tangible assets or earnings per share. This is the entity behind the AiR Digital announcements of August 2025 and June 2026.
Q2 2024
1 Apr 2024 – 28 Jun 2024
P52 +24.3%STI +3.4%Peer median +19.5%Range S$0.42–S$0.53Close S$0.53
The auditors required a S$2.0m foreign-currency translation reserve to be realised through the income statement on the disposal of a subsidiary, rather than reclassified directly to retained earnings; the discontinued operation moved from a S$0.9m profit to a S$1.1m loss. Profit from continuing operations (S$35.7m), net assets (S$237.6m) and the cash movement were unchanged. Broadcast after the close.
Next session (3 Apr): P52 +0.0% · STI −0.8% · peers +1.6%
The company attributed the FY2023 rise in finance costs, despite halved borrowings, to S$623,000 more interest on loans in the higher-rate environment and S$283,000 more on lease liabilities from right-of-use additions. Asked about its order book, it repeated BCA's 2024 demand range of S$32.0-38.0 billion and RMC volume of 12.0-13.0 million m3 and said its business 'should track the overall performance of the construction sector'.
Both cessations were described as part of the board renewal process, with no unresolved differences with the board. Mr Tay had chaired the board, the Executive Committee and the Nominating Committee; Ms Ng, sister of the CEO and deputy chairman, sat on the Audit and Remuneration Committees and held a deemed interest of 408,809,502 shares. All AGM resolutions, including the 1.8-cent final dividend and a renewed share buy-back mandate, were passed.
Record date 9 May 2024; approved at the AGM of 26 April 2024 and paid on 17 May 2024. The chart's return series is adjusted for it, so the ex-date step is not counted as a move.
Q3 2024
1 Jul 2024 – 30 Sep 2024
P52 +1.4%STI +7.6%Peer median +10.3%Range S$0.49–S$0.55Close S$0.53
Both appointments took effect the same day. Chan Wan Hong joined as independent director and member of the Audit and Remuneration Committees; Fong Yue Kwong was re-designated lead independent director; Soh Ee Beng became Nominating Committee chairman. The board is five strong with three independent directors. Ms Ng succeeds Tay Siew Choon, who retired at the April AGM. Mr Loh joined in 1999 to start the ready-mix concrete business; the company said he would pursue its vision 'to become a technology company in the concrete and logistics space'.
Next session (16 Jul): P52 −0.9% · STI −0.3% · peers +0.8%
The company said the electric truck cuts the carbon footprint of concrete transport by 45% against a diesel truck and that it hoped 'eventually' to operate a substantial electric fleet; no fleet size, cost or timetable was given.
The company attributed the growth to a 'robust' Singapore construction industry. EBITDA was S$35.0m against S$28.9m with the margin described as comparable (computed: 9.1% against 8.0%); depreciation rose 6% on right-of-use assets added in 2H2023. Share of results of the associate fell 18% to S$1.6m on lower margin. The profit comparison is against S$15.2m from continuing operations; including the since-restated discontinued operation the prior-year figure was S$13.9m. Operating cash flow was S$55.9m against S$22.7m; cash rose to S$95.5m from S$64.4m and bank borrowings fell to S$15.9m from S$21.3m. Basic EPS from continuing operations 2.66 cents against 2.17.
Guidance: The company cited BCA's 2024 construction-demand range of S$32.0-38.0 billion and RMC volume of 12.0-13.0 million m3, with public demand from HDB, Cross Island Line and Tuas Port work; Malaysia 'positive' on Johor data centres but with higher costs from the diesel-subsidy cut and sales tax; Vietnam a gradual property recovery.Next session (31 Jul): P52 +3.9% · STI +0.4% · peers +0.4%
EBITDA rose to S$75.2m from S$68.0m (computed margin 9.3% against 8.8%), attributed to revenue growth; depreciation rose on right-of-use assets and other expenses rose 19%, including a S$1.3m impairment of the associate. The second half slowed: 2H2024 revenue of S$427.6m was up 3% and 2H2024 attributable profit of S$22.3m up 9%. Share of results of the associate fell 11% to S$2.5m on lower selling prices. Operating cash flow was S$88.0m against S$61.3m; trade receivables fell S$13.7m to S$165.4m on collections; cash rose to S$107.0m from S$64.4m and bank borrowings fell to S$15.4m from S$21.3m. Total FY2024 dividend 3.0 cents against 2.3 cents; basic EPS 5.85 cents against 4.93.
Guidance: The company cited BCA's 2025 construction-demand projection of S$47-53 billion (2024 preliminary: S$44.2 billion), driven by the Marina Bay Sands expansion and Changi Airport Terminal 5, and RMC volume of 13.0-14.5 million m3 (2024: 13.4 million m3), adding that costs would 'still generally rise' on inflation and labour constraints; Malaysia positive, Ho Chi Minh City 'challenging'.Next session (26 Feb): P52 −1.6% · STI −0.2% · peers +2.3%
The January 2025 pour for main contractor China Harbour Engineering Company used Grade 105 super-high-strength concrete for the first time in Singapore, the company's CO2-mineralised PanU CMC+ product, and AiR Digital fleet scheduling. No contract value was disclosed.
Large price moves
220 Jan 2025 · +11% · index 0% · peers 0%
3week to 24 Jan 2025 · +12% · index 0% · peers +2%
Q2 2025
1 Apr 2025 – 30 Jun 2025
P52 +37.1%STI −0.2%Peer median +29.5%Range S$0.57–S$0.85Close S$0.85
The AGM notice described the change as part of 'ongoing good corporate governance initiatives', with Deloitte selected after the Audit Committee evaluated competitive proposals; a letter to shareholders of the same date gave the details. Shareholders approved the appointment on 24 April 2025 with 100.00% of votes cast in favour (19,500 shares against).
EBITDA rose to S$41.1m from S$35.0m (computed margin 10.2% against 9.1%). Depreciation rose 21% after 'significant' plant investment over the prior 12 months, staff costs 12% and other expenses 28%, the latter including a S$2.5m largely unrealised foreign-exchange loss on US-dollar cash. Share of results of the associate fell 55% to S$0.7m. Operating cash flow fell to S$25.9m from S$55.9m and cash capex rose to S$24.9m from S$6.0m; cash fell to S$83.0m from S$107.0m with bank borrowings of S$13.2m. The T5 ready-mix contracts run five years and were said not to have a material financial impact over the next 12 months. Interim dividend 1.0 cent against 0.7; basic EPS 2.95 cents against 2.66.
Guidance: The company cited BCA's 2025 demand range of S$47.0-53.0 billion, with S$27.7 billion of contracts awarded by June 2025 (up 41.3%) and progress payments of S$20 billion (up 9.7%); Malaysia's growth forecast cut by Bank Negara on US tariffs; Vietnam construction projected to grow 9.8% in 2025.Next session (14 Aug): P52 −6.1% · STI −0.4% · peers −0.6%
Named customers were Bridgeman Concrete (New Zealand), East Rock (Malaysian quarry) and Eastern Continent Construction (Singapore). The company claimed up to 45% manpower savings and 20% better fleet utilisation for users, said development began in-house in 2014, and said it would continue 'commercialising our solutions'. No revenue, pricing or contract terms were disclosed and the subsidiary is not reported as a segment.
Next session (26 Aug): P52 −3.3% · STI −0.3% · peers +2.9%
EBITDA rose 32% to S$99.1m (computed margin 11.0% against 9.3%), which the company attributed partly to technology adoption and R&D. The second half accelerated: 2H2025 revenue of S$497.3m was up 16% and 2H2025 attributable profit of S$30.1m up 35%. Staff costs rose 22% to S$71.0m and depreciation 35% to S$32.6m after property, plant and equipment additions of S$66.0m (cash capex S$48.0m against S$16.3m). Operating cash flow was S$80.0m against S$88.0m; cash was S$99.8m with bank borrowings of S$10.5m, and the company described a net cash position including lease liabilities. Share of results of the associate fell 52% to S$1.2m on lower revenue from its coal-mining business. Total FY2025 dividend 4.5 cents against 3.0; basic EPS 7.25 cents against 5.85.
Guidance: The company cited BCA's 2026 construction-demand projection of S$47-53 billion, comparable with the S$50.5 billion preliminary estimate for 2025, with RMC volume of 15.0-16.0 million m3 (2025: 14.6 million m3) and BCA's view that concrete prices would continue to be influenced by demand and rising operating costs; Malaysia steady, Vietnam targeting 10% growth.Next session (25 Feb): P52 +5.8% · STI −0.3% · peers −2.9%
Large price moves
1125 Feb 2026 · +6% · index 0% · peers −3%
12week to 27 Feb 2026 · +13% · index −1% · peers −2%
135 Mar 2026 · +6% · index +1% · peers 0%
1411 Mar 2026 · +7% · index 0% · peers +2%
1513 Mar 2026 · −5% · index 0% · peers 0%
1625 Mar 2026 · +8% · index +1% · peers 0%
17week to 27 Mar 2026 · +9% · index −1% · peers −1%
Q2 2026
1 Apr 2026 – 30 Jun 2026
P52 −10.9%STI +5.8%Peer median −0.8%Range S$1.35–S$1.73Close S$1.35
The company said FY2026 capex would follow its business plans and remain tied to Singapore construction demand; that the S$10.6m provision addition was for reinstatement of newly leased and more complex sites, mostly current because the leases expire within 12 months with renewals decided closer to expiry; that S$1.9m of developed-technology intangibles (S$1.35m net) were written off as superseded and were unrelated to GoTruck; and that higher interest income came from placing cash in SGD and USD deposits. PanU CMC+ is offered in Malaysia, with the focus on the existing Singapore, Malaysia and Vietnam footprint. Internal audit (PwC) found no major concerns for FY2025.
Guidance: Depreciation expected to remain at around the FY2025 level on the existing asset base; FY2026 capex per business plans, with no figure given.Next session (20 Apr): P52 −1.2% · STI +0.1% · peers −1.1%
Record date 6 May 2026; approved at the AGM of 23 April 2026, where Deloitte was re-appointed auditor and the share buy-back mandate renewed, and paid on 15 May 2026.
The release said AiR Digital was exploring further international markets and had exhibited at World of Concrete 2026. No customer count, revenue or contract figures were given.
Large price moves
181 Apr 2026 · +7% · index +2% · peers +3%
197 May 2026 · +6% · index 0% · peers +1%
2014 May 2026 · +6% · index 0% · peers +1%
Q3 2026
1 Jul 2026 – 21 Aug 2026 (part quarter)
P52 +15.6%STI +10.0%Peer median −3.0%Range S$1.34–S$1.65Close S$1.56
Growth was attributed to construction activity in Singapore, Malaysia and Vietnam. EBITDA rose 48% to S$60.8m (computed margin 11.1% against 10.2%), which the company linked to revenue, AiR Digital-driven efficiencies and operating leverage. Raw-material and direct costs rose 37% in line with revenue, staff costs 43% to S$48.4m, depreciation 36% to S$19.1m and income tax 70% to S$10.1m. Operating cash flow was S$27.0m against S$25.9m as trade and other receivables absorbed S$26.0m; cash capex was S$19.5m against S$24.9m. Cash fell to S$86.2m from S$99.8m while bank borrowings rose to S$21.0m from S$10.5m, after S$24.5m of dividends; the company again described a net cash position. Basic EPS 4.38 cents against 2.95.
Guidance: The company said construction demand in Singapore continued to be supported by Changi Airport Terminal 5, the Marina Bay Sands expansion, healthcare facilities and MRT extensions, with S$31.0 billion of contracts awarded by June 2026 against BCA's S$47.0-53.0 billion 2026 forecast, while citing energy-cost and supply-chain risk from geopolitical uncertainty; Malaysia and Vietnam outlooks 'positive'.Next session (14 Aug): P52 +1.3% · STI +0.4% · peers +0.0%
Large price moves
217 Jul 2026 · +9% · index +2% · peers −1%
22week to 10 Jul 2026 · +10% · index +4% · peers +1%
Notes and sources
Share price record
How this section was built
The detector flagged 22 large moves in the window — 16 single sessions and 6 weekly windows — before any news was read. 4 sector moves; 18 are left over after both controls, unexplained by them. Of those, 2 followed a filing by timestamp, 1 coincided with one in the same session or week and 15 have nothing filed against them beyond routine notices and are recorded as unexplained rather than explained away.
This section records the 36-month price history and puts every large move through two subtractions and reports what is left over, not what caused it: first the Straits Times Index, then the median of the 3 listed comparisons — Hong Leong Asia, BRC Asia and OKP Holdings — which trade the same session. “Left over” is what survives both controls.
Each quarter panel pairs two records. Key developments are the filings that carry information — results, shareholder-question responses, leadership changes, technology and sustainability announcements, dividend events — with the figures as filed, the guidance given, the close on the day and how the reacting session traded against the controls; a filing after the 09:00 open is read against the next session. Large price moves are the threshold-detected sessions, detected before any news was read and dispositioned from the controls and the enumerated tape; rows with a written note carry a numbered pin, the rest are dots on the line.
How to read the tags.Market-wide and Sector-wide mean the index or the peer median moved with the share over the same session or week; Residual means the move is still large after both are subtracted. A residual is what is left over, not a cause: it does not establish that the company’s own news moved the price, and an unchanged or thinly traded price is not proof that no information arrived. Returns use the dividend-adjusted close; a filing released after the open is read against the next session.
Prices are Yahoo Finance daily closes for P52.SI (returns on the dividend-adjusted series, 755 sessions); the tape is every SGXNet announcement the issuer broadcast over 22 Aug 2023 to 21 Aug 2026, 160 items with SGX broadcast times, retrieved from the SGX announcements API on 23 Aug 2026. A filing after the open is read against the next session.
Limitations bound every row above. The tape is the SGX announcements API listing for Pan-United over the 36-month window: 160 broadcasts, of which 115 are daily share buy-back notices, treasury-share transfers, share-award grants and director interest notices, and another 15 are AGM notices, annual reports and minutes; the register is drawn from the 30 that remain (six results releases, six dividend notices, eight press releases and corporate notices including a Nominating Committee appointment, the Rule 704(6) adjustment, two shareholder Q&A responses, the five July 2024 board notices and the two April 2024 cessations) plus the ex-dates the dividend notices fix. Broker notes, block trades and substantial-shareholder timing, trade press and index reviews were not examined. The pack has no `research/entity-tape-register.json`; the operating subsidiaries (Pan-United Concrete, the Malaysian and Vietnamese units, AiR Digital Pte. Ltd.) and the 10%-held associate PT Lanna Harita Indonesia are unlisted and have no filing streams of their own, so the only record of them is what the parent chose to broadcast. The pack's results files are the SGX financial-statement templates only; Pan-United did not attach a separate press release or slide deck to any results broadcast in the window, so the narrative quoted is the template's "Review" and "Commentary" sections, and the company does not give numerical guidance of its own — its forward statements are citations of BCA's construction-demand and ready-mix-volume projections. The peer control is three stocks (Hong Leong Asia, BRC Asia, OKP) whose session returns diverge widely on the detected days (for example −11.6%, −5.2% and −14.2% on 7 Apr 2025), so the peer median is a weak sector control, and 15 of the 22 detected moves remain unexplained against the tape.
A quarter shows only the columns it has. An empty developments column means: No filings beyond routine disclosures this quarter. An empty moves column means: No session cleared the large-move threshold this quarter.
The full move register — every large move and its market and sector controls
Every threshold-detected move in the window with its controls, dispositioned in the price-driver register; rows with a written note carry a numbered pin on the chart.
#
Session
P52
STI
Peers
Left over
Control result
What the evidence supports
1
1 Nov 2023
+5.4%
+0.3%
+0.0%
+5.4%
Residual
Against an index move of +0.3% and a peer median of +0.0%, about 5 points are left over; 0.3× median volume. No filing beyond routine notices in the prior three sessions. HLAsia +0.0 · BRC +1.2 · OKP +0.0
2
20 Jan 2025
+10.7%
−0.1%
+0.4%
+10.3%
Residual
A 10.7% rise from S$0.56 to S$0.62, the highest close of the window to that date, on 749,200 shares — 6.5× median volume and the heaviest session since June 2024. The index was flat and no peer rose more than OKP's 3.0% (Hong Leong Asia flat, BRC Asia +0.4%), so about ten points survive both controls. The tape is silent: Pan-United broadcast nothing between a treasury-share transfer notice on 13 January and the next on 18 February, and the FY2024 results did not come until 25 February. The shares had closed between S$0.56 and S$0.57 for the preceding two weeks; the next four sessions netted +0.8% to S$0.625 and the close held S$0.625–0.63 to the end of the month, so there was no reversal. No filing explains it. HLAsia +0.0 · BRC +0.4 · OKP +3.0
3
week to 24 Jan 2025
+11.6%
−0.2%
+2.1%
+9.5%
Residual
Weekly window, 17 to 24 January 2025, in which the 20 January session carried 10.7 of the 11.6 points; the other four sessions netted +0.8%, with 722,000 shares traded on the 24th. The index fell 0.2% over the week and the peers rose (Hong Leong Asia +2.1%, BRC Asia +7.4%, OKP +1.5%), leaving about nine points. No Pan-United announcement falls inside the window or in the three weeks either side of it beyond treasury-share transfer notices on 13 January and 18 February. The close held S$0.625–0.63 through the following week. No filing explains it. HLAsia +2.1 · BRC +7.4 · OKP +1.5
4
7 Apr 2025
−8.0%
−7.5%
−11.6%
+3.6%
Sector-wide
In line with the market: against an index move of −7.5% and a peer median of −11.6%, about 4 points are left over. HLAsia −11.6 · BRC −5.2 · OKP −14.2
5
30 Jun 2025
+6.2%
−0.1%
+1.2%
+5.0%
Residual
Against an index move of −0.1% and a peer median of +1.2%, about 5 points are left over; 24.7× median volume. No filing beyond routine notices in the prior three sessions. HLAsia +3.9 · BRC +0.6 · OKP +1.2
6
week to 4 Jul 2025
+8.1%
+1.2%
+6.5%
+1.6%
Sector-wide
Tracked the sector: against an index move of +1.2% and a peer median of +6.5%, about 2 points are left over. HLAsia +6.5 · BRC +2.6 · OKP +10.7
7
10 Jul 2025
+6.2%
+0.4%
+3.0%
+3.1%
Sector-wide
Tracked the sector: against an index move of +0.4% and a peer median of +3.0%, about 3 points are left over. HLAsia +4.9 · BRC +0.9 · OKP +3.0
8
week to 11 Jul 2025
+11.5%
+1.9%
+5.4%
+6.1%
Residual
Weekly window, 2025-07-04 to 2025-07-11: against an index move of +1.9% and a peer median of +5.4%, about 6 points are left over. No filing beyond routine notices inside the window. HLAsia +3.0 · BRC +5.4 · OKP +5.9
9
14 Aug 2025
−6.1%
−0.4%
−0.6%
−5.6%
Residual
The session after the 1H2025 results, filed at 19:35 on 13 August — after that day's +3.6% close, so the rise preceded the filing and this fall followed it. The company reported revenue up 4% to S$401.1m and net attributable profit up 11% to S$20.6m, with the interim dividend raised to 1.0 cent from 0.7; operating cash flow fell to S$25.9m from S$55.9m as cash capex rose to S$24.9m, and the filing disclosed about S$430m of five-year Changi Airport Terminal 5 concrete contracts that it said would not have a material financial impact over the next 12 months. The index fell 0.4% and no peer fell more than OKP's 4.7% (Hong Leong Asia +2.3%, BRC Asia −0.6%), leaving about six points to the filing; 27.3× median volume, the second-heaviest session of the three years. The next session recovered 5.6% to S$1.13, and the close was S$1.22 a week later. HLAsia +2.3 · BRC −0.6 · OKP −4.7
10
20 Aug 2025
+6.4%
+0.1%
+0.6%
+5.9%
Residual
Against an index move of +0.1% and a peer median of +0.6%, about 6 points are left over; 19.9× median volume. No filing beyond routine notices in the prior three sessions. HLAsia +6.3 · BRC +0.6 · OKP +0.5
11
25 Feb 2026
+5.8%
−0.3%
−2.9%
+8.7%
Residual
The session after the FY2025 results, filed at 20:13 on 24 February — after that day's flat close — so this rise followed the filing: revenue up 11% to S$898.4m, net attributable profit up 24% to S$50.7m, and the final dividend raised to 3.5 cents from 2.3, making 4.5 cents for the year against 3.0. The index fell 0.3% and the peer median fell 2.9%, but that median is Hong Leong Asia −10.3% and OKP −2.9% against BRC Asia −0.4%, so about nine points are left over; 21.8× median volume, the heaviest session since August 2025. The close of S$1.27 was the first above the S$1.26 of September 2025, and the next two sessions added 3.9% and 2.3%. HLAsia −10.3 · BRC −0.4 · OKP −2.9
12
week to 27 Feb 2026
+13.4%
−0.5%
−2.1%
+15.6%
Residual
Weekly window, 20 to 27 February 2026, and the largest residual in the register. The week included the FY2025 results, filed at 20:13 on 24 February after a flat session: revenue up 11% to S$898.4m and net attributable profit up 24% to S$50.7m, with the final dividend raised to 3.5 cents from 2.3. The index fell 0.5% over the week and all three peers fell (Hong Leong Asia −4.4%, BRC Asia −2.1%, OKP −1.2%), so about 16 points survive both controls. The 23 and 24 February sessions were +0.8% and flat; the three sessions after the filing were +5.8%, +3.9% and +2.3%, taking the close from S$1.20 to S$1.35, above the S$1.26 of September 2025. There was no reversal: the shares closed at S$1.39 on 2 March. HLAsia −4.4 · BRC −2.1 · OKP −1.2
13
5 Mar 2026
+5.8%
+0.7%
−0.3%
+6.2%
Residual
Against an index move of +0.7% and a peer median of −0.3%, about 6 points are left over; 11.0× median volume. No filing beyond routine notices in the prior three sessions. HLAsia −0.3 · BRC +1.6 · OKP −2.6
14
11 Mar 2026
+6.5%
+0.1%
+1.8%
+4.7%
Residual
Against an index move of +0.1% and a peer median of +1.8%, about 5 points are left over; 9.9× median volume. No filing beyond routine notices in the prior three sessions. HLAsia −0.4 · BRC +1.8 · OKP +2.7
15
13 Mar 2026
−5.3%
−0.3%
+0.0%
−5.3%
Residual
Against an index move of −0.3% and a peer median of +0.0%, about 5 points are left over; 7.5× median volume. No filing beyond routine notices in the prior three sessions. HLAsia −1.4 · BRC +1.1 · OKP +0.0
16
25 Mar 2026
+8.1%
+0.9%
+0.4%
+7.7%
Residual
An 8.1% rise from S$1.48 to S$1.60, a new high for the window, on 18.8× median volume (2,167,000 shares), with the tape silent for four weeks on either side: nothing between the buy-back and treasury-share notices of 9 March and the AGM notice of 6 April. The index rose 0.9% and the peers were Hong Leong Asia +4.0%, BRC Asia +0.4% and OKP flat, so about eight points are left over. The session before had recovered 2.1% of a 4.0% fall on 23 March, when the index fell 2.2% and Hong Leong Asia 7.0%. The two sessions after added 1.9% and 1.2% to S$1.65; the shares then fell 5.5% on 31 March and rose 6.5% on 1 April, closing that session back at S$1.65. No filing explains it. HLAsia +4.0 · BRC +0.4 · OKP +0.0
17
week to 27 Mar 2026
+9.3%
−1.0%
−0.7%
+10.0%
Residual
Weekly window, 20 to 27 March 2026, from S$1.51 to S$1.65, of which the 25 March session accounts for 8.1 of the 9.3 points; the other four sessions were −4.0%, +2.1%, +1.9% and +1.2%. The index fell 1.0% over the week and the peer median fell 0.7% (Hong Leong Asia −0.7%, BRC Asia +1.7%, OKP −8.2%), leaving about ten points. No Pan-United announcement falls inside the window, or anywhere between the buy-back and treasury-share notices of 9 March and the AGM notice of 6 April. The following week the shares fell 5.5% on 31 March and rose 6.5% on 1 April, closing that session back at S$1.65. No filing explains it. HLAsia −0.7 · BRC +1.7 · OKP −8.2
18
1 Apr 2026
+6.5%
+1.9%
+2.5%
+4.0%
Sector-wide
Tracked the sector: against an index move of +1.9% and a peer median of +2.5%, about 4 points are left over. HLAsia +2.5 · BRC +0.2 · OKP +7.8
19
7 May 2026
+6.0%
+0.3%
+0.9%
+5.0%
Residual
Against an index move of +0.3% and a peer median of +0.9%, about 5 points are left over; 9.8× median volume. No filing beyond routine notices in the prior three sessions. HLAsia +6.3 · BRC +0.9 · OKP +0.6
20
14 May 2026
+6.1%
−0.2%
+1.1%
+5.1%
Residual
Against an index move of −0.2% and a peer median of +1.1%, about 5 points are left over; 16.2× median volume. No filing beyond routine notices in the prior three sessions. HLAsia +1.0 · BRC +1.5 · OKP −1.8
21
7 Jul 2026
+8.7%
+1.6%
−0.6%
+9.3%
Residual
An 8.7% rise from S$1.38 to S$1.50 on 7.0× median volume (800,800 shares), out of a tape that holds nothing between a buy-back notice on 29 June and the 1H2026 results on 13 August. The index rose 1.6% that session but the peers did not (Hong Leong Asia +0.4%, BRC Asia −1.6%, OKP −0.6%), so about nine points survive both controls. The shares had drifted from the S$1.73 high of 14 May to S$1.34 on 1 July on thin volume — 38,800 shares on 30 June — and had risen 2.2% the session before. The next session gave back 2.7% to S$1.46; the close was S$1.49 by 10 July and S$1.59 by 16 July, so the gain was not reversed. No filing explains it. HLAsia +0.4 · BRC −1.6 · OKP −0.6
22
week to 10 Jul 2026
+10.4%
+4.3%
+0.6%
+9.7%
Residual
Weekly window, 3 to 10 July 2026, from S$1.35 to S$1.49, of which the 7 July session accounts for 8.7 of the 10.4 points; the other four netted +1.5%. The index rose 4.3% over the week but the peers barely moved (Hong Leong Asia +0.8%, BRC Asia −0.5%, OKP +0.6%), leaving about ten points. No Pan-United announcement falls inside the window, and none between a buy-back notice on 29 June and the 1H2026 results on 13 August. The shares went on to S$1.52 on 13 July and S$1.59 on 16 July, so the week's gain was not reversed. No filing explains it. HLAsia +0.8 · BRC −0.5 · OKP +0.6
Key developments: sources, timing and notes
10 Aug 2023 · 1H2023 results: revenue up 7% to S$360.2m and net attributable profit S$15.9m against S$13.5m; interim dividend held at 0.5 cents.ResultsFiled before the price window opens on 22 Aug 2023 and before the SGX tape starts; no reaction session is computed. Broadcast time not on the tape.Source: Results announcement, 10 Aug 2023 (issuer IR archive; pre-dates the SGX tape)
11 Jan 2024 · Seven-party MOU on carbon capture, utilisation and sequestration (CCUS) and lower-carbon hydrogen, extending a consortium formed in July 2020.AnnouncementSource: SGX announcement, 11 Jan 2024 (released 12:08, intraday)
7 Feb 2024 · FY2023 results: revenue up 10% to S$774.1m and net attributable profit from continuing operations up 29% to S$35.6m; final dividend raised to 1.8 cents from 1.3.ResultsReaction (next session, 8 Feb): P52 +3.9% · STI −0.4% · peers +0.0% · 50.6× median volumeSource: SGX announcement, 7 Feb 2024 (released 23:21, after the close) · Dividend notice, 7 Feb 2024
8 Feb 2024 · Incorporation of AiR Digital Pte. Ltd., an indirect wholly-owned technology subsidiary with S$100,000 paid-up capital.Corporate actionSource: SGX announcement, 8 Feb 2024
2 Apr 2024 · Rule 704(6) adjustment: audited FY2023 net attributable profit S$34.3m against the S$36.3m announced; basic EPS 4.93 cents against 5.22.AnnouncementReaction (next session, 3 Apr): P52 +0.0% · STI −0.8% · peers +1.6% · 0.1× median volumeSource: SGX announcement, 2 Apr 2024 (released 20:32, after the close)
19 Apr 2024 · Responses to shareholder questions before the AGM: BCA-reported ready-mix concrete price of about S$118 per m3 for January-March 2024; no ASP guidance given.Business updateSource: SGX announcement, 19 Apr 2024
12 Mar 2025 · Mass pour of 10,250 m3 of concrete over 35 hours for the raft foundation of The Skywaters, to be Singapore's tallest building at 305 m.AnnouncementSource: SGX announcement, 12 Mar 2025
6 May 2025 · Ex-dividend: final FY2024 dividend of 2.3 cents per share.DividendSource: Dividend notice, 25 Feb 2025
13 Aug 2025 · 1H2025 results: revenue up 4% to S$401.1m and net attributable profit up 11% to S$20.6m; about S$430m of Changi Airport Terminal 5 concrete contracts disclosed.ResultsReaction (next session, 14 Aug): P52 −6.1% · STI −0.4% · peers −0.6% · 4.7× median volumeSource: SGX announcement, 13 Aug 2025 (released 19:35, after the close) · Dividend notice, 13 Aug 2025
25 Aug 2025 · AiR Digital business update: the AI operations-management system now serves more than 20 ready-mix and logistics companies across Southeast Asia, North Asia and Australasia.Business updateReaction (next session, 26 Aug): P52 −3.3% · STI −0.3% · peers +2.9% · 0.7× median volumeSource: SGX announcement, 25 Aug 2025
27 Aug 2025 · Ex-dividend: interim FY2025 dividend of 1.0 cent per share.DividendSource: Dividend notice, 13 Aug 2025
17 Apr 2026 · Responses to shareholder and SIAS questions: FY2025 capex of S$48.0m, depreciation 'expected to remain at around the current level', and a S$13.5m leasehold-land write-off with S$0.2m book value.Business updateReaction (next session, 20 Apr): P52 −1.2% · STI +0.1% · peers −1.1% · 1.0× median volumeSource: SGX announcement, 17 Apr 2026
9 Jun 2026 · AiR Digital obtains ISO/IEC 27001:2022 information-security certification; the subsidiary now operates in seven markets in Asia and Australasia.AnnouncementSource: SGX announcement, 9 Jun 2026
Every other test on this page waits for the company to file. These do not. Each row is a series you can look up yourself, free, today — with the level this reading was built against, the levels that would put it in question, and what the series cannot tell you.
BCA's January construction-prospects release; read total construction demand, and the August review that revises it. Building and Construction Authority, Singapore
Last recorded
50 S$bn, 2026-01-22
What the reading assumes
50.5 S$bn (BCA reported actual, 2025)
Watch / alert
47 and 39 S$bn, on a move below — currently between the assumed level and the watch level
How often to look
twice yearly, at the January forecast and the August review (the series prints event)
What it points to. Concrete volume follows construction activity, and awarded contracts are the pipeline that activity is drawn from.
Direction only — this pack does not carry a coefficient from this series to reported earnings.
What it cannot tell you. Construction demand is the nominal value of contracts AWARDED, not work done: the company's page already records that BCA publishes no lag interval between award and output, so this series cannot time revenue. It is also a national aggregate, and a single large public award can move it without touching this company's addressable work.
Settled by the next half-year results and volume disclosure, due 2027-02-28. Lead time: award to output runs into following years; BCA states the lag but does not quantify it.
Watchlist reviewed on 2026-08-27; each observation has its own date above. This watchlist date does not change the company research cutoff. A series moving past a level is a reason to re-read the case, not a recommendation. The same series across every company covered: what you can watch.
Notes and sources
What the filings do not answer
How should Singapore revenue growth of 38.7% in 1H2026 be reconciled with the market evidence? Official data show 1Q2026 ready-mix demand up 29.2% year on year, while the monthly Grade 40 pump price rose 10.7% from December 2025 to June 2026. Those series are not a mechanical revenue bridge, but together they materially narrow the apparent gap without requiring a share-gain assumption. Management stated at the April 2026 AGM that market share remained approximately 40%, low-carbon concrete carries no green premium and its margins are comparable; mix and project phasing remain undisclosed. No August 2026 BCA mid-year review was located by the 20 August cut-off.
What is FY2026 capital expenditure? SIAS asked management in April 2026 how much growth the group could support without significant capital expenditure. The reply was that the group "expects to incur capital expenditure based on our business plans". No figure was given.
What is customer concentration? No customer-concentration figure is disclosed in any filing reviewed. The size or distribution of the customer base therefore cannot be inferred from the filings; the disclosure gap is the observation.
Does the technology cost inside Trading & Others buy the margin gain in Concrete & Cement? Management credits AiR Digital for the operating efficiencies in the 1H2026 performance review, and AiR Digital sits inside Trading & Others. The split is not disclosed, so the question cannot be settled from the filings. The segment was roughly break-even in 1H2024 (+S$0.059m), loss-making in 1H2025 (−S$1.550m) and 1H2026 (−S$1.805m), and positive in 2H2025 (+S$1.592m). Three first-half observations are suggestive, not structural; full-year PATMI was +S$2.367m in FY2024 and +S$0.042m in FY2025.
Download
A print-ready PDF of this page, for reading away from the screen: Pan-United Corporation evidence library (PDF). It carries the same content as this page — what the company is, the as-filed history, the half-year series, the industry series, cash and capital, where the cash went, ownership and governance, the share price and open questions — and the same omissions: no rating, no fair value, no forecast.
At least 94 retained primary documents, supplemented in this refresh by official 2025-2026 AiR Digital releases, the 18 August 2026 treasury-share transfer and official monthly/quarterly industry datasets: 16 annual reports (FY2010–FY2025), 14 results filings (FY2019–1H2026, including the superseded unaudited FY2023 announcement and its Rule 704(6) correction), the complete 2017 restructuring set, the 2017 rights issue set, the 2016 shipping disposal set, the PT Pacific Granitama disposal set, AGM minutes and SIAS responses 2020–2026, four SGX query replies, and BCA's Singapore Construction Prospects 2026. The 2008–2026 announcement tape (854 items) was enumerated, but the retained local download pack is not represented as a perfect binary archive; SGX access controls blocked two official attachment downloads, which were URL-verified and recorded explicitly.
Named gap. Annual reports for FY2009 and earlier are not carried by the issuer's IR archive: FY1996–FY2009 were probed on the same path pattern that serves FY2010–FY2024 and every one returned HTTP 404, so the archive starts at FY2010 rather than having dropped older years. They were not pursued further through the SIAS archive, web archives or national library deposit, because the December 2017 demerger makes pre-2018 accounts non-comparable to the present company. That is a scope decision, not a statement that the documents do not exist.
A gap that closed. The FY2025 interested-person-transaction disclosure was not located on the first extraction pass and this page originally made no statement about related-party transactions. It has since been retrieved, and the position is set out under governance above.
Corrections log for this page
Two corrections were made to the underlying research before this page was written, and both are recorded because the first drafts were wrong. (1) The auditor was initially recorded as Ernst & Young; it is Deloitte & Touche for FY2025, and checking that surfaced the auditor change after 33 years, which the first pass had missed entirely. (2) The Trading & Others segment was initially described as loss-making on the basis of the 1H2026 figure alone; splitting the half-year series showed it earns in second halves, so the original framing compared a half-year against a full year. Both corrections propagated to the workbook, the chart pack and this page. (3) Added 24 August 2026: the FY2023 operating cash flow and cash capex cells on this page read 61,617 and 10,067, taken from the unaudited results of 7 February 2024. The audited annual report gives 61,267 and 9,717. S$350,000 is removed from both lines — the operating inflow and the investing outflow — not moved between them, which is why the net increase in cash is identical at 628 in both documents. The Rule 704(6) announcement of 2 April 2024 does not mention it: that announcement scopes itself to “the consolidated income statement and consolidated statement of comprehensive income”, states there are “no other material variances”, and confirms the S$628,000 net increase in cash was unchanged — which it was. The two component lines moving is visible only by comparing the unaudited announcement against the annual report line by line. FY2023 was therefore the one unaudited year in a row of audited ones, and both cells now match the annual report. (4) Added 16 September 2026: the dividend-per-share row read 1.3 cents for FY2019 and 1.1 cents for FY2020. Those were the dividends paid during each year (the previous year’s final plus that year’s interim), not the dividends declared for the year that the row’s label states. The annual reports’ dividend notes give 1.60 cents declared for FY2019 (interim 0.50 plus final 1.10) and 0.80 cents for FY2020 (no interim, final 0.80), and both cells now match them, so every year in the row is on the declared basis. The FY2023 EBITDA cell also read 67,991, the segment-results total in the unaudited announcement of 7 February 2024; the audited annual report gives 67,992, and the cell now matches it, consistent with the audited FY2023 PATMI beside it. The FY2023 EBITDA margin is unchanged at 8.8%.
Information cutoff 20 August 2026 · no public rating on this page · a private personal credit view exists in the protected author vault · no fair value, price target, expected return or recommendation is published on this public page.
Reader questions & corrections
Ask about this company, challenge a source or suggest a factual correction. Only selected questions that SMID Research has reviewed and answered are published.
Submissions are private by default. Your email is encrypted and never published. Please do not send confidential or inside information, allegations about individuals, promotions, or requests for personalised investment advice.
Behind the lock
A complete private working view exists beyond this page: the integrated private initiation, 25-sheet forecast/valuation/credit workbook, editable PowerPoint deck, source manifest and independent-review artifacts. It is maintained in the author's vault for the author's own records — not published and not available for sharing. This page carries everything that is public.
These bounded retrospective corrections clarify specific published facts or calculations. They retain each report's existing research cutoff and do not represent a full refresh or a finding that all possible issues are resolved.
Pan-United Corporation
Extension. A disclosed-currency sensitivity reduces the 1H2025–1H2026 EBITDA-margin increase from 82.45 basis points to 4.73 basis points after removing only the stated currency loss and gain. Sources: Source. Limitation: This is a partial derived sensitivity, not issuer-adjusted EBITDA or proof that technology savings are absent.
Transcripts
Find available event transcripts in the transcript library.