PC Partner designs and sells graphics cards under ZOTAC, Inno3D and Manli, manufactures for other brands and runs a smaller electronics-manufacturing operation.
Latest figures
At the latest balance-sheet date it reported HK$2,899.1m of cash against HK$1,339.3m of borrowings and HK$55.0m of leases, or about HK$1,504.7m of net cash, although short-term placements distort the reported operating-cash-flow line.
Main risk
The central risk is that GPU demand, inventory and supplier terms turn quickly across a concentrated product cycle.
Next proof
The next test is the next results' shipment mix, inventory conversion and a cash-flow bridge excluding treasury placements.
Information cutoff 20 August 2026. The latest reported period is 1H2026 (six months to 30 June 2026), announced 14 August 2026 and neither audited nor reviewed. The last audited accounts are FY2025 (year to 31 December 2025), auditor’s report dated 17 March 2026. Every number below is as reported in a primary filing or computed from one, with the computation shown.
Evidence balance
The live questionCan margin hold once GPU inventory is replenished at current component costs, with allocation shrinking and shipment volumes falling?In 1H2026 gross margin jumped to 16.5% from 10.5% while revenue rose only 1.5%, so the profit gain came from margin rather than volume, and the company attributes the margin move to average selling prices.
What improved
Gross profit rose 58.7% to HK$1,062.8m and profit attributable to owners rose 117.9% to HK$545.5m on essentially flat revenue of HK$6,450.2m, and the analytical cash-flow proxy swung back to a positive HK$587m.
What became more demanding
Own-brand graphics-card volume fell 18.4% and ODM/OEM volume 38.4% even as prices rose; management expects roughly 10% further GPU-allocation decline in 2H2026, and a supplier-finance arrangement first disclosed in FY2025 extended HK$348,439,000 of trade payables from 30 days to 150 days, with no 1H2026 figure disclosed.
Strongest alternative explanation
The margin gain could reflect mix rather than a one-off inventory windfall: ODM/OEM ASP rose 181.0% after the group was awarded more orders on high-end cards, and management guided to an approximately 18% VGA average-selling-price increase; that does not by itself establish repeatability.
The decisive missing fact
The filings do not separate the gain from pre-shortage inventory from any durable improvement in pricing; the FY2026 second-half margin, against inventory replenished at current component costs, is the observation that would settle it.
Drawn from the evidence on this page: the improvement, the constraint, the benign reading and the fact that would settle it. It states no view on the shares.
About the private research record
Also on file for this company, behind the rated view 🔒 (author-only): the rating and full written view with fair value and scenarios · the complete initiation report (PDF) · the financial spread & model workbook (Excel, live formulas) · the presentation deck · the independent-review artifacts. Kept private; not for distribution.
On this page
Business anatomy · operations, customers and cash
One electronics assembly base feeds branded and contract routes
PC Partner buys components and assembles boards and systems, then sells them through its own-brand channel or an OEM/ODM programme.
Read each card by investor role: business line, operating step, customer outcome or cash conversion.
InputsComponents
Source the electronics
What happensGPUs, memory, circuit boards, power and cooling parts enter the assembly operation.
Capital at workComponent availability and purchase cost set much of the working-capital risk.
Company actionFactory
Assemble and test
What happensPC Partner builds graphics cards, mini-PCs, motherboards and other electronics, then tests the finished units.
Value createdAssembly converts purchased parts into saleable hardware.
Route to marketOwn-brand route
Ship through distribution
What happensOwn-brand products move to distributors, retailers and PC builders.
Revenue triggerChannel customers pay for delivered branded hardware.
Business lineContract route
Build for another brand
What happensOEM and ODM customers contract PC Partner to supply electronics sold or integrated under the customer’s identity.
How it earnsThe OEM customer pays for the contracted product, not the end consumer directly.
Original SMID Research comic. AI-assisted, analyst-directed monochrome artwork depicts the evidenced operating steps of PC Partner Group; deterministic captions and dated mix figures state the economics using issuer disclosures available to 2026-08-20. The drawings are representative—not issuer artwork, an exact product or site design, a statement of scale, or a company forecast.
Investor translation
What matters after the operating picture
Four questions connect the business model to cash and balance-sheet risk. This is a factual reading aid, not a valuation or recommendation.
Value lever
Normalized hardware margin and cash earned through the GPU cycle after inventory risk.
Cash bottleneck
Components and finished goods are funded before distributors and contract customers pay.
Balance-sheet pressure
Cash after an inventory haircut no longer covers supplier claims and near-term obligations.
Next proof
Inventory turns, channel demand, gross margin and operating cash through the next product cycle.
Text version of this comic
Inputs · Source the electronics GPUs, memory, circuit boards, power and cooling parts enter the assembly operation. Capital at work: Component availability and purchase cost set much of the working-capital risk.
Company action · Assemble and test PC Partner builds graphics cards, mini-PCs, motherboards and other electronics, then tests the finished units. Value created: Assembly converts purchased parts into saleable hardware.
Route to market · Ship through distribution Own-brand products move to distributors, retailers and PC builders. Revenue trigger: Channel customers pay for delivered branded hardware.
Business line · Build for another brand OEM and ODM customers contract PC Partner to supply electronics sold or integrated under the customer’s identity. How it earns: The OEM customer pays for the contracted product, not the end consumer directly.
What the company is
PC Partner buys graphics processing units and memory, assembles them into graphics cards, and sells them — under its own brands through distributors in more than 70 countries, and on an ODM/OEM basis to other manufacturers. It also runs a contract-electronics business making ATM and point-of-sale hardware, and sells mini-PCs and motherboards. Manufacturing is in Dongguan, China and, since the end of FY2024, Batam, Indonesia.
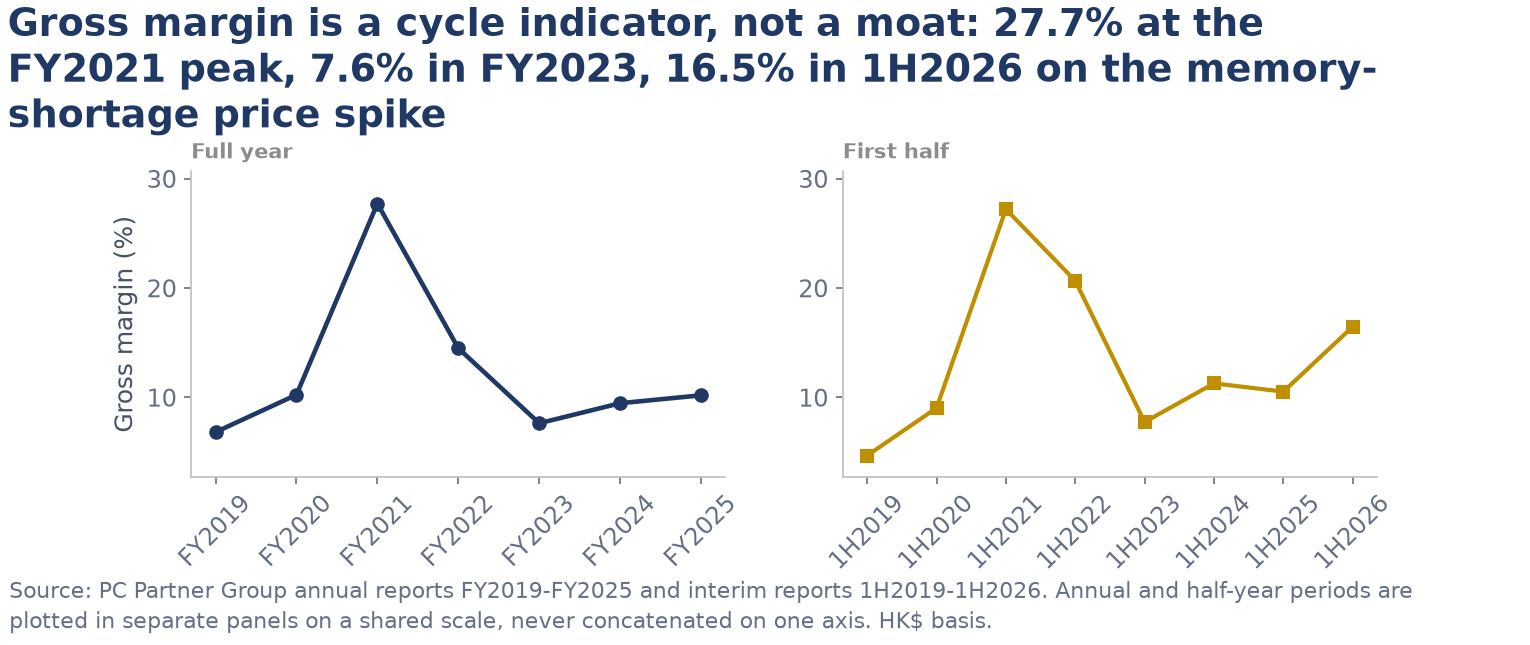
The cost structure tells you what kind of business this is. Raw materials were 87.6% of revenue in FY2025 and 81.7% in 1H2026; the conversion cost of direct labour and production overhead was HK$300.5m and HK$116.3m respectively, on revenue of HK$13,951.7m and HK$6,450.2m. Gross margin has ranged from 6.8% to 27.7% across the seven years to FY2025.
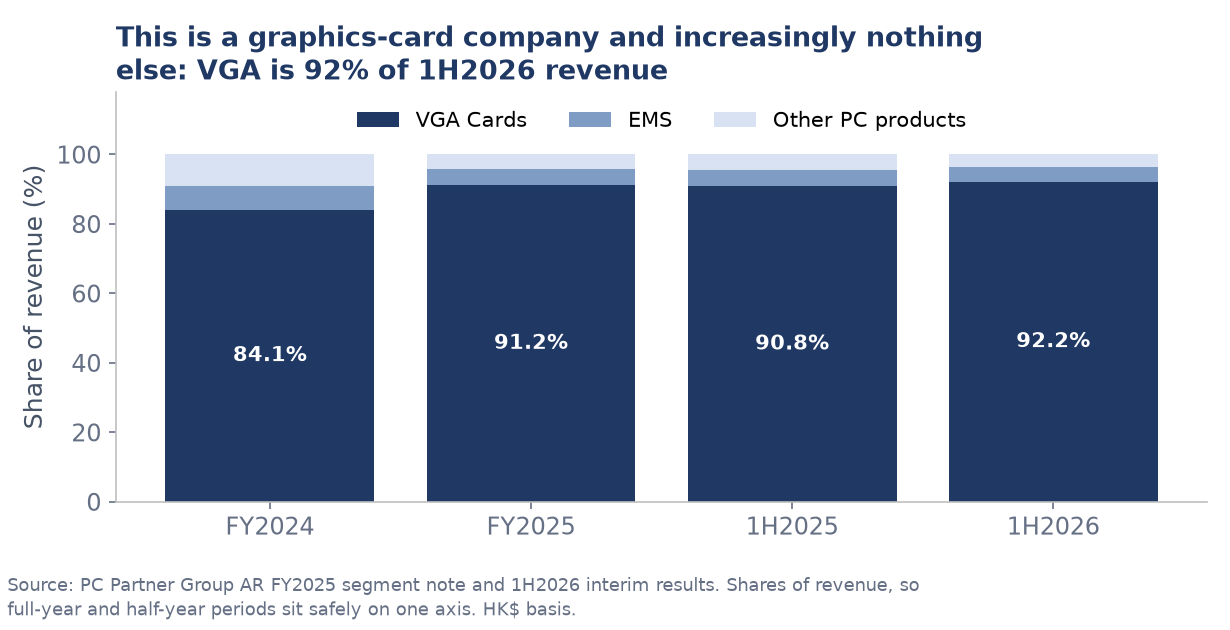
The mix is becoming less diversified, not more:
Share of revenue
FY2024
FY2025
1H2026
VGA (graphics) cards
84.1%
91.2%
92.2%
EMS (contract electronics)
6.7%
4.7%
4.2%
Other PC products and components
9.2%
4.1%
3.6%
Computed as each product line ÷ total revenue, from the disaggregation-of-revenue table in the segment note (AR FY2025 p.142; 1H2026 announcement p.16).
Revenue by product line, as a share of total. VGA cards are 92.2% of 1H2026 revenue.
The fifteen-year record
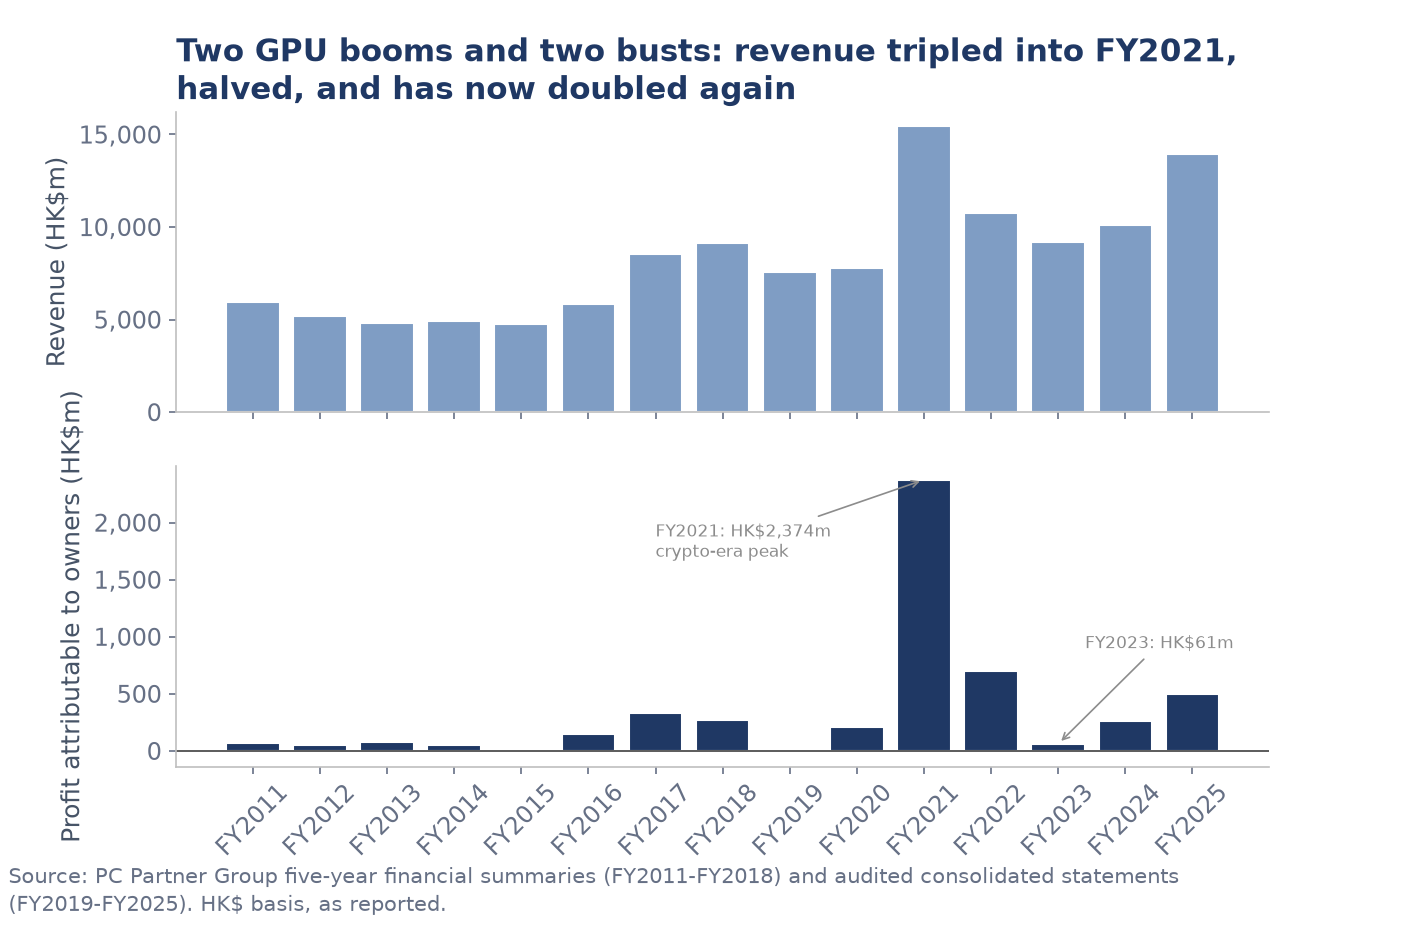
PC Partner has been listed since January 2012 and the full history is available. It is dominated by one year.
HK$m
FY2019
FY2020
FY2021
FY2022
FY2023
FY2024
FY2025
1H2026
Revenue
7,556
7,762
15,459
10,775
9,167
10,082
13,952
6,450
Gross profit
516
795
4,287
1,563
701
955
1,423
1,063
Gross margin
6.8%
10.2%
27.7%
14.5%
7.6%
9.5%
10.2%
16.5%
Profit to owners
10
207
2,374
702
61
262
494
546
Basic EPS (HK$)
0.03
0.56
6.21
1.81
0.16
0.68
1.27
1.406
Cumulative profit attributable to owners across FY2011–FY2025 was HK$5,093.2m. FY2021 alone was 46.6% of it. Cumulative revenue over the same fifteen years was HK$123,866.6m, so the revenue-weighted through-cycle net margin on the full record is 4.11% (5,093.2 ÷ 123,866.6). The median annual margin over the same fifteen years is 2.57% and the equal-weighted mean 3.02%; the three differ because revenue share and margin are strongly positively correlated for this issuer, so any revenue-weighted measure loads on the boom years. The company recorded a loss in FY2015 and came close to breakeven twice more, at HK$10.3m in FY2019 and HK$60.8m in FY2023.
Revenue and profit attributable to owners, FY2011–FY2025, as reported.Gross margin, full year and first half, plotted on separate panels sharing one scale.
Reported operating cash flow does not mean what a reader would assume
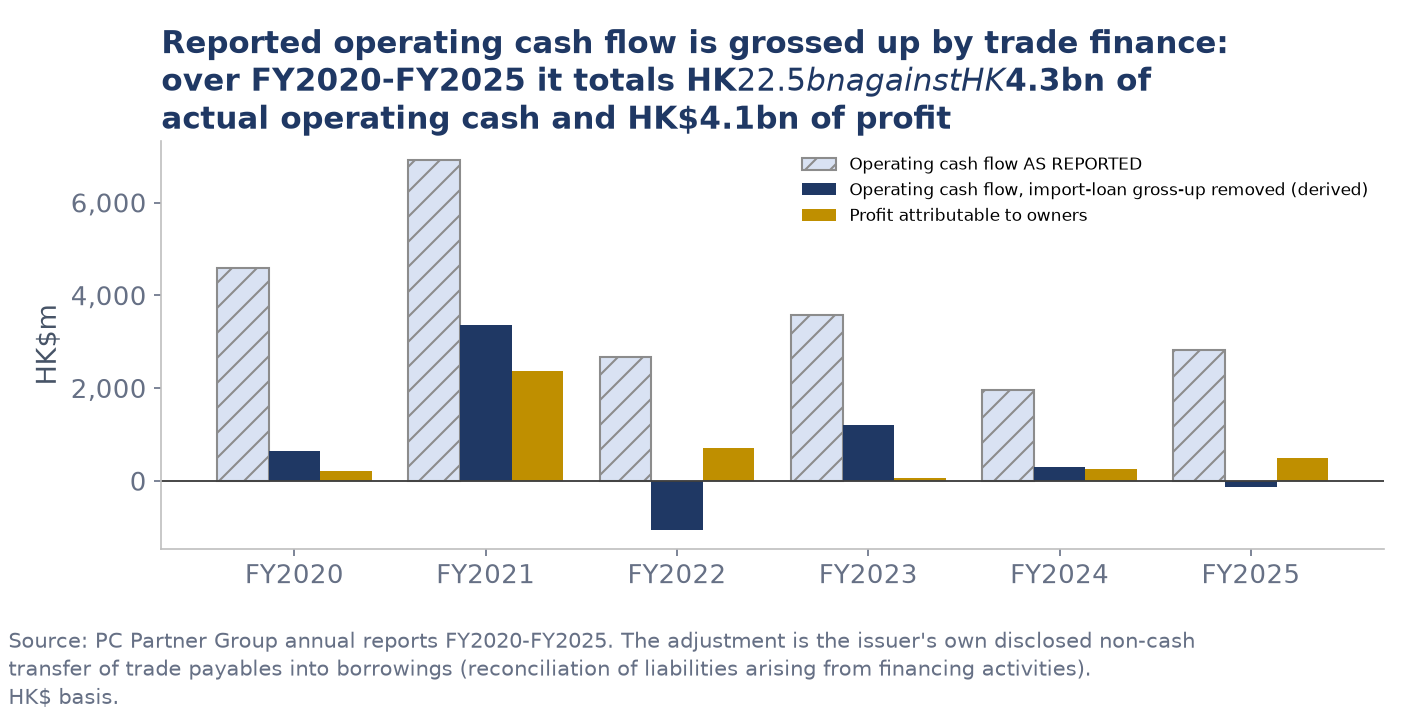
This is the single most consequential thing in the filings, and the issuer discloses every component needed to see it while never making the adjustment itself.
PC Partner settles supplier invoices with import loans. The bank pays the supplier; the group’s trade payable is extinguished and a borrowing appears in its place. No cash moves. In the cash flow statement that non-cash transfer is presented inside the operating “trade and other payables” line, while the later repayment of the loan appears as a financing outflow. The size of the transfer is disclosed each year in the reconciliation of liabilities arising from financing activities (note 33 in the FY2025 accounts, p.180).
Removing it gives an analytical operating-cash-flow proxy. This is a classification adjustment: the reported net change in cash remains as filed, so the arithmetic reconciliation is not independent validation:
HK$m
FY2020
FY2021
FY2022
FY2023
FY2024
FY2025
Cumulative
Operating cash flow as reported
4,579
6,923
2,673
3,580
1,955
2,815
22,525
Less: non-cash transfer of trade payables into borrowings
(3,941)
(3,572)
(3,738)
(2,367)
(1,655)
(2,944)
(18,217)
Operating cash flow, gross-up removed
638
3,351
(1,064)
1,212
300
(129)
4,309
Profit attributable to owners
207
2,374
702
61
262
494
4,101
Two facts follow, and they point in different directions. Cumulative reported operating cash flow of HK$22.5bn compares with HK$4.3bn once the gross-up is removed — a factor of five. But over the same six years that HK$4,309m of operating cash compares with HK$4,101m of profit, a ratio of 1.05x: the annual swings are working-capital timing, not accrual quality. FY2025’s negative HK$129m is the deliberate inventory build (inventories rose HK$849.8m, or 100.9%) plus receivables; 1H2026 swung back to a positive HK$587m.
Reported operating cash flow, the same figure with the disclosed non-cash transfer removed, and profit attributable to owners.
Where five years of cash went
HK$m, from the consolidated statements of cash flows in the FY2021, FY2023 and FY2025 annual reports. Cash and bank balances are as the statement defines them: net of pledged deposits and of time deposits with an initial maturity over three months.
HK$m
FY2021
FY2022
FY2023
FY2024
FY2025
Operating cash flow, as reported
6,922.8
2,673.0
3,579.8
1,954.8
2,815.4
Payments to acquire property, plant and equipment
56.1
538.9
35.6
140.8
33.7
Prepayments to acquire property, plant and equipment
10.4
5.7
11.0
6.3
8.6
Proceeds from disposal of property, plant and equipment
126.3
0.4
0.0
0.3
0.4
Dividends paid to owners
410.3
934.3
135.8
155.2
155.2
Repayment of import loans
3,889.1
2,887.3
3,119.2
1,812.9
2,460.0
Proceeds from bank loans
–
193.9
–
–
–
Repayment of bank loans
53.0
1.3
7.8
7.8
7.8
Repayment of lease principal
28.9
30.5
31.4
33.2
42.5
Issue of new shares
24.6
0.5
0.3
–
–
Cash and cash equivalents at year end (excluding pledged and over-three-month deposits)
3,764.8
2,207.0
2,100.4
2,177.4
2,506.3
The repayment of import loans is the financing-side proof of the gross-up above. It appears in every one of the five years, and in four of them there is no matching drawdown line anywhere in the statement — because the drawdowns are the non-cash transfers out of trade payables that inflate reported operating cash flow. Over the five years the group repaid HK$14.17bn of import loans. Over the same five years the transfers into those borrowings, from the table above, total HK$14.28bn. The two figures are within 0.8% of each other, which is what one expects of a facility whose balance barely moved: the money is the same money, counted once as an operating inflow and once as a financing outflow, and neither line can be understood from its own side of the statement.
Capital spending happened twice and was two different things. FY2022 spent HK$538.9m — four to sixteen times any other year in the table — and the property, plant and equipment note shows HK$403.1m of that went into leasehold land and buildings, with HK$84.7m of plant and machinery behind it. FY2024’s additions were HK$149.5m — HK$101.5m of plant and machinery and HK$26.3m of improvements — of which HK$140.8m was paid in cash that year, the difference being prepayments made in FY2023 and capitalised in FY2024. FY2022 needs no such distinction: its additions and its cash payment are the same HK$538.9m. The two are not the same project. The FY2022 building is a single office floor in Kowloon — about 18,572 square feet at roughly HK$387.9m, plus twenty car parking spaces — bought to relocate the head office and cut rent, and carried since as pledged office premises. The FY2024 machinery went to Batam: the company puts about HK$107.1m into three production lines and renovation at the new Indonesian facility, and about HK$16.2m into the new Singapore head office. The company’s own capital expenditure disclosure for FY2022 is a single sentence giving the total and nothing else; the composition is only in the note.
The dividend followed the profit down with a one-year lag, and then stopped moving. HK$934.3m was paid out in FY2022 — the largest single line in the table after the loan repayments, and 39% of FY2021’s HK$2,374m attributable profit, paid in the year after that profit was earned. FY2023’s payment then fell 85% to HK$135.8m, and FY2024 and FY2025 were HK$155.2m each — the same figure twice, against attributable profits of HK$262m and HK$494m. Cumulatively HK$1.79bn of dividends across FY2020–FY2025 — FY2020 itself paid none — against HK$4.10bn of attributable profit and HK$4.31bn of operating cash flow over the same six years once the gross-up is removed. That is a 44% payout of profit, and 42% of the cash the business actually produced.
Cash and bank balances have fallen in every year but the last two: HK$3.76bn at the end of FY2021, HK$2.21bn a year later, and HK$2.51bn now. The HK$1.56bn fall in FY2022 is accounted for almost entirely by the dividend and the building: HK$934.3m and HK$538.9m together are HK$1.47bn, in a year when reported operating cash flow was HK$2.67bn and the same year’s gross-up was HK$3.74bn — that is, the underlying operating cash flow was negative.
The Hong Kong to Singapore move was about GPU supply, and the company says so
The circular convening the EGM to approve the HKEX withdrawal (18 September 2025) states the Singapore primary listing was expected to bring “enhanced flexibility in procurement of high-end GPUs from its key suppliers”, and warns there is “no guarantee that the Group will not be affected by future changes to trade restrictions and tariffs” (pp.10–11). The FY2025 chairman’s statement is more direct: the listing transition and headquarters relocation “restored PC Partner’s access to NVIDIA’s flagship RTX 5090 graphics processing unit” (p.8).
The effect is quantified in the same report: the RTX 5090 series contributed HK$1,687.2m of revenue in FY2025, 15.8% of own-brand graphics-card revenue (p.15).
Sequence, from the filings: SGX secondary listing by introduction 15 November 2024; conversion to primary listing announced 8 August 2025; EGM approval and HKEX Listing Committee approval, autumn 2025; last day of dealing on HKEX 8 January 2026; listing withdrawn 14 January 2026.
A disclosure that existed at IPO and no longer does
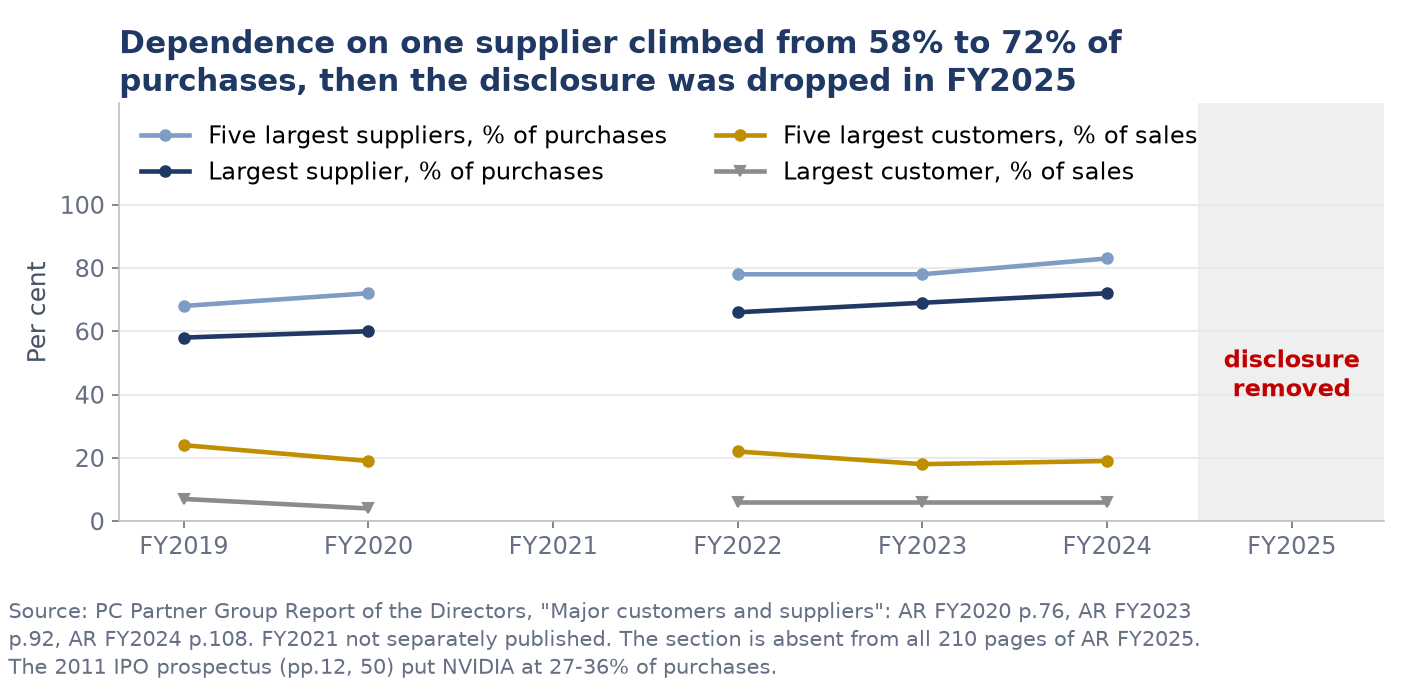
The 2011 HKEX listing prospectus disclosed the group’s supplier concentration in detail: NVIDIA alone was 27%, 36%, 33% and 28% of total purchases across FY2008–1H2011, and “AMD and NVIDIA together supplied all of the discrete GPUs used by the Group” (pp.12, 50, 165). The HKEX-format annual reports then carried a “Major customers and suppliers” table in the Report of the Directors every year:
% of purchases / sales
FY2019
FY2020
FY2022
FY2023
FY2024
FY2025
Largest supplier
58%
60%
66%
69%
72%
not disclosed
Five largest suppliers
68%
72%
78%
78%
83%
not disclosed
Largest customer
7%
4%
6%
6%
6%
not disclosed
Five largest customers
24%
19%
22%
18%
19%
not disclosed
Report of the Directors, “Major customers and suppliers”: AR FY2020 p.76, AR FY2023 p.92, AR FY2024 p.108. The section is absent from the FY2025 annual report across all 210 pages.
Supplier and customer concentration as disclosed in the Report of the Directors, and the FY2025 gap where the table used to be.
Two things are visible in that table. Dependence on a single supplier rose monotonically from roughly a third of purchases at listing to 72% by FY2024, with the top five at 83% — while the customer book moved the other way. And the FY2025 annual report, the first prepared in SGX format, dropped the table entirely, along with the five-year financial summary: the Report of the Directors required under the Hong Kong Companies Ordinance was replaced by a Directors’ Statement that does not carry it. The SGX rulebook does not require what the Hong Kong one did, so nothing improper follows — but the effect is that the concentration which drives this company’s cost base stopped being visible in the same year its results turned on it.
Customer concentration moved the other way, and improved markedly. The prospectus disclosed the top five customers at 39–44% of turnover and the largest single customer at 10–16%. The FY2025 and FY2024 accounts state that no customer contributed 10% or more of revenue in either year (AR FY2025 p.143).
What happened in the first half of 2026
Revenue was essentially flat at HK$6,450.2m (+1.5%), but gross profit rose 58.7% to HK$1,062.8m and profit attributable to owners rose 117.9% to HK$545.5m. Gross margin went from 10.5% to 16.5%.
The company attributes this to average selling prices. Its own disclosures, from the MD&A (pp.30–31):
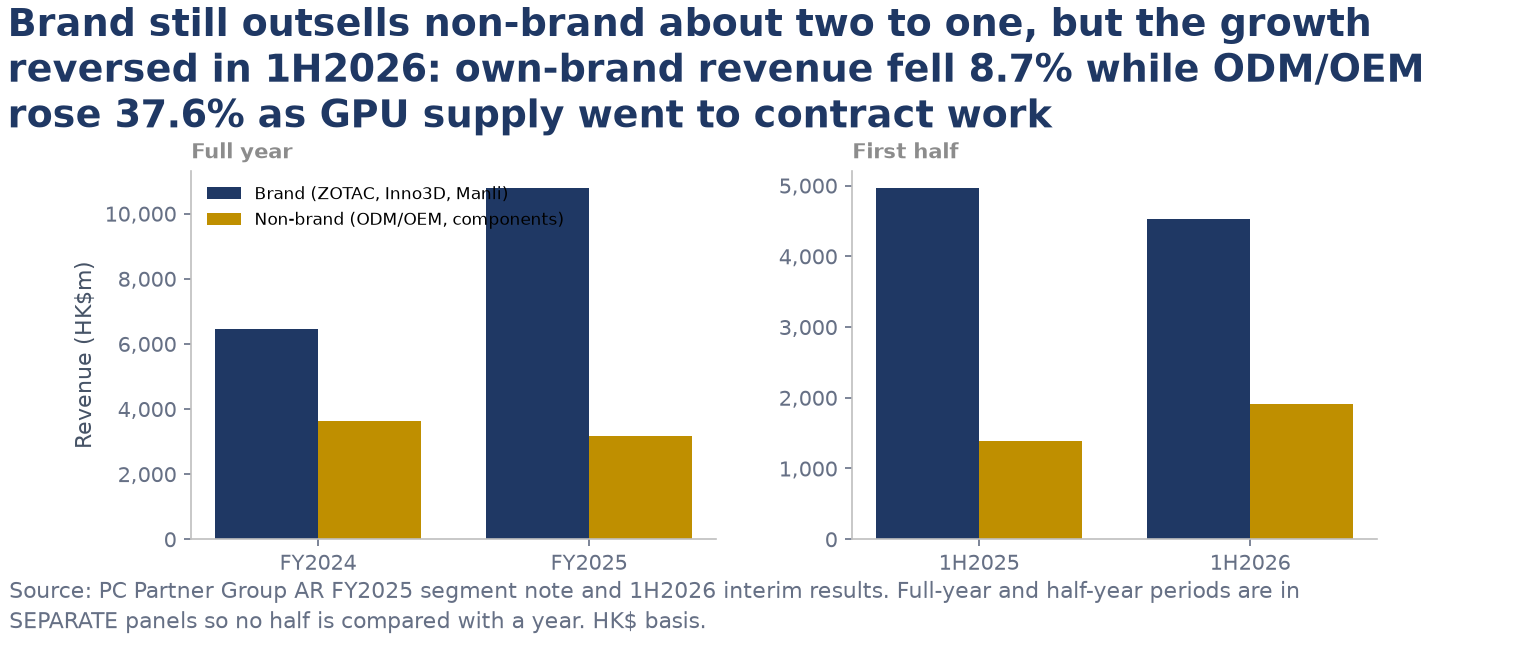
Own-brand graphics cards: revenue −9.2%, volume −18.4%, ASP +10.7%.
ODM/OEM graphics cards: revenue +73.9%, volume −38.4%, ASP +181.0% — the group states it was awarded more orders on high-end cards.
Raw material cost fell from 87.1% to 81.7% of sales.
Context from the balance sheet, which the company set up in advance: the FY2025 report states the group “intended to be more proactive on GPU management by holding up more inventories due to an expected supply constraint that could happen in FY2026” (p.20). Inventories doubled to HK$1,692.1m at 31 December 2025. Customer prepayments (contract liabilities) then rose 215.7% to HK$193.2m by 30 June 2026.
Management’s own outlook, filed 14 August 2026: graphics memory costs are expected to rise further; graphics-card shipment volumes fell substantially in 1H2026 versus 2H2025 and availability is likely to decline further in 2H2026; entry-level cards face the most severe shortages; a new GPU-server and AI-related business is scheduled to begin shipments in 2H2026; and the group “remains confident in achieving overall sales revenue growth in 2026” while 2H2026 “seems to be challenging as compared to the first half year”.
In the issuer’s 18 August 2026 results briefing, management narrowed that outlook to low-single-digit FY2026 revenue growth. It expected roughly 10% further GPU-allocation decline in 2H2026 versus 1H2026, an approximately 18% VGA average-selling-price increase, and the new GPU-server business to contribute above 15% of 2H2026 revenue. EMS and other PC-related sales were expected to fall 5%–10% from 1H2026. Management said gross margin “may sustain” and year-end net cash should remain strong, while describing FY2027 gaming-GPU, graphics-memory, system-memory and storage supply as tight and expensive. These are issuer statements, not analyst estimates.
The 24 April 2026 AGM minutes and shareholder Q&A add useful context. Management attributed FY2025’s margin improvement to new Blackwell products and the removal of U.S. trade restrictions after the headquarters move, declined to issue quantitative guidance at the meeting, described FY2021 as exceptional COVID-19 and cryptocurrency-mining demand, said it does not track costs or prepare profit-and-loss statements by product segment, stated a dividend-payout policy around 30%–40%, and said it intended to preserve a strong cash position for resilience and supplier opportunities.
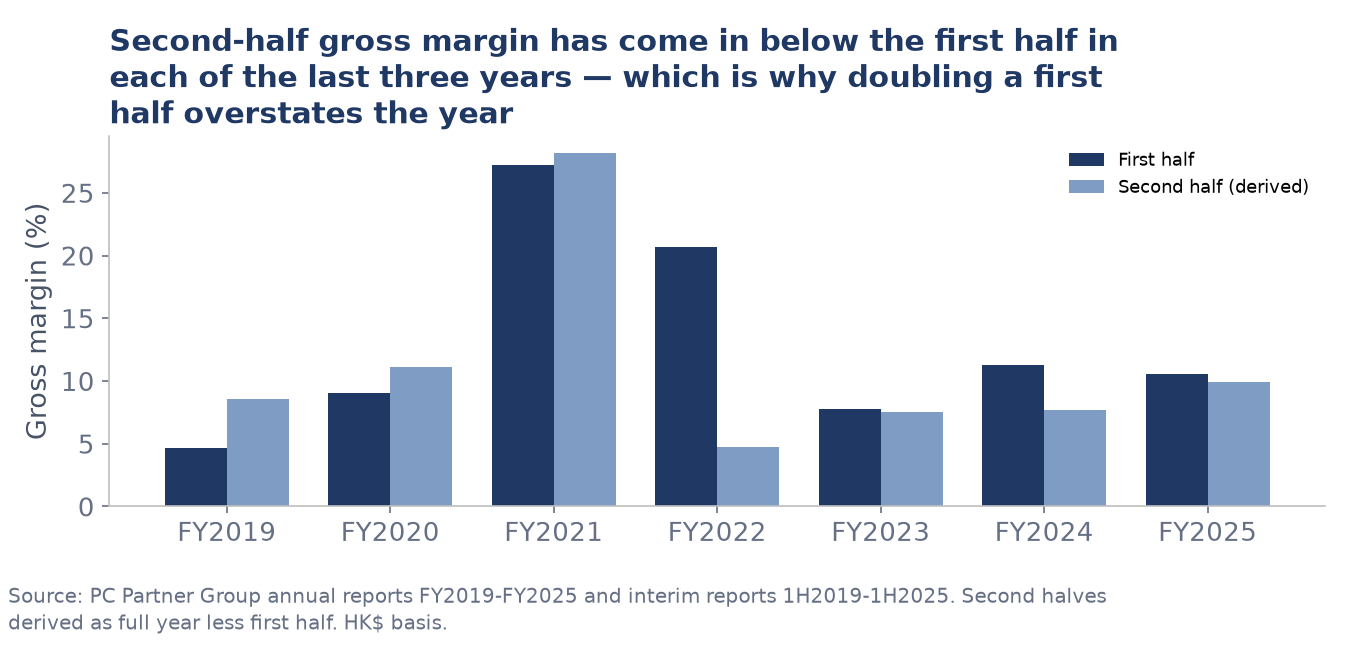
Brand and non-brand revenue. Full-year and half-year periods are shown in separate panels so no half is compared against a year.First-half against second-half gross margin. The second half came in below the first in FY2023, FY2024 and FY2025.
Balance sheet
At 30 June 2026 the group held cash and bank balances of HK$2,899.1m against borrowings of HK$1,339.3m and lease liabilities of HK$55.0m — net cash of HK$1,504.7m, or HK$3.88 per share on 387,883,668 shares. Equity attributable to owners was HK$3,495.5m; net asset value per share HK$9.01, as stated by the company.
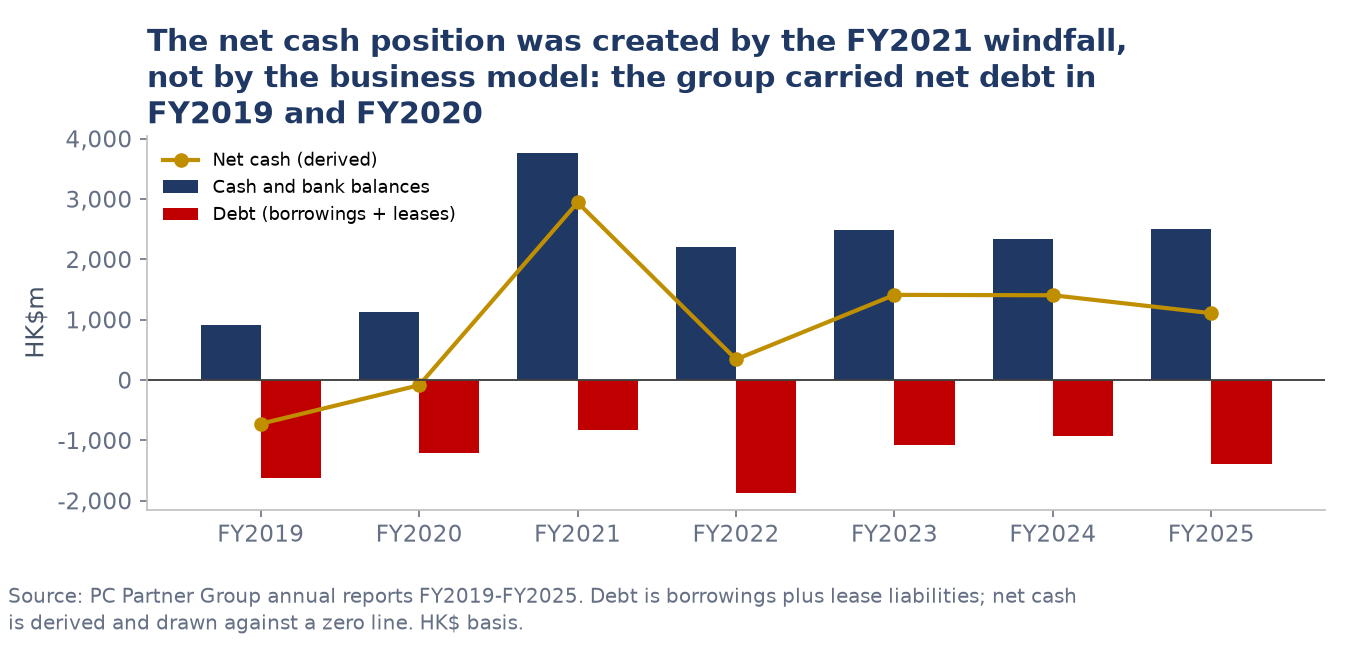
Computed on the same basis, however, the group was in net debt of HK$727m in FY2019 and HK$87m in FY2020, and moved to HK$2,941m of net cash in FY2021. The current position dates from that year.
HK$m, year end
FY2019
FY2020
FY2021
FY2022
FY2023
FY2024
FY2025
Net cash / (net debt)
(727)
(87)
2,941
341
1,410
1,404
1,106
Cash and bank balances less borrowings less current and non-current lease liabilities, each as reported.
Cash, debt and derived net cash, FY2019–FY2025.
Three features of the funding structure are worth stating plainly:
All borrowings are repayable on demand. The note states banks hold an overriding right of repayment on demand “irrespective of whether the Group has complied with the covenants and met the scheduled repayment obligations”, which is why the entire balance is classified as current (AR FY2025 p.173). Undrawn facilities were HK$1,492.4m at 30 June 2026.
A supplier-finance arrangement appeared for the first time in FY2025. HK$348,439,000 of trade payables had their due date extended from 30 days to 150 days; the comparative figures at 31 December 2024 and 1 January 2024 are nil. The separate import-financing facility has a maximum tenor of 120 days (AR FY2025 p.174).
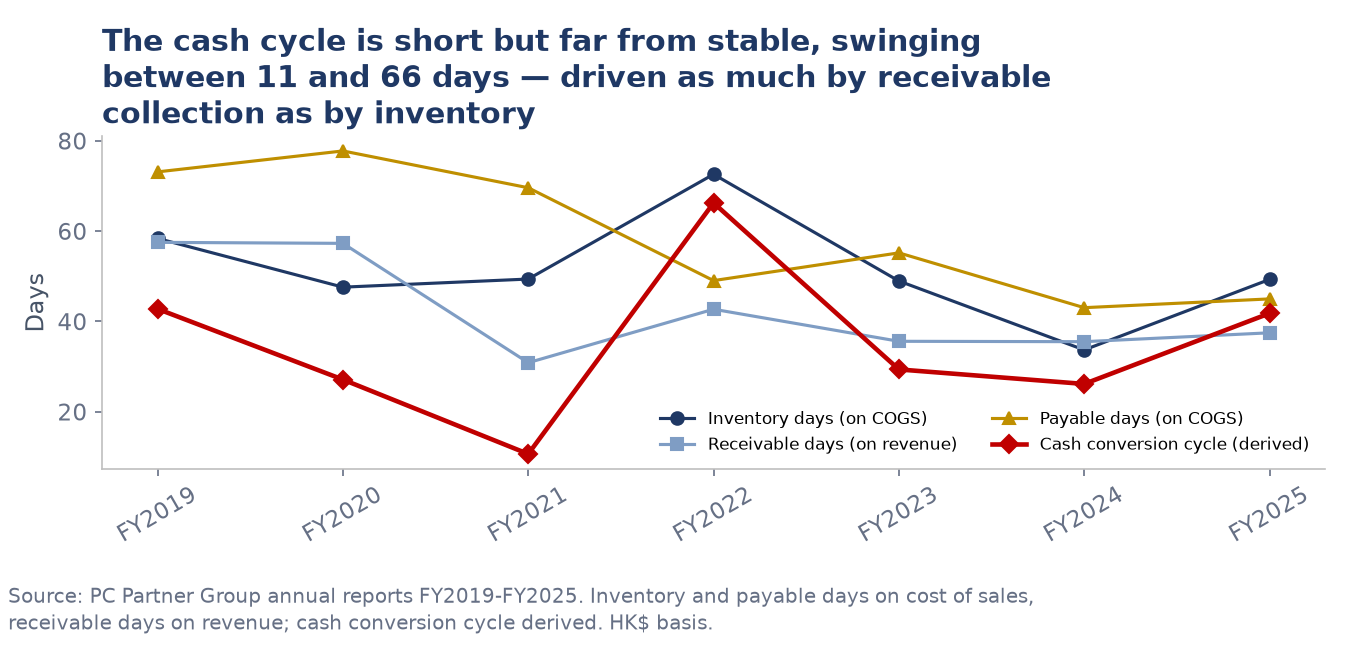
Trade receivables carry a 27.5% accumulated impairment — HK$318.6m against HK$1,157.8m gross at 30 June 2026 (21.8% at 31 December 2025). This dates from FY2021, when HK$321.7m of impairment losses on financial assets were recognised. Current ageing is clean: 98% of the net balance is within three months.
Working-capital days and the derived cash conversion cycle, which has ranged from 10.6 to 66.2 days.
Accessible liquidity and financing-substance debt
The June 2026 balance sheet reports HK$2,899.1m of cash and bank balances, but the cash-flow statement identifies HK$2,819.4m of cash and cash equivalents after excluding HK$79.6m of pledged and greater-than-three-month deposits. Against HK$1,339.3m of bank borrowings and HK$55.0m of lease liabilities, this produces accounting net cash of HK$1,425.1m and cash coverage of accounting debt of 2.02x.
Cash location matters: the company-only balance sheet reports HK$110.8m of cash at the parent and HK$540.2m due from subsidiaries, versus HK$2,899.1m of gross cash at the group. The filings do not provide a complete legal-entity, currency, restriction and upstreaming map, so consolidated cash is not the same thing as demonstrated freely accessible parent liquidity.
HK$m unless stated
FY2025
1H2026
Definition / limitation
Accounting gross debt
1,400.5
1,394.3
Bank borrowings plus leases
Cash used for liquidity
2,506.7
2,819.4
1H2026 uses cash equivalents, not gross cash
Accounting net cash
1,106.1
1,425.1
Cash less accounting debt
Supplier finance reclassified as debt
348.4
not disclosed
FY2025 payment terms extended from 30 to 150 days
Economic gross debt
1,749.0
not fully measurable
Accounting debt plus quantified supplier finance
Economic net cash
757.7
not fully measurable
No assumption that the missing 1H2026 balance is zero
The contractual bank-debt schedule at 30 June 2026 is HK$1,181.6m within one year and HK$157.7m in the following year, although the lender demand clauses cause the whole HK$1,339.3m balance to be classified as current; a demand-adjusted 12-month sources-and-uses test therefore counts the full amount. The group also disclosed HK$1,492.4m of undrawn facilities. The filings do not state whether those lines are committed, what conditions apply to drawing them, or how their covenants are defined, so the amount alone does not establish stress liquidity.
On the cash-flow side, the central 1H2026 bridge is HK$2,501.7m reported operating cash flow less HK$1,914.7m of derived non-cash import-loan drawdown, leaving a central HK$587.0m analytical CFO proxy. The proxy assumes implied new import financing settled trade balances; it is not an issuer-reported reclassification or the supplier-finance balance. Because the interim has no financing-liabilities reconciliation, alternative payables and import-loan balance methods produce a HK$583.1m–589.8m range. The central estimate is 1.08x profit attributable to owners for the half.
Ownership and governance
The annual-report statistics of shareholdings are dated 2 March 2026 (AR FY2025 pp.206–209), not the current date. At that cutoff there were 387,883,668 shares in issue, no treasury shares and one vote per share. Chairman and CEO Wong Shik Ho Tony held 14.284% directly; Wong Fong Pak 7.126%; Leung Wah Kan 6.471%; Ho Nai Nap 5.525%; and Rays Capital Partners Limited 5.137%. Multiple subsequent substantial-holder Form 3 filings, including an LC Capital filing on 13 August 2026, mean those percentages should not be presented as current until the forms are re-keyed.
Mrs Ho Wong Mary Mee-Tak is retained as a 14.19% substantial shareholder pending contrary evidence. Her director-cessation filing states that she retained her direct interest in 55,050,000 shares; the nil year-end directors’ table records that she was no longer a director, not that she sold the shares. No disposal filing was located in the 20 August cutoff sweep.
The board was reconstituted for the SGX listing: three long-serving Hong Kong independent non-executive directors were replaced by six Singapore-based independents. Directors’ fees rose from HK$1,556,000 in FY2024 to HK$12,993,000 in FY2025; key management personnel compensation was HK$83,541,000 against HK$66,411,000 (AR FY2025 p.182).
From the FY2018 Report of the Directors (p.53): during that year the company repurchased 74,700,000 shares at HK$5.00 per share from “the substantial shareholder of the Company”, an aggregate HK$373,500,000 paid out of retained profits, with all repurchased shares cancelled on delivery. The counterparty is not named in that passage. Equity fell from HK$1,208.0m to HK$877.3m that year despite HK$270.8m of profit.
Contingent liability
Graphics cards imported into the United States between 30 July 2020 and 2 January 2023 were declared under the tariff code for video game consoles. US Customs and Border Protection determined they fall under HTSUS 8473.30.1180, within List 3 of Section 301 of the US Trade Act of 1974, attracting a 25% tariff. The estimated exposure is US$25m (approximately HK$198.1m). The group filed a litigation protest in July 2024 and has paid US$11.8m (approximately HK$92.3m), which it carries as an other receivable rather than an expense. As at the 1H2026 announcement there was no further update from CBP (1H2026 announcement p.29).
The share price and what came with its moves
Over the window PC Partner returned +265.3% on a dividend-adjusted basis; the Straits Times Index returned +52.0% and the median of the 3 listed comparisons −2.6%.
Click a quarter — on the chart or in the return strip under it — to read its filings beside its large moves.
Key: PC Partner (PCT) as a solid line; Straits Times Index rebased, dashed; peer median rebased, dotted; the benchmark runs off scale Apr 25–Apr 25 and is clipped there; the peer median runs off scale Apr 25–Aug 26 and is clipped there; filing ticks above the axis; ex-dividend ticks on it; numbered pins are moves with a written note; plain dots are other detected moves.
Until 8 January 2026 the same share traded on HKEX with far more liquidity than on SGX (SGX public float 3.2% of issued shares at August 2025), so SGX-line moves on thin volume before then are partly a matter of which market printed.
Key moves
The five largest moves over a day or up to two weeks, with no day counted twice.
Each move is shown next to the market over the same days (and peers, where shown). News listed with a move was published within its dates; that does not mean the news caused the move. The quarter view has all the news.
Index: Straits Times Index. Peers: the median of three listed companies used as a sector check; the notes name them and their limits.
Q4 2024
20 Nov 2024 – 31 Dec 2024 (part quarter)
PCT +4.2%STI +1.2%Peer median +19.0%Range S$0.81–S$0.88Close S$0.88
The board said the amendments to the memorandum and articles were being made 'in preparation for the conversion' of the SGX-ST listing from secondary to primary, to satisfy both the HKEX Listing Rules and the SGX-ST Listing Manual, and that SGX Listing Decision LD-2024-01 requires a converting issuer to have an SGX-compliant auditor in place for the year of conversion (expected FY2025). BDO Limited (Hong Kong) would remain as joint auditor. Both resolutions passed at the EGM of 20 December 2024, the articles unanimously and the auditor appointment with 99.89% in favour.
Next session (27 Nov): PCT +5.6% · STI −0.1% · peers +1.5%
Large price moves
127 Nov 2024 · +6% · index 0% · peers +2%
Q1 2025
2 Jan 2025 – 28 Mar 2025
PCT +73.7%STI +4.9%Peer median +3.9%Range S$0.90–S$2.20Close S$1.52
The board attributed the change to an improved gross margin on 'strong demand' for the video-graphics-card series launched in early 2024, and to lower sales and marketing spending in the own-brand business because demand no longer needed stimulating. Figures were unaudited; full results were promised before the end of February 2025.
Next session (14 Feb): PCT −7.0% · STI −0.1% · peers +4.0%
Video-graphics-card revenue rose 16.7% to HK$8,481.8m: own-brand cards up 11.6% to HK$6,318.1m on PRC volume and NVIDIA 'SUPER' series cards, ODM/OEM cards up 34.8% to HK$2,163.7m on higher-ASP projects including the 'RTX4090 D' for the PRC. EMS fell 8.5% to HK$676.4m and other PC products fell 20.5%. APAC rose 33.0% and the PRC 6.4%; NALA slipped 0.5% and EMEAI fell 11.9% without RTX 4090 cards under trade restrictions. Administrative expenses rose 20.1% on bonuses and Singapore-listing fees; HK$123.3m went on the Singapore headquarters and the Batam, Indonesia plant and HK$21.4m on the listing. Operating cash flow was HK$1,954.8m (FY2023: HK$3,575.1m); cash and equivalents HK$2,177.4m against bank borrowings of HK$819.5m; inventories fell 25.8% to HK$842.3m on a fourth-quarter GPU shortage. With the HK$0.20 interim, the full-year payout is HK$0.35 (computed; FY2023: HK$0.30).
Guidance: The company said Blackwell cards launched in January 2025 'will trigger strong demand', and that the Batam plant lets it assemble product for the US market outside China after the 4 February 2025 tariff order.Next session (3 Mar): PCT +2.2% · STI +0.3% · peers −1.3%
Large price moves
2week to 3 Jan 2025 · +11% · index +1% · peers −1%
33 Feb 2025 · +6% · index −1% · peers 0%
4week to 7 Feb 2025 · +13% · index 0% · peers +16%
512 Feb 2025 · +8% · index 0% · peers +8%
614 Feb 2025 · −7% · index 0% · peers +4%
719 Feb 2025 · +11% · index 0% · peers +3%
820 Feb 2025 · +14% · index 0% · peers 0%
9week to 21 Feb 2025 · +30% · index +1% · peers +4%
1025 Feb 2025 · +9% · index 0% · peers 0%
11week to 7 Mar 2025 · +12% · index +1% · peers 0%
1210 Mar 2025 · +21% · index 0% · peers −1%
1311 Mar 2025 · +18% · index −2% · peers −1%
14week to 14 Mar 2025 · +30% · index −2% · peers 0%
15week to 21 Mar 2025 · −10% · index +2% · peers +3%
1628 Mar 2025 · −12% · index 0% · peers −3%
17week to 28 Mar 2025 · −17% · index +1% · peers −10%
Q2 2025
1 Apr 2025 – 30 Jun 2025
PCT −20.9%STI −0.2%Peer median −13.4%Range S$1.08–S$1.57Close S$1.18
Approved at the AGM of 25 April 2025 with 100% of votes cast; record date 19 May and payment on 6 June 2025. The chart's return series is adjusted for it.
The company cited personal commitments and said she had no disagreement with the board. Her departure left the board with five executive directors and seven independent non-executive directors; the updated board list was filed on 11 September 2025.
Large price moves
187 Apr 2025 · −24% · index −8% · peers −22%
Q3 2025
1 Jul 2025 – 30 Sep 2025
PCT −5.1%STI +8.5%Peer median +30.0%Range S$1.08–S$1.37Close S$1.08
The board attributed the increase to a significant rise in revenue on 'strong demand' for the RTX 50 series cards launched in the first half. Interim results were promised for August 2025.
Next session (21 Jul): PCT +3.0% · STI +0.4% · peers −2.2%
At the 16 May 2025 waiver application 205,007,103 shares (52.86%) were on the CDP register but only 14,572,500 (3.76%) were held by SGX public shareholders against the 10% Rule 723 requirement, with 47.14% held by the HKEX public; by 8 August the SGX public figure was 3.22%. The waiver runs nine months from the conversion date and requires a market maker until the company complies and the HKEX 25% float until the HKEX delisting, which the company said it envisaged completing within the grace period, subject to shareholder and HKEX approval, with untransferred HKEX shares moved automatically to the Singapore register about four months after shareholder approval. A 14 August waiver of Rule 730A(1) allowed the delisting EGM to be held in Hong Kong.
Next session (11 Aug): PCT −1.6% · STI −0.2% · peers +3.4%
Own-brand graphics cards rose 62.1% to HK$4,917.0m on the RTX 50 launch and regained access to the RTX 5090 GPU, which the company linked to the headquarters move to Singapore and the SGX listing. ODM/OEM cards fell 19.1% to HK$853.3m as a mix-driven ASP decline outweighed volume growth; EMS fell 14.9% and other PC products 43.0%. All regions grew: APAC 17.6%, NALA 44.9%, PRC 24.3%, EMEAI 45.8%. The margin slip was attributed to higher RTX 50 material costs and fewer high-margin EMS and other sales. Inventories rose 91.0% to HK$1,608.4m and bank borrowings 34.3% to HK$1,100.5m to fund GPU procurement; cash and equivalents were HK$1,978.4m, net cash to equity 30.5% (49.0% at December); operating cash flow HK$670.3m. The board meeting had been postponed from 14 to 19 August to finalise information for the announcement.
Guidance: RTX 50 demand 'is likely to remain strong' in 2H2025, with global chip supply competing against AI demand named as the constraint on growth; the company had joined the NVIDIA Partner Network and said it would proceed with the HKEX delisting 'within this year'.Next session (20 Aug): PCT −4.7% · STI +0.1% · peers +2.4%
The four Form 1 notices record disposals of 10,000,000 shares on 28 August for HK$60,000,000, 15,000,000 on 3 September for HK$90,000,000, 19,050,000 on 10 September for HK$111,758,730 and 11,000,000 on 11 September for HK$64,532,600: 55,050,000 shares for HK$326.3m in total (computed), the last on the day her resignation took effect. Over the same weeks the chairman, Wong Shik Ho Tony, filed a run of notices recording share loans and returns under a securities borrowing and lending agreement, with his 14.28% interest unchanged.
Next session (2 Sep): PCT +0.9% · STI +0.5% · peers −2.9%
The company, dual-primary-listed since 20 August, said the delisting was 'expected to further strengthen the view of the Group being headquartered in Singapore', which 'will in turn enhance the Company's flexibility for the procurement of high-end GPUs from its key suppliers', and would cut the cost of maintaining two listings. No shareholder was required to abstain. After delisting, HKEX holders could keep their shares in scrip or deposit them with CDP to trade on SGX; the company bore removal costs for documents submitted by 9 March 2026.
Next session (15 Sep): PCT +3.5% · STI −0.1% · peers −0.2%
Record date 18 September (Singapore) and payment on 10 October 2025. The chart's return series is adjusted for it; see the notes on the adjusted series around this date.
Q4 2025
1 Oct 2025 – 31 Dec 2025
PCT −16.7%STI +8.0%Peer median −18.6%Range S$0.84–S$1.28Close S$0.90
The three-month notice period runs to 7 January 2026. The HKEX Listing Committee approved the withdrawal on 30 October 2025 (announced 3 November). On 1 December the company reminded holders that the Hong Kong register would close on 23 March 2026, with remaining shares transferred automatically to the Singapore register in scrip form, not tradable until deposited with CDP.
He chairs the remuneration committee; the board said the role carries no separate responsibility or liability and is a channel between the independent directors and shareholders. The board comprised five executive and seven independent directors.
Large price moves
198 Oct 2025 · +13% · index 0% · peers −1%
Q1 2026
2 Jan 2026 – 31 Mar 2026
PCT +42.2%STI +5.1%Peer median −15.3%Range S$0.91–S$1.56Close S$1.28
Dealings on HKEX ceased on 8 January (confirmed in a midday notice on 13 January). The Hong Kong branch register closes at 4 p.m. on 23 March 2026, with names transferred automatically to the Singapore register; the company-borne removal-cost offer ran from 15 November 2024 to 9 March 2026. From 14 January 2026 the company has a single primary listing on SGX.
Next session (8 Jan): PCT −2.0% · STI −0.2% · peers −2.2%
The board attributed the change to higher revenue and an improved gross margin on 'strong demand' for the Blackwell series cards launched in the first quarter of 2025. The notice was broadcast at 12:01, in the midday break, in the first week without an HKEX line.
Next session (21 Jan): PCT +0.7% · STI −0.4% · peers +2.4%
The company said a Hong Kong-registered joint auditor was no longer required after the HKEX delisting, that there were no disagreements on accounting treatments in the prior 12 months and no claims for fees or compensation.
Own-brand graphics cards rose 68.9% to HK$10,669.7m on volume up 32.0% and ASP up 28.0%, with the RTX 5090 contributing HK$1,687.2m; ODM/OEM cards fell 5.1% to HK$2,053.0m on ASP and high-end GPU supply constraints; EMS fell 2.5% and other PC products 38.3%. Second-half revenue was HK$7,596.4m (up 47.9%) with profit after tax of HK$243.2m (2H2024: HK$68.4m). Income tax of HK$145.0m included a HK$63.4m settlement with the Hong Kong Inland Revenue for 2017/18 to 2024/25 after the 50% offshore manufacturing-profit claim was disallowed, plus HK$4.4m of Pillar Two top-up. Operating cash flow HK$2,815.4m; cash and equivalents HK$2,506.4m; bank borrowings up 58.9% to HK$1,302.0m to fund GPU purchases; inventories doubled to HK$1,692.1m; capex HK$39.0m (FY2024: HK$149.5m). Dividends are now declared in S$; the special was 'to express its gratitude' for the share migration from Hong Kong.
Guidance: 'Cautiously optimistic' for 2026: memory makers diverting output to AI high-bandwidth memory had pushed graphics-memory prices up, and the company expected graphics-card price rises to compensate for lower volumes until supply improves; it was building an AI-server business as an NVIDIA Partner Network integration partner.Next session (2 Mar): PCT +6.8% · STI −2.1% · peers −3.9%
Large price moves
207 Jan 2026 · +9% · index 0% · peers 0%
219 Jan 2026 · +15% · index 0% · peers −1%
22week to 9 Jan 2026 · +22% · index +2% · peers −3%
2314 Jan 2026 · +8% · index 0% · peers 0%
2420 Jan 2026 · +21% · index 0% · peers −3%
25week to 23 Jan 2026 · +22% · index +1% · peers −2%
269 Feb 2026 · +11% · index +1% · peers +1%
Q2 2026
1 Apr 2026 – 30 Jun 2026
PCT +137.6%STI +5.8%Peer median −8.4%Range S$1.35–S$3.02Close S$2.89
The Singapore fund manager, holding through sub-funds of a VCC over which it has investment discretion, notified further purchases on 20 April (to 6.22%), 7 May (7.18%), 10 June (8.09%), 6 July (9.02%) and 14 July (11.01%), and increases on 13 July and 11 August from discretionary mandates over additional client accounts, reaching 46,839,100 shares (12.07%). Separately, RAYS Capital Partners crossed 5% on 15 September 2025 and fell back to 4.82% on 26 February 2026.
Both approved at the AGM of 24 April 2026 with 100% of votes cast; record date 18 May and payment on 5 June 2026. Scrip holders were paid in HK$ at HK$1 = S$0.16549. The chart's return series is adjusted for it.
Large price moves
2720 May 2026 · +10% · index −1% · peers 0%
2829 May 2026 · +10% · index +1% · peers −1%
29week to 29 May 2026 · +21% · index −1% · peers +6%
302 Jun 2026 · +10% · index +1% · peers +3%
3125 Jun 2026 · +12% · index 0% · peers −2%
Q3 2026
1 Jul 2026 – 21 Aug 2026 (part quarter)
PCT −4.5%STI +10.0%Peer median −0.6%Range S$2.42–S$3.23Close S$2.76
The board attributed the change 'primarily' to higher average selling prices of branded products, which had strengthened the gross margin. Interim results were promised for August 2026.
Next session (17 Jul): PCT −2.3% · STI −0.5% · peers −5.8%
Own-brand graphics cards fell 9.2% to HK$4,462.5m as volume dropped 18.4% on GPU and graphics-memory shortages while ASP rose 10.7%; ODM/OEM cards rose 73.9% to HK$1,484.3m with volume down 38.4% and ASP up 181.0% on high-end orders; EMS fell 7.9% and other PC products 20.1% on component lead times. APAC rose 25.1%; NALA, PRC and EMEAI fell 14.3%, 14.7% and 14.0%. Administrative expenses rose 18.1% on R&D headcount and bonuses; finance costs rose 78.2%. Operating cash flow was HK$2,501.7m; cash and equivalents HK$2,819.5m against bank borrowings of HK$1,339.3m; inventories HK$1,789.4m with turnover days at 58 from 37; trade receivables fell 27.4%. The interim dividend totals about HK$235.2m. The session had closed at the window high of S$3.23 before the after-hours release.
Guidance: 2H2026 'seems to be challenging' against the first half: graphics-memory costs expected to rise further, card availability to fall further and entry-level cards to face 'even more severe shortages'; GPU-server and AI shipments are scheduled to begin in 2H2026 and the company 'remains confident in achieving overall sales revenue growth in 2026'.Next session (17 Aug): PCT −5.3% · STI +0.4% · peers +2.0%
Large price moves
322 Jul 2026 · −13% · index +1% · peers −2%
337 Jul 2026 · −12% · index +2% · peers −2%
Notes and sources
Share price record
How this section was built
The detector flagged 33 large moves in the window — 23 single sessions and 10 weekly windows — before any news was read. 3 sector moves; 30 are left over after both controls, unexplained by them. Of those, 6 followed a filing by timestamp, 4 coincided with one in the same session or week and 20 have nothing filed against them beyond routine notices and are recorded as unexplained rather than explained away.
This section records the 21-month price history and puts every large move through two subtractions and reports what is left over, not what caused it: first the Straits Times Index, then the median of the three listed comparisons — BYD Electronic, AAC Technologies and Cowell e Holdings (Hong Kong-listed, so their sessions overlap rather than match) — which trade the same session. “Left over” is what survives both controls.
Each quarter panel pairs two records. Key developments are the filings that carry information — results and profit alerts, the HKEX delisting and SGX-only listing, the stake changes that are the story, the auditor change, dividend events — with the figures as filed, the guidance given, the close on the day and how the reacting session traded against the controls; a filing after the 09:00 open is read against the next session. Large price moves are the threshold-detected sessions, detected before any news was read and dispositioned from the controls and the enumerated tape; rows with a written note carry a numbered pin, the rest are dots on the line.
How to read the tags.Market-wide and Sector-wide mean the index or the peer median moved with the share over the same session or week; Residual means the move is still large after both are subtracted. A residual is what is left over, not a cause: it does not establish that the company’s own news moved the price, and an unchanged or thinly traded price is not proof that no information arrived. Returns use the dividend-adjusted close; a filing released after the open is read against the next session.
Prices are Yahoo Finance daily closes for PCT.SI in S$ on the SGX line, with returns on the dividend-adjusted series; the filing tape is every announcement PC Partner broadcast on SGXNet between 20 Nov 2024 and 21 Aug 2026, taken from the SGX announcements API with SGX broadcast times. A filing after the open is read against the next session. The vendor's adjusted series applied the two 2025 HK$ dividends as S$ amounts; the adjusted series used here was recomputed from the traded close with the S$ equivalents (S$0.0247 and S$0.0409), and the moves re-detected.
Limitations bound every row above. The register is drawn from the 120 announcements PC Partner broadcast on SGXNet between its SGX listing on 20 November 2024 and 21 August 2026; the company's HKEX filing stream (HKEXnews, stock code 1263), which was the primary regulatory channel until the HKEX listing was withdrawn on 14 January 2026, was not separately enumerated. That matters less than it sounds: 40 of the 43 substantive (non-interest) SGXNet filings before the delisting are HKEX-format documents cross-filed to SGXNet on the same evening, and all 20 substantive filings after it are SGX-native, so the tape should carry every material announcement but may miss HKEX-only paper such as monthly returns and HKEX disclosure-of-interest forms; the remaining 57 tape items are SGX Form 1/3 interest notices. Broker notes, trade press, NVIDIA and component-supply news, block trades and index reviews were not examined, and no subsidiary or related-entity stream exists for this issuer (the pack has no `entity-tape-register.json`). The peer set is three Hong Kong-listed hardware names (BYD Electronic, AAC Technologies, Cowell e Holdings), none of which sells graphics cards, and their dispersion on single sessions is wide, so the sector control is loose. Until 8 January 2026 the same share traded on HKEX with far more liquidity than on SGX (SGX public float 3.2% of issued shares at August 2025), so SGX-line moves on thin volume before then are partly a matter of which market printed.
A quarter shows only the columns it has. An empty developments column means: No filings beyond routine disclosures this quarter. An empty moves column means: No session cleared the large-move threshold this quarter.
The full move register — every large move and its market and sector controls
Every threshold-detected move in the window with its controls, dispositioned in the price-driver register; rows with a written note carry a numbered pin on the chart.
#
Session
PCT
STI
Peers
Left over
Control result
What the evidence supports
1
27 Nov 2024
+5.6%
−0.1%
+1.5%
+4.1%
Residual
Against an index move of −0.1% and a peer median of +1.5%, about 4 points are left over; 0.2× median volume. Followed the filing “Extraordinary/ Special General Meeting :: Voluntary”, released 26 Nov 2024, 17:45. BYDE +1.5 · AAC −1.7 · Cowell +5.3
2
week to 3 Jan 2025
+10.5%
+0.8%
−0.9%
+11.4%
Residual
Weekly window, 2024-12-27 to 2025-01-03: against an index move of +0.8% and a peer median of −0.9%, about 11 points are left over. No filing beyond routine notices inside the window. BYDE −5.1 · AAC −0.9 · Cowell −0.7
3
3 Feb 2025
+6.1%
−0.8%
+0.1%
+6.0%
Residual
Against an index move of −0.8% and a peer median of +0.1%, about 6 points are left over; 0.1× median volume. No filing beyond routine notices in the prior three sessions.
4
week to 7 Feb 2025
+13.3%
+0.1%
+15.6%
−2.2%
Sector-wide
Tracked the sector: against an index move of +0.1% and a peer median of +15.6%, about 2 points are left over.
5
12 Feb 2025
+7.7%
+0.4%
+8.4%
−0.7%
Sector-wide
Tracked the sector: against an index move of +0.4% and a peer median of +8.4%, about 1 points are left over. BYDE +10.0 · AAC +8.4 · Cowell +5.1
6
14 Feb 2025
−7.0%
−0.1%
+4.0%
−11.1%
Residual
The session after the FY2024 positive profit alert, broadcast at 19:43 on 13 February after the close: the company expected net profit attributable to shareholders of not less than about HK$250m, against about HK$60m for FY2023. The shares fell 7.0% while the index was flat (−0.1%) and all three peers rose on their Hong Kong session of the same date (BYD Electronic +5.1%, AAC +3.1%, Cowell +4.0%), so about 11 points run against both controls. Volume was 225,400 shares, 1.3× the window's median but fifteen times the median of the prior 60 sessions, on a line that had traded 2,300 shares on 11 February; the same share's HKEX line, which carried most of its volume until January 2026, is not in the series. The fall was made back within two sessions, +3.8% and +4.5%, ahead of the 19 and 20 February rises. BYDE +5.1 · AAC +3.1 · Cowell +4.0
7
19 Feb 2025
+11.3%
+0.2%
+3.0%
+8.3%
Residual
Against an index move of +0.2% and a peer median of +3.0%, about 8 points are left over; 0.1× median volume. Followed the filing “General Announcement :: Date of Board Meeting”, released 18 Feb 2025, 17:48. BYDE +2.7 · AAC +3.9 · Cowell +3.0
8
20 Feb 2025
+14.1%
−0.2%
+0.1%
+14.0%
Residual
Against an index move of −0.2% and a peer median of +0.1%, about 14 points are left over; 1.7× median volume. No filing beyond routine notices in the prior three sessions. BYDE −1.8 · AAC +0.1 · Cowell +6.0
9
week to 21 Feb 2025
+30.2%
+1.4%
+4.2%
+26.0%
Residual
The week began the session after the 13 February profit alert (net profit attributable expected at not less than about HK$250m, against about HK$60m) and included one filing, the 18 February notice at 17:48 fixing the board meeting for the FY2024 results on 28 February, which carries no figures. The index rose 1.4% and the peer median 4.2% over the same span (BYD Electronic −1.1%, AAC +4.2%, Cowell +5.9% across their Hong Kong sessions), leaving about 26 points. The gain came on 19 and 20 February, +11.3% on 11,700 shares and +14.1% on 308,900, to a close of S$1.46. The week ended 5.5% below that after 1,697,600 shares changed hands on 21 February, the most in any session on the SGX line to that date. BYDE −1.1 · AAC +4.2 · Cowell +5.9
10
25 Feb 2025
+8.9%
−0.3%
−0.3%
+9.2%
Residual
Against an index move of −0.3% and a peer median of −0.3%, about 9 points are left over; 2.7× median volume. No filing beyond routine notices in the prior three sessions. BYDE −2.7 · AAC −0.3 · Cowell +4.5
11
week to 7 Mar 2025
+12.3%
+0.5%
−0.3%
+12.6%
Residual
Every session in the week followed the FY2024 results, broadcast at 22:19 on Friday 28 February, after the close the window starts from (a 20:06 broadcast had omitted the attachment). The company reported revenue up 10.0% to HK$10,081.9m and net profit attributable to shareholders of HK$262.1m against HK$60.8m, with a final dividend of HK$0.15 (FY2023: HK$0.20). The index rose 0.5% and the peer median fell 0.3% over the same span (AAC +11.6%, BYD Electronic −0.3%, Cowell −1.3%), leaving about 13 points; the gain came on 5 and 6 March, +7.9% and +4.7%, on 34,500 and 92,300 shares. The 28 February close the window starts from was itself 8.6% lower on the day, in step with the peers' Hong Kong session (−6.6% to −10.5%), before the results were out. BYDE −0.3 · AAC +11.6 · Cowell −1.3
12
10 Mar 2025
+20.6%
−0.4%
−1.0%
+21.6%
Residual
No filing explains it. Nothing was broadcast on SGXNet between the FY2024 results of 28 February and the annual report of 28 March, so the three sessions before and the three after are as empty as the session itself; the index fell 0.4% and the peer median 1.0% (BYD Electronic −1.0%, AAC +4.7%, Cowell −2.2%), so about 22 points survive both controls. Volume was 129,200 shares, 0.7× the window's median but six times the median of the prior 60 sessions. The rise continued the next session, +17.7% to S$2.20, and the two sessions after that gave back 12.7% between them. BYDE −1.0 · AAC +4.7 · Cowell −2.2
13
11 Mar 2025
+17.6%
−1.9%
−1.4%
+19.1%
Residual
The second of two consecutive sessions with nothing filed against them: the close of S$2.20, the highest of 2025, was 42% above the 7 March close two sessions earlier, on 577,300 shares (3.2× the window's median, 27× the median of the prior 60 sessions). The index fell 1.9% and no peer rose more than 0.5% (BYD Electronic +0.5%, AAC −1.4%, Cowell −2.6%), so about 19 points are left over. There is no announcement between 28 February and 28 March on either side of the session, and the HKEX line, which carried most of the share's volume then, is not in the series. The next two sessions fell 4.5% and 8.6%, and by 28 March the close was S$1.52, below where the run began. BYDE +0.5 · AAC −1.4 · Cowell −2.6
14
week to 14 Mar 2025
+30.3%
−2.0%
+0.4%
+29.9%
Residual
The week holds the two unexplained sessions of 10 and 11 March and the partial reversal that followed: +20.7%, +17.7%, −4.5%, −8.6%, +5.2%, from S$1.55 to S$2.02 by way of the S$2.20 close on 11 March. The index fell 2.0% over the same five sessions and the peer median rose 0.4% (BYD Electronic +0.4%, AAC +1.7%, Cowell −5.8% over their Hong Kong sessions), so about 30 points survive both controls. Nothing was broadcast on SGXNet between the results of 28 February and the annual report of 28 March; the HKEX filing stream, the primary channel at the time, was not separately enumerated. The gain did not hold: the close was S$1.82 a week later and S$1.52 on 28 March, below the week's starting point. BYDE +0.4 · AAC +1.7 · Cowell −5.8
15
week to 21 Mar 2025
−9.9%
+2.4%
+2.8%
−12.7%
Residual
Weekly window, 2025-03-14 to 2025-03-21: against an index move of +2.4% and a peer median of +2.8%, about 13 points are left over. No filing beyond routine notices inside the window. BYDE −5.8 · AAC +2.8 · Cowell +16.0
16
28 Mar 2025
−11.6%
−0.2%
−2.7%
−9.0%
Residual
Against an index move of −0.2% and a peer median of −2.7%, about 9 points are left over; 0.3× median volume. No filing beyond routine notices in the prior three sessions. BYDE +0.5 · AAC −2.7 · Cowell −4.2
17
week to 28 Mar 2025
−16.5%
+1.2%
−9.5%
−7.0%
Residual
Weekly window, 2025-03-21 to 2025-03-28: against an index move of +1.2% and a peer median of −9.5%, about 7 points are left over. No filing beyond routine notices inside the window. BYDE −12.1 · AAC −9.5 · Cowell −8.8
18
7 Apr 2025
−23.9%
−7.5%
−22.4%
−1.6%
Sector-wide
Tracked the sector: against an index move of −7.5% and a peer median of −22.4%, about 2 points are left over.
19
8 Oct 2025
+13.3%
−0.4%
−0.6%
+13.9%
Residual
Against an index move of −0.4% and a peer median of −0.6%, about 14 points are left over; 3.7× median volume. No filing beyond routine notices in the prior three sessions.
20
7 Jan 2026
+9.1%
+0.2%
−0.2%
+9.3%
Residual
Against an index move of +0.2% and a peer median of −0.2%, about 9 points are left over; 4.5× median volume. No filing beyond routine notices in the prior three sessions. BYDE −0.2 · AAC −0.9 · Cowell +2.0
21
9 Jan 2026
+15.0%
+0.1%
−0.9%
+15.9%
Residual
The first session after dealings in the share on HKEX ceased at 4 p.m. on 8 January, the last dealing day fixed by the 7 January notice (17:20) that all conditions for the withdrawal had been satisfied on 6 January and the Hong Kong listing would be withdrawn on 14 January. The 8 January session, which also followed the notice, closed 2.0% lower; this one rose 15.0% on 1,368,100 shares, 7.7× the window's median, against an index up 0.1% and a peer median down 0.9% (BYD Electronic −2.6%, AAC −0.9%, Cowell +0.3%), leaving about 16 points. No other filing sits between the 8 and 9 January opens. The close held at S$1.12 over the next two sessions, then rose 8.0% on 14 January after the midday notice of 13 January confirming that HKEX dealings had ceased. BYDE −2.6 · AAC −0.9 · Cowell +0.3
22
week to 9 Jan 2026
+22.3%
+1.9%
−2.8%
+25.1%
Residual
The last week in which the share also traded in Hong Kong. It included the 7 January notice (17:20) that all conditions for the HKEX withdrawal had been satisfied, with 8 January the last dealing day and the listing withdrawn from 14 January; the 7 January session's +9.1% came before that notice, and the 9 January session's +15.0% came after it and after HKEX dealings had ceased. The index rose 1.9% and the peer median fell 2.8% over the same span (BYD Electronic −2.8%, AAC −4.9%, Cowell +0.2%), leaving about 25 points. The other three sessions moved −3.2%, +2.7% and −2.0%, and the close went from S$0.94 to S$1.15. BYDE −2.8 · AAC −4.9 · Cowell +0.2
23
14 Jan 2026
+8.0%
+0.1%
−0.3%
+8.3%
Residual
Against an index move of +0.1% and a peer median of −0.3%, about 8 points are left over; 5.0× median volume. Followed the filing “General Announcement :: VOLUNTARY WITHDRAWAL OF LISTING ON THE MAIN BOARD OF THE HKEX”, released 13 Jan 2026, 12:01. BYDE +0.3 · AAC −0.3 · Cowell −0.9
24
20 Jan 2026
+20.9%
−0.1%
−2.7%
+23.5%
Residual
Coincided with the FY2025 positive profit alert, broadcast at 12:01 in the midday break: the company expected net profit attributable to shareholders of about HK$450m, against about HK$262m for FY2024. The morning traded without the alert and the afternoon with it, and daily data cannot split the 20.9% between them, so the order is not established; the peers' Hong Kong session also breaks at noon but opened half an hour later and closed an hour earlier. The index was flat (−0.1%) and all three peers fell (BYD Electronic −2.7%, AAC −3.3%, Cowell −0.7%), so about 24 points survive both controls, on 3,152,500 shares, 17.7× the window's median. The next session added 0.7% on 1,760,100 shares and the close was still S$1.39 at the end of the week. BYDE −2.7 · AAC −3.3 · Cowell −0.7
25
week to 23 Jan 2026
+21.9%
+0.9%
−1.9%
+23.8%
Residual
The week included the FY2025 positive profit alert of 20 January (12:01; net profit attributable expected at about HK$450m, against about HK$262m) and the 21 January notice (17:44) that BDO Limited of Hong Kong had been removed as joint auditor from 14 January, leaving BDO LLP as sole auditor. All but about one point of the week's 21.9% came in the 20 January session; the other four moved +0.9%, +0.7%, −0.7% and 0.0%. The index rose 0.9% and the peer median fell 1.9% over the same span (BYD Electronic −1.9%, AAC −3.5%, Cowell +1.0%), leaving about 24 points. BYDE −1.9 · AAC −3.5 · Cowell +1.0
26
9 Feb 2026
+11.3%
+0.5%
+0.8%
+10.5%
Residual
Against an index move of +0.5% and a peer median of +0.8%, about 10 points are left over; 8.2× median volume. No filing beyond routine notices in the prior three sessions. BYDE −0.5 · AAC +2.0 · Cowell +0.8
27
20 May 2026
+10.3%
−0.5%
+0.3%
+10.0%
Residual
Against an index move of −0.5% and a peer median of +0.3%, about 10 points are left over; 27.6× median volume. No filing beyond routine notices in the prior three sessions. BYDE −2.0 · AAC +0.3 · Cowell +0.5
28
29 May 2026
+10.1%
+1.0%
−0.6%
+10.7%
Residual
Against an index move of +1.0% and a peer median of −0.6%, about 11 points are left over; 36.7× median volume. No filing beyond routine notices in the prior three sessions. BYDE −2.1 · AAC +3.7 · Cowell −0.6
29
week to 29 May 2026
+20.6%
−0.6%
+5.9%
+14.7%
Residual
Weekly window, 2026-05-22 to 2026-05-29: against an index move of −0.6% and a peer median of +5.9%, about 15 points are left over. No filing beyond routine notices inside the window. BYDE +11.0 · AAC +5.9 · Cowell −5.6
30
2 Jun 2026
+10.4%
+1.2%
+3.2%
+7.2%
Residual
Against an index move of +1.2% and a peer median of +3.2%, about 7 points are left over; 56.4× median volume. No filing beyond routine notices in the prior three sessions. BYDE +2.5 · AAC +4.8 · Cowell +4.3
31
25 Jun 2026
+11.8%
+0.1%
−1.8%
+13.7%
Residual
Against an index move of +0.1% and a peer median of −1.8%, about 14 points are left over; 39.3× median volume. No filing beyond routine notices in the prior three sessions. BYDE −1.8 · AAC −1.6 · Cowell −2.0
32
2 Jul 2026
−12.9%
+1.1%
−1.5%
−11.4%
Residual
Against an index move of +1.1% and a peer median of −1.5%, about 11 points are left over; 40.4× median volume. No filing beyond routine notices in the prior three sessions.
33
7 Jul 2026
−12.3%
+1.6%
−2.1%
−10.3%
Residual
Against an index move of +1.6% and a peer median of −2.1%, about 10 points are left over; 35.0× median volume. No filing beyond routine notices in the prior three sessions. BYDE −4.9 · AAC −1.9 · Cowell −2.1
Key developments: sources, timing and notes
26 Nov 2024 · First step toward a primary SGX listing: proposed new articles and the appointment of BDO LLP as additional auditor, six days after the SGX secondary listing began.Corporate actionReaction (next session, 27 Nov): PCT +5.6% · STI −0.1% · peers +1.5% · 0.4× median volumeSource: SGX announcement, 26 Nov 2024 (released 12:12, in the midday break) · EGM poll results, 20 Dec 2024
13 Feb 2025 · Positive profit alert for FY2024: net profit attributable to shareholders expected at not less than about HK$250m, against about HK$60m in FY2023.Business updateReaction (next session, 14 Feb): PCT −7.0% · STI −0.1% · peers +4.0% · 13.3× median volumeSource: SGX announcement, 13 Feb 2025 (released 19:43, after the close)
18 Jul 2025 · Positive profit alert for 1H2025: net profit attributable expected at about HK$250m, against about HK$194m in 1H2024.Business updateReaction (next session, 21 Jul): PCT +3.0% · STI +0.4% · peers −2.2% · 11.2× median volumeSource: SGX announcement, 18 Jul 2025 (released 18:05, after the close)
6 Oct 2025 · Shareholders approve the HKEX delisting with 91.42% of votes cast (178.7m for, 16.8m against); last HKEX dealing day set for 8 January 2026 and withdrawal for 14 January 2026.Corporate actionReaction (next session, 7 Oct): PCT +0.0% · STI +1.1% · 0.9× median volumeSource: EGM poll results, 6 Oct 2025 · HKEX approval update, 3 Nov 2025 · Reminder on share removal, 1 Dec 2025
7 Jan 2026 · All conditions for the HKEX delisting satisfied on 6 January 2026: last dealing day 8 January, listing withdrawn at 4 p.m. on 14 January.Corporate actionReaction (next session, 8 Jan): PCT −2.0% · STI −0.2% · peers −2.2% · 4.7× median volumeSource: SGX announcement, 7 Jan 2026 · SGX announcement, 13 Jan 2026 (released 12:01)
20 Jan 2026 · Positive profit alert for FY2025: net profit attributable expected at about HK$450m, against about HK$262m in FY2024.Business updateReaction (next session, 21 Jan): PCT +0.7% · STI −0.4% · peers +2.4% · 6.4× median volumeSource: SGX announcement, 20 Jan 2026 (released 12:01, in the midday break)
21 Jan 2026 · Auditor change: BDO Limited (Hong Kong) removed as joint auditor from 14 January 2026, leaving BDO LLP (Singapore) as sole external auditor.AnnouncementSource: SGX announcement, 21 Jan 2026
16 Jul 2026 · Positive profit alert for 1H2026: net profit attributable expected at not less than HK$500m, against about HK$250m in 1H2025.Business updateReaction (next session, 17 Jul): PCT −2.3% · STI −0.5% · peers −5.8% · 2.7× median volumeSource: SGX announcement, 16 Jul 2026 (released 17:23, after the close)
Every other test on this page waits for the company to file. These do not. Each row is a series you can look up yourself, free, today — with the level this reading was built against, the levels that would put it in question, and what the series cannot tell you.
graphics card assembly and branded sales — nothing public to watch
Searched the graphics-processor supplier's segment reporting, the platform hardware surveys and the retail price trackers after the supplier stopped reporting gaming revenue separately (see the retired row above). Hardware surveys measure the installed base, which moves years after a purchasing cycle, and retail price trackers cover a handful of models rather than this company's mix. The binding variable is in any case allocation rather than demand — the company's own filings warn it may not obtain sufficient GPUs — and allocation is not published by anyone.
Watchlist reviewed on 2026-08-27; each observation has its own date above. This watchlist date does not change the company research cutoff. A series moving past a level is a reason to re-read the case, not a recommendation. The same series across every company covered: what you can watch.
Notes and sources
Open questions the filings do not answer
1. How much of the 1H2026 gross margin is repeatable? The company stockpiled GPUs in FY2025 explicitly because it expected a FY2026 shortage, and then sold into rising prices. The filings do not separate the effect of selling pre-shortage inventory from any durable improvement in pricing. The FY2026 second-half margin, against inventory replenished at current component costs, is the observation that would settle it.
2. What is the normalised earnings base? On the full FY2011–FY2025 record the through-cycle net margin is 4.11%; on FY2019–FY2025 alone it is 5.50%. The two windows differ by a third. Nothing in the filings determines which is the right basis, and the answer depends on a judgement about whether the FY2017–18 and FY2020–21 demand spikes can recur now that GPU-based cryptocurrency mining has largely ended.
3. How large is the GPU-server and AI business? Management states shipments begin in 2H2026 and that it is likely to become a key driver. No revenue, customer, margin, order book or capital commitment has been disclosed for it.
4. What is the current supplier concentration? It reached 72% of purchases from one supplier in FY2024 and was then not disclosed at all in FY2025. Neither the current share nor the group’s allocation position is in the latest accounts.
5. Which business line earns its capital? The group reports a single operating segment and discloses no segment profit, assets, liabilities or capex in any period. Branded sales, contract manufacturing and EMS plainly have different economics, but the disclosure does not permit any of them to be measured.
6. Will the CBP protest succeed? HK$92.3m sits on the balance sheet as a receivable on the assumption it will. The filings give no timetable.
7. A 14.19% interest has not been shown to have been sold. The FY2025 Directors’ Statement records Mrs Ho Wong Mary Mee-Tak as holding 55,050,000 shares at the beginning of the year and nil in the table after she ceased to be a director. Her director-cessation notice explicitly states that she retained the 55,050,000-share direct interest. No disposal filing was found. She is therefore treated as a 14.19% substantial shareholder pending an actual contrary filing. Later Form 3s also make the 2 March 2026 holder table stale, so the current ownership percentages remain an open re-keying item.
Download
A print-ready PDF of this page, for reading away from the screen: PC Partner Group evidence library (PDF). It carries the same content as this page — the fifteen-year record, what operating cash flow means here, where five years of cash went, the move to Singapore, the dropped IPO disclosure, the first half of 2026, the balance sheet, liquidity and financing debt, ownership and governance, the contingent liability, the share price and open questions — and the same omissions: no rating, no fair value, no forecast.
Interim Results Briefing June 2026, dated 18 August 2026. The issuer-hosted PDF is marked RESTRICTED; it is linked as a primary source and is not copied onto this site.
The broader evidence archive also includes annual reports FY2011–FY2024; interim reports 1H2019–1H2025; the positive profit alert dated 16 July 2026; the 2011 HKEX listing prospectus; the SGX company introduction document dated 2 October 2024; the circular for the proposed voluntary withdrawal of the HKEX listing dated 18 September 2025; and 207 exchange announcements. The official issuer, exchange and brand routes were checked through 20 August 2026; no issuer item dated 19 or 20 August was found.
Evidence tags used in the underlying research: (R) reported in a primary document · (D) derived or recomputed, with the computation shown · (E) third-party or secondary · (O) opinion. This page carries R and D content only.
Correction, 16 September 2026. The last row of the “Where five years of cash went” table was labelled “Cash and bank balances at year end”, but its figures are the cash flow statement’s cash and cash equivalents at end of year, which exclude pledged deposits and time deposits with an initial maturity of over three months. The row is now labelled for what it shows; the figures are unchanged. The balance-sheet cash and bank balances, which the net cash row in the balance-sheet section is defined on, were HK$3,765.1m, HK$2,207.3m, HK$2,491.2m, HK$2,334.0m and HK$2,506.7m at the FY2021 to FY2025 year ends — HK$390.8m above the cash-equivalents figure at FY2023 and HK$156.6m above it at FY2024.
Reader questions & corrections
Ask about this company, challenge a source or suggest a factual correction. Only selected questions that SMID Research has reviewed and answered are published.
Submissions are private by default. Your email is encrypted and never published. Please do not send confidential or inside information, allegations about individuals, promotions, or requests for personalised investment advice.
Behind the lock
A complete private working view of PC Partner Group exists: a full initiation note, the spread and model workbook, an understanding sheet, scenario and valuation work, and the independent review artifacts. It is not published and not available for sharing.
Transcripts
Find available event transcripts in the transcript library.