Listed in Singapore · Pure car & truck carrier owner
SGX: S19 · Information cut-off 26 August 2026
Investor snapshot
Business model
Singapore Shipping owns five car carriers on time charter and earns additional fees from agency, terminal and logistics services.
Latest figures
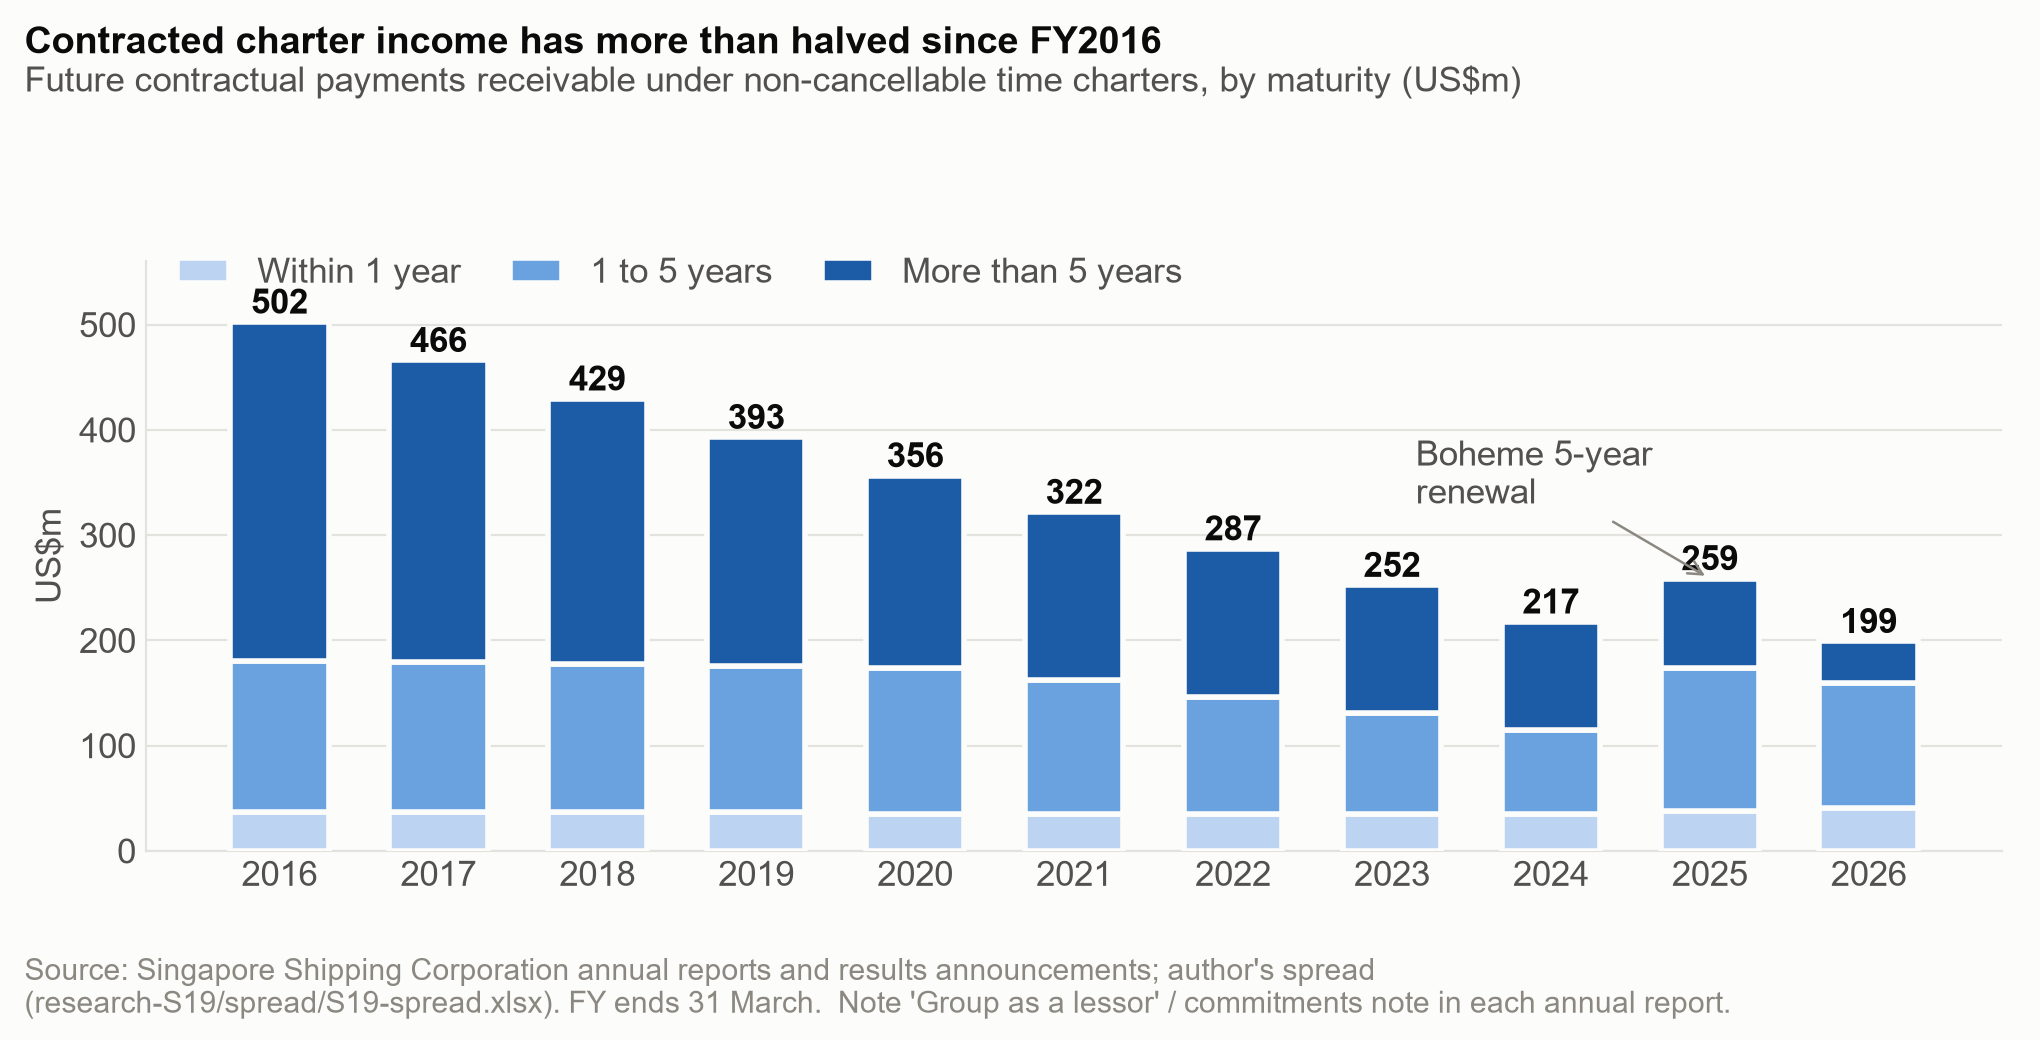
By FY2026 contracted charter income had fallen to US$199m from US$502m in FY2016, while cash was US$97.6m against US$18.6m of debt and the fleet had not added a vessel since FY2015.
Main risk
The central risk is that ageing ships roll off contract faster than surplus cash is redeployed into viable replacement tonnage.
Next proof
The next test is the FY2027 lessor note, charter renewals and a funded fleet-replacement plan.
Share price
S$0.295 (derived from scrip VWAP, 7–11 Aug 2026)
Market cap
S$118.2m / US$92.3m
Fleet
5 PCTCs · avg age 21.1 yrs
Listed
Nov 2000, by introduction · SGX Mainboard
Control
Exec. Chairman 43.9% · son is CEO
Credit
No rated debt · no agency rating
Reporting
Half-yearly · FY ends 31 Mar · USD accounts
This page carries no rating, no fair value and no recommendation. Information cut-off: 26 August 2026; announcement tape monitored through 28 August. Equity library v4 (16 August 2026); credit view rebuilt 20 August. Evidence tags: R = primary source · D = derived · G = company guidance · E = external/unverified · O = opinion. See methodology.
Evidence balance
The live questionCan contracted charter hire and the retained cash balance fund a replacement vessel before the ageing fleet's charters expire?In FY2026 the board's outlook dropped its stability framing and said it may need to adopt a less risk-averse approach, making the funding of replacement tonnage the live question rather than next year's earnings.
What improved
FY2026 revenue rose 4.2% to US$50.6m, and the contractual charter rate is US$22.5k per vessel-day for the next twelve months against US$19.0k through FY2016–FY2024; the Boheme fixture showed a 26-year-old vessel securing a five-year charter, evidence the fleet is re-lettable.
What became more demanding
In the same year the roll-forward residual after expected runoff was negative US$21.9m. It is not proof of lost contracted revenue: foreign exchange, timing and contract changes can affect the bridge. Roughly 80% of vessels are near the end of useful life and management's stated replacement cost is US$120–150m each against a US$92m market cap.
Strongest alternative explanation
The negative US$21.9m residual could reflect foreign exchange, timing or contract changes, including a charter shortened or restructured. The 17 April 2026 announcement refers to an extended time charter at increased rates, but it does not reconcile the residual or establish that renewal economics have weakened.
The decisive missing fact
A dated reconciliation of the roll-forward residual, including foreign exchange, timing and contract changes, and the terms of the next vessel decision — counterparty, rate, duration and financing.
Drawn from the evidence on this page: the improvement, the constraint, the benign reading and the fact that would settle it. It states no view on the shares.
About the private research record
Also on file for this company, behind the rated view 🔒 (author-only): the rating and full written view with fair value and scenarios · a dedicated credit opinion carrying the private issuer and instrument grades, the rating register, scenario migration and the full eight-remit review record · the complete initiation report (PDF) · a historical integrated workbook retained for audit, whose exact credit subset is adopted while the current equity model remains blocked · the presentation deck · the independent-review artifacts. Kept private; not for distribution.
26 August monitoring update. The FY2026 final dividend remains 1.0 Singapore cent, with scrip priced at S$0.266; the election window runs from 24 August to 4 September and payment/allotment remains 28 September. Executive chairman Ow Chio Kiat bought 107,000 shares on 24 August at S$0.28967 and 171,400 on 25 August at S$0.290. His direct interest rose to 168,220,553 shares; including 7,824,335 deemed shares, total interest was 176,044,888 shares, or 44.025% of 399,875,065 shares excluding treasury. Together with the 20–21 August purchases, these filings extend the insider-buying record but do not change the fleet, charter book or reported cash. Scrip notice · latest director-interest notice. (R/D)
On this page
Business anatomy · operations, customers and cash
Owned car carriers earn hire; port services earn separate fees
Singapore Shipping commits capital to vessels chartered to shipping lines, while its smaller agency, terminal and logistics activities serve a broader account base.
Compare the business lines; dated mix appears only where reported segments map cleanly to a card.
Capital allocationVessel capital
Buy and maintain the ships
What happensLong-term capital and ship finance fund a fleet of owned pure car and truck carriers.
Capital at riskOwnership creates maintenance, financing and residual-value exposure.
What happensOther customers commission agency, terminal and logistics work around port calls and cargo requirements.
How it earnsCompleted port and logistics services earn service fees.
Revenue engineTwo cash engines
Collect hire and fees
What happensVessel-hire cash and port-service cash reach the group through separate contracts and account bases.
How it earnsThe charter lane is more capital-heavy; the service lane is fee-based.
Original SMID Research comic. AI-assisted, analyst-directed monochrome artwork depicts the evidenced operating steps of Singapore Shipping Corporation; deterministic captions and dated mix figures state the economics using issuer disclosures available to 2026-08-26. The drawings are representative—not issuer artwork, an exact product or site design, a statement of scale, or a company forecast.
Investor translation
What matters after the operating picture
Four questions connect the business model to cash and balance-sheet risk. This is a factual reading aid, not a valuation or recommendation.
Value lever
Contracted cash from the existing fleet plus sale value, with any renewal franchise valued separately.
Cash bottleneck
Maintenance, drydock and replacement-vessel spending arrive before renewed charter cash.
Balance-sheet pressure
Fleet-renewal commitments and maturities exceed charter cash and committed financing.
Next proof
Charter renewals, vessel sale values and a funded replacement plan with debt terms.
Text version of this comic
Capital allocation · Buy and maintain the ships Long-term capital and ship finance fund a fleet of owned pure car and truck carriers. Capital at risk: Ownership creates maintenance, financing and residual-value exposure.
Business line · Place the vessel on hire Shipping-line counterparties time-charter the vessels and operate the cargo service. Reported mix: FY2026 revenue 71.6%; segment result 96.3% (D).How it earns: The charterer pays contracted vessel hire, commonly expressed per vessel-day.
Business line · Coordinate the port call Other customers commission agency, terminal and logistics work around port calls and cargo requirements. Reported mix: FY2026 revenue 28.4%; segment result 3.7% (D).How it earns: Completed port and logistics services earn service fees.
Revenue engine · Collect hire and fees Vessel-hire cash and port-service cash reach the group through separate contracts and account bases. How it earns: The charter lane is more capital-heavy; the service lane is fee-based.
1 · What the company is
SSC owns five pure car and truck carriers and charters them out on long-term time charters — a tonnage provider, not an operator: no cargo competition, no freight-rate risk within a charter, no liner network. Alongside sits a small Singapore agency, terminal and logistics business. Revenue is (i) contracted hire from a handful of counterparties and (ii) fee income from many small accounts. (R)
Customer concentration — the central single-point risk
Three customers are 84% of group revenue; one alone is 42% (R, major-customer note). The relationships are decades old (Mitsui O.S.K., NYK, Daiichi Chuo — 50 years marked in 2023). The company states these counterparties have no history of payment default — true, but a narrower claim than it sounds: Daiichi Chuo went through court-led civil rehabilitation in 2015 with US$1.47bn of debts (E, verified press). SSC took no reported loss — the concentration risk is real, and it has been survived once. (R/D/E)
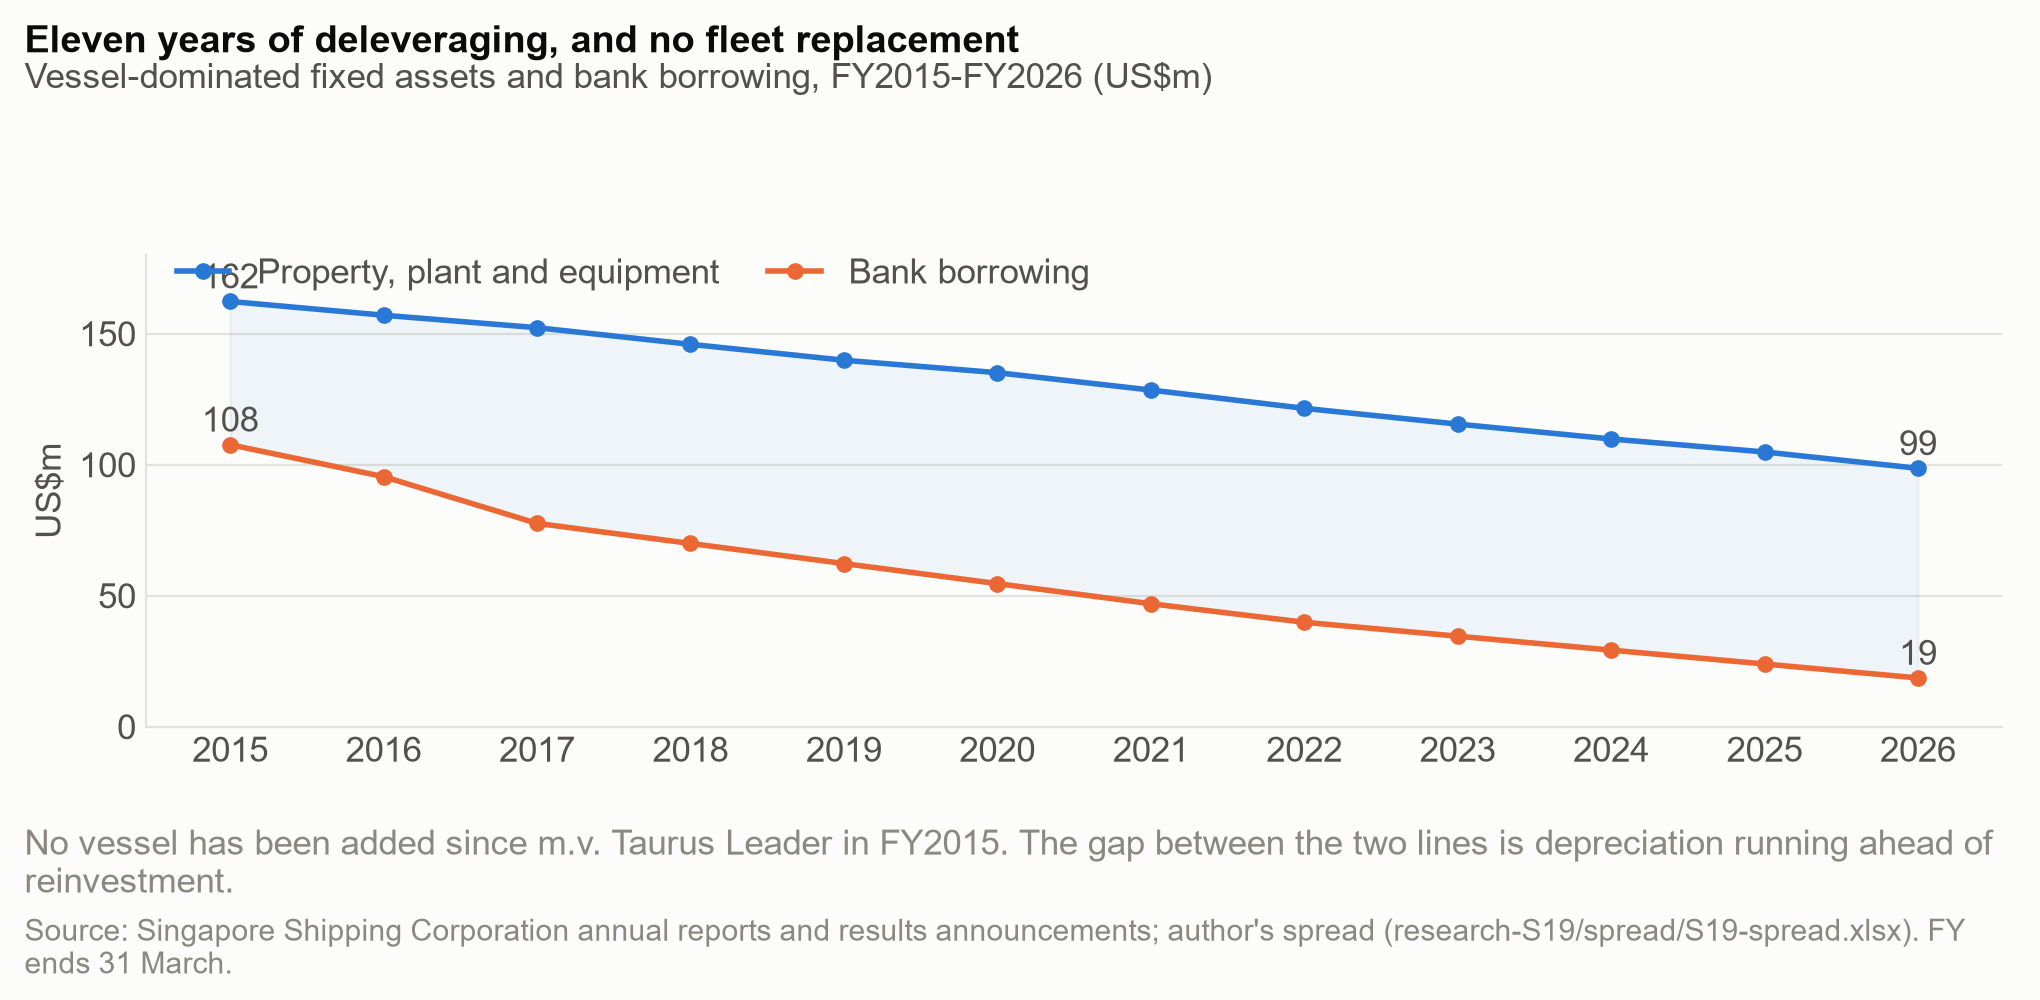
The arc that produced today's balance sheet. The modern company begins in FY2011: vessels were bought in FY2011 and FY2014–15, the latter reportedly with ~15-year NYK charters already attached (E, corroborated by the FY2016 backlog structure) — capex underwritten by contract before the steel was paid for. Since FY2015, no vessel has been added. Fixed assets have declined every year to US$98.6m, debt has amortised to US$18.6m, and cash has accumulated. Depreciate, repay, accumulate, don't reinvest — that eleven-year pattern is the strategy, and also the problem. (R/D)
2 · The contract book — running off, with a repricing option attached
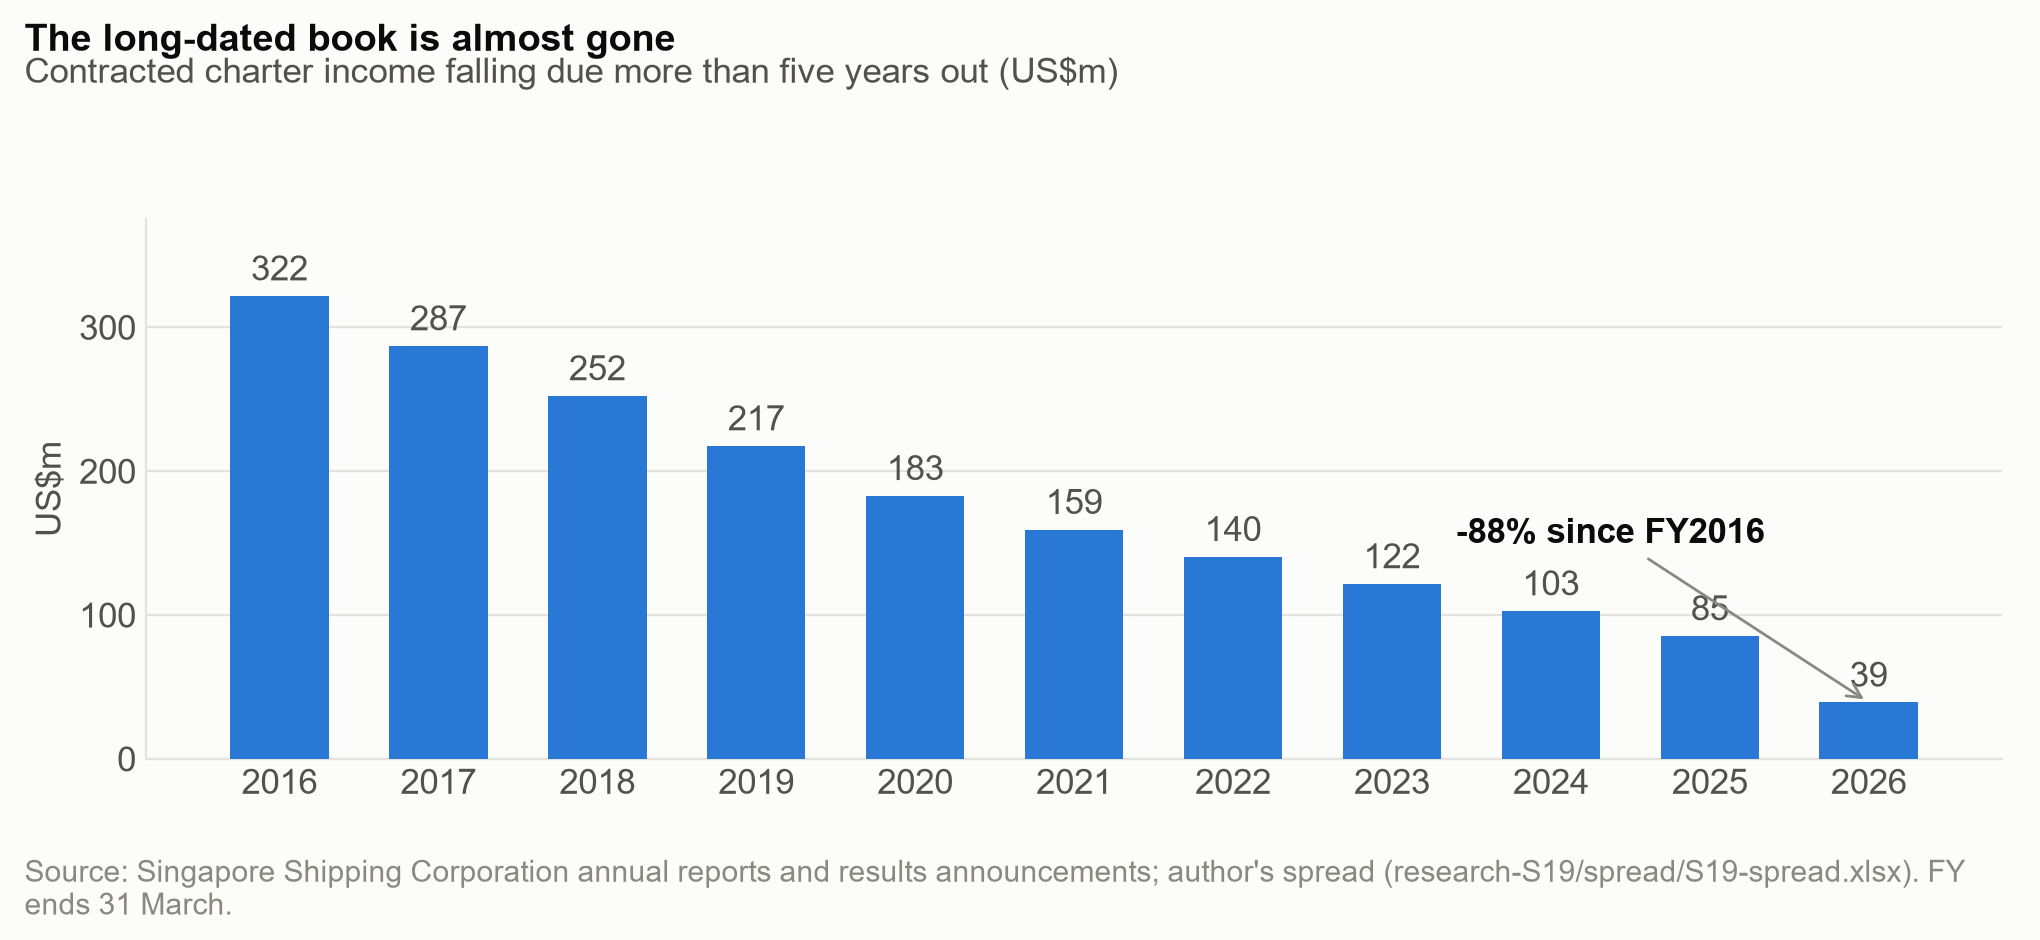
The "Group as a lessor" note makes the run-off exact: total contracted charter income has fallen from US$502m (FY2016) to US$199m (FY2026), and the portion due beyond five years has collapsed 88%, from US$322m to US$39m. The beyond-five-years bucket is the wrong cut, though — it empties mechanically in any ageing fixed book and detects nothing. The useful bridge is the roll-forward residual: closing total minus opening total plus the opening within-one-year bucket, which adds back expected runoff. It is a reconciliation residual, not proof that every positive amount is a new contract: terminations, currency and other movements can also affect it. (D)
Roll-forward residual after expected runoff (US$'000)
FY2017
FY2018
FY2019
FY2020
FY2021
FY2022
FY2023
FY2024
FY2025
FY2026
Residual after expected runoff
0
+1
0
0
0
−1
0
0
+75,792
−21,940
R/D — “Group as a lessor” note, annual reports FY2016–FY2026. For FY2017–FY2024 the disclosed totals reconcile to expected runoff within US$1,000 of rounding; this does not prove that no charter tonnage was added or lost. FY2025’s positive residual was US$75.8m and coincided with the disclosed five-year Boheme fixture. The fixture demonstrates a renewal, but this bridge does not establish that the entire residual came from it. FY2026’s residual was negative US$21.9m. Currency, timing and contract changes can affect the bridge; the residual alone does not establish cancelled charter income. A dated reconciliation of opening commitments, earned hire, new contracts, amendments and currency movements is needed. The next lessor note may help but will not necessarily explain every movement. (D/L)
Weighted average remaining charter term has fallen from about 6.0 years to about 3.5 — up on price, down on duration, which is the single most important pattern in this company’s numbers. (D)
The contract book: US$502m → US$199m over a decade.Beyond-five-years bucket: US$322m → US$39m (−88%).
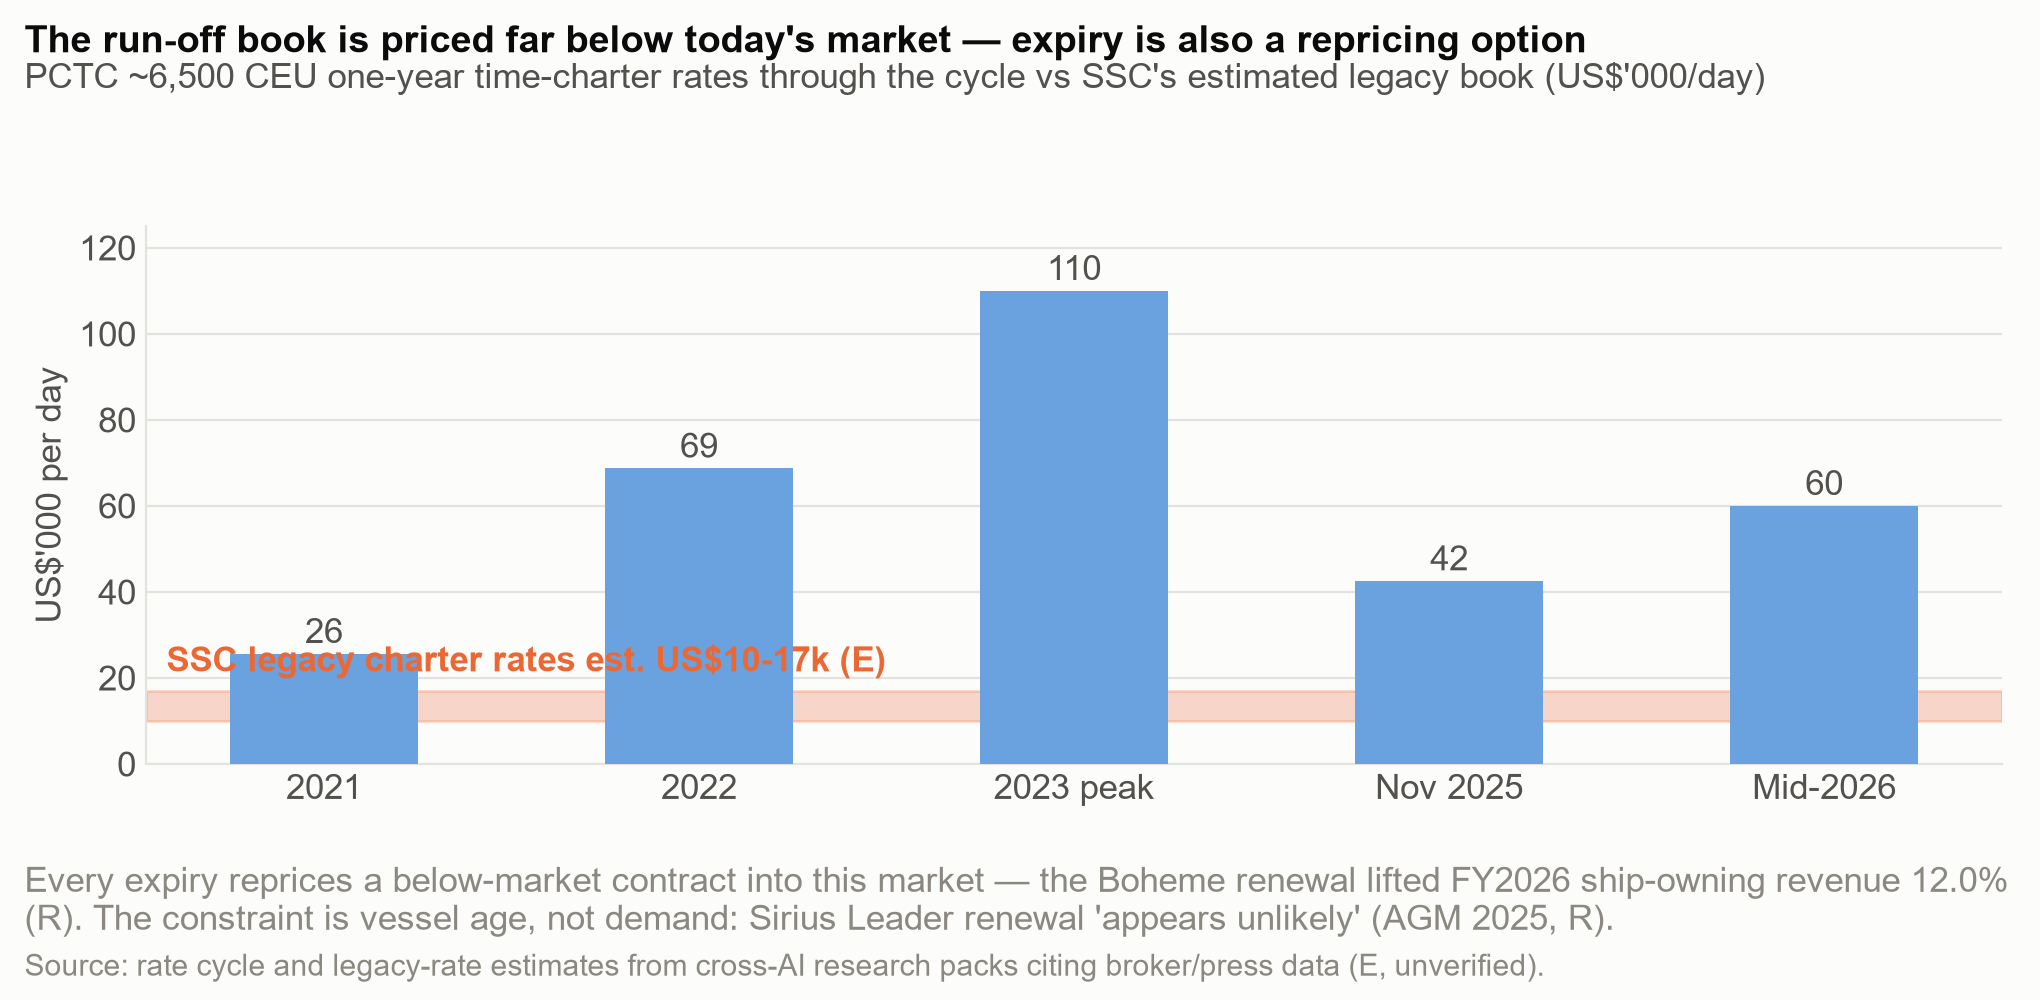
But expiry is also a repricing event — at aged-tonnage discounts, not to market.Corrected 20 August 2026: an earlier version of this page derived the rate by dividing the P&L lease line by vessel-days, giving US$16.5k/day. That understates cash hire by 25–35% and is the most common analytical error made on this company. From FY2020 the group applies SFRS(I) 16, which splits a time charter into a straight-lined lease component and a service component and parks the difference in deferred income — so the lease line is an accounting construct, not cash. The contractual basis is the lessor note: US$22.5k per vessel-day contracted for the next twelve months, against US$19.0k through FY2016–FY2024 — the rate is rising. Bridge check: FY2025 contracted within-one-year US$37,811k vs FY2026 ship-owning revenue US$36,200k + deferred-income build US$1,465k = US$37,665k, a 0.4% gap. (R/D) The market benchmark for modern tonnage is ~US$55–67k/day (E). The one realised renewal (Boheme) roughly doubled its rate while remaining ~¼ of benchmark; the oldest vessels may not renew at all (Sirius Leader renewal "appears unlikely" — 2025 AGM, R). Each successful renewal reprices up ~2x; each non-renewal removes the vessel. Age decides which. (D/R)
The repricing gap: derived legacy rates vs the market benchmark — and what the one realised renewal actually achieved.
3 · The language delta — the most important qualitative finding
Year
Outlook wording (paraphrased)
What changed
FY2023
Continues to cautiously evaluate investment opportunities; no gearing net of cash
—
FY2024
Identical formulation
—
FY2025
Stable results supported by the long-term charter model with high-quality counterparties
Boheme renewal cited
FY2026
Ageing fleet, ~80% of vessels near end of useful life; replacement costs materially higher; long-term charters materially harder to secure; the Board "may need to adopt a less risk-averse approach for continuity of business"
The stability framing, the counterparty-quality language and the zero-gearing reassurance all vanished
R — item 4 of each full-year results announcement. A management team that recycled one sentence for three years and then wrote four paragraphs of warning is telling shareholders something deliberate (O). The company's identity is the long-term charter model; management is pre-announcing it may abandon it.
4 · Segment economics — the "drag" earns the higher return on capital
FY2026
Ship owning
Agency & logistics
Revenue (US$'000)
36,200
14,393
Segment result (US$'000)
15,127
575
Margin
41.8%
4.0%
Segment assets (US$'000)
198,783
5,873
Return on segment assets
7.6%
9.8%
Return, cash-adjusted / 8-yr average
15.0% ex-cash
~19% avg FY2019–26
R/D — segment note, AR FY2019–FY2026. Ship owning's reported return is depressed because the segment carries the group's cash pile (US$198.8m of segment assets against US$95.8m of vessels).
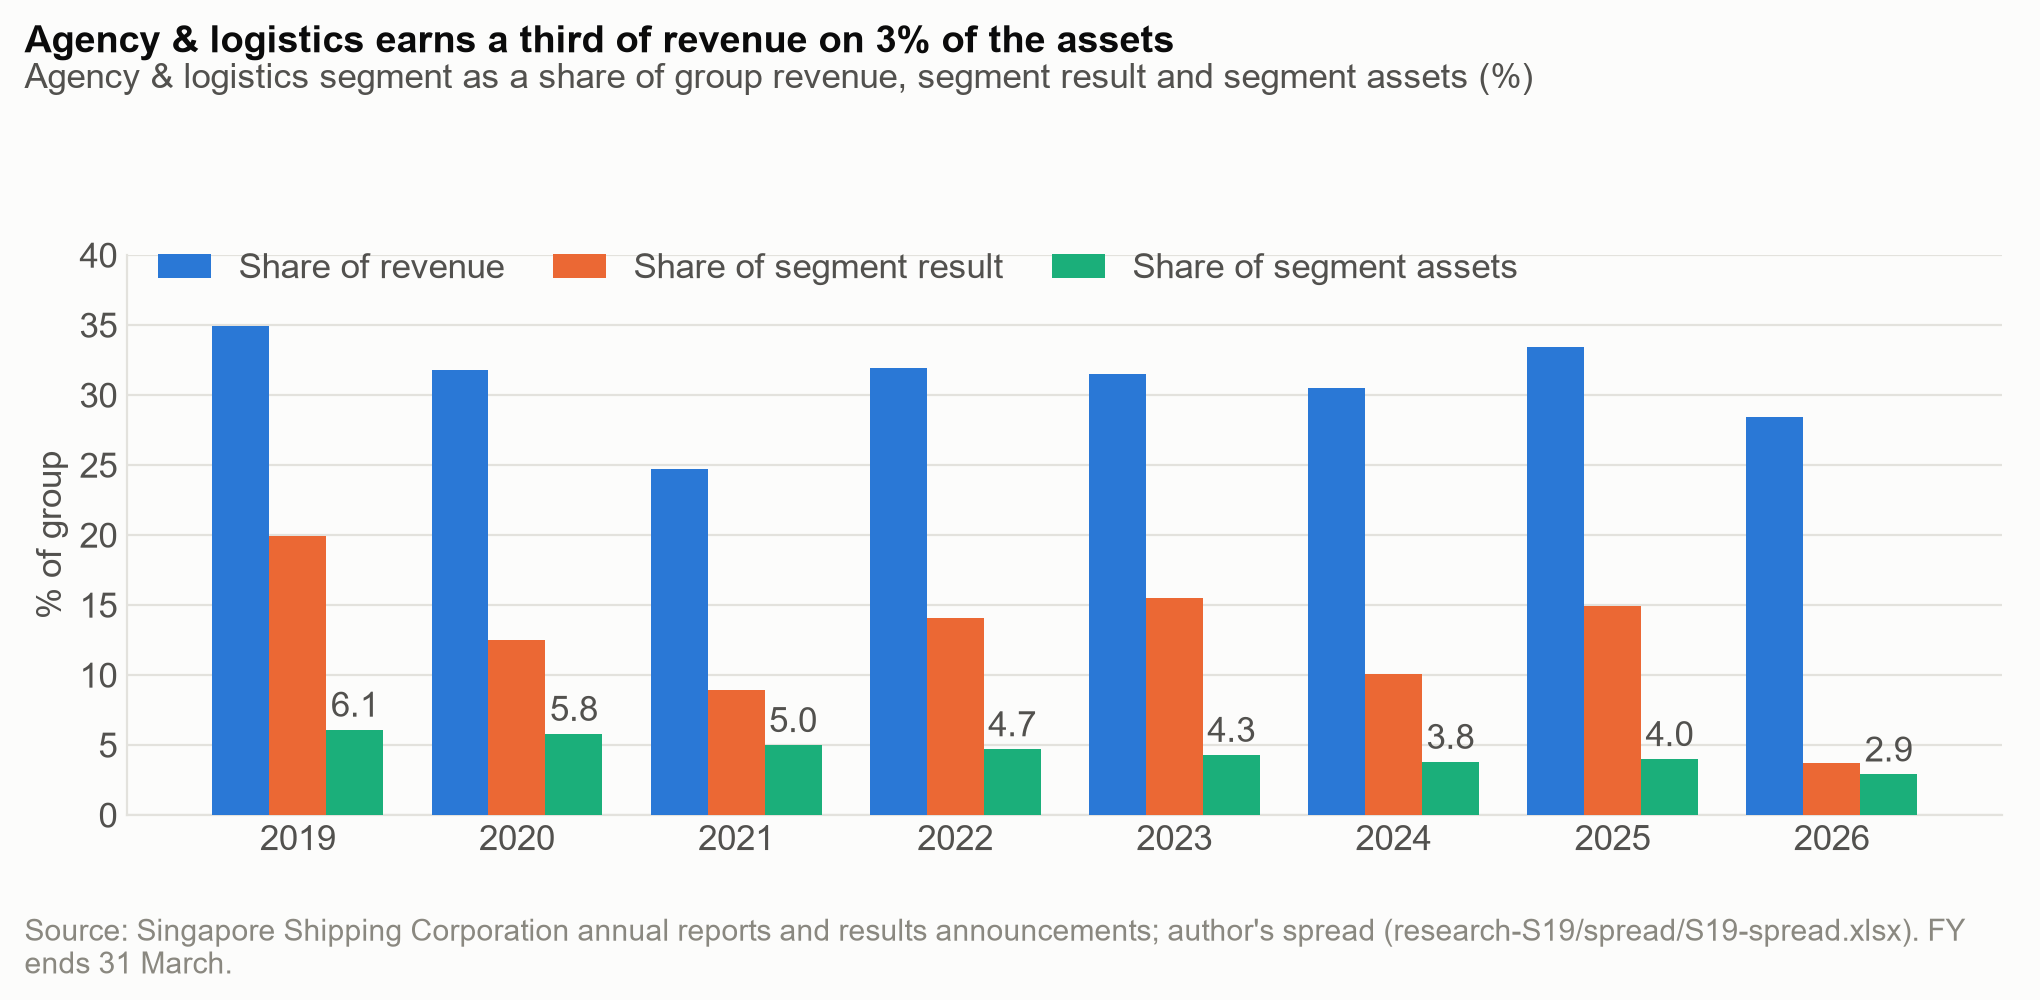
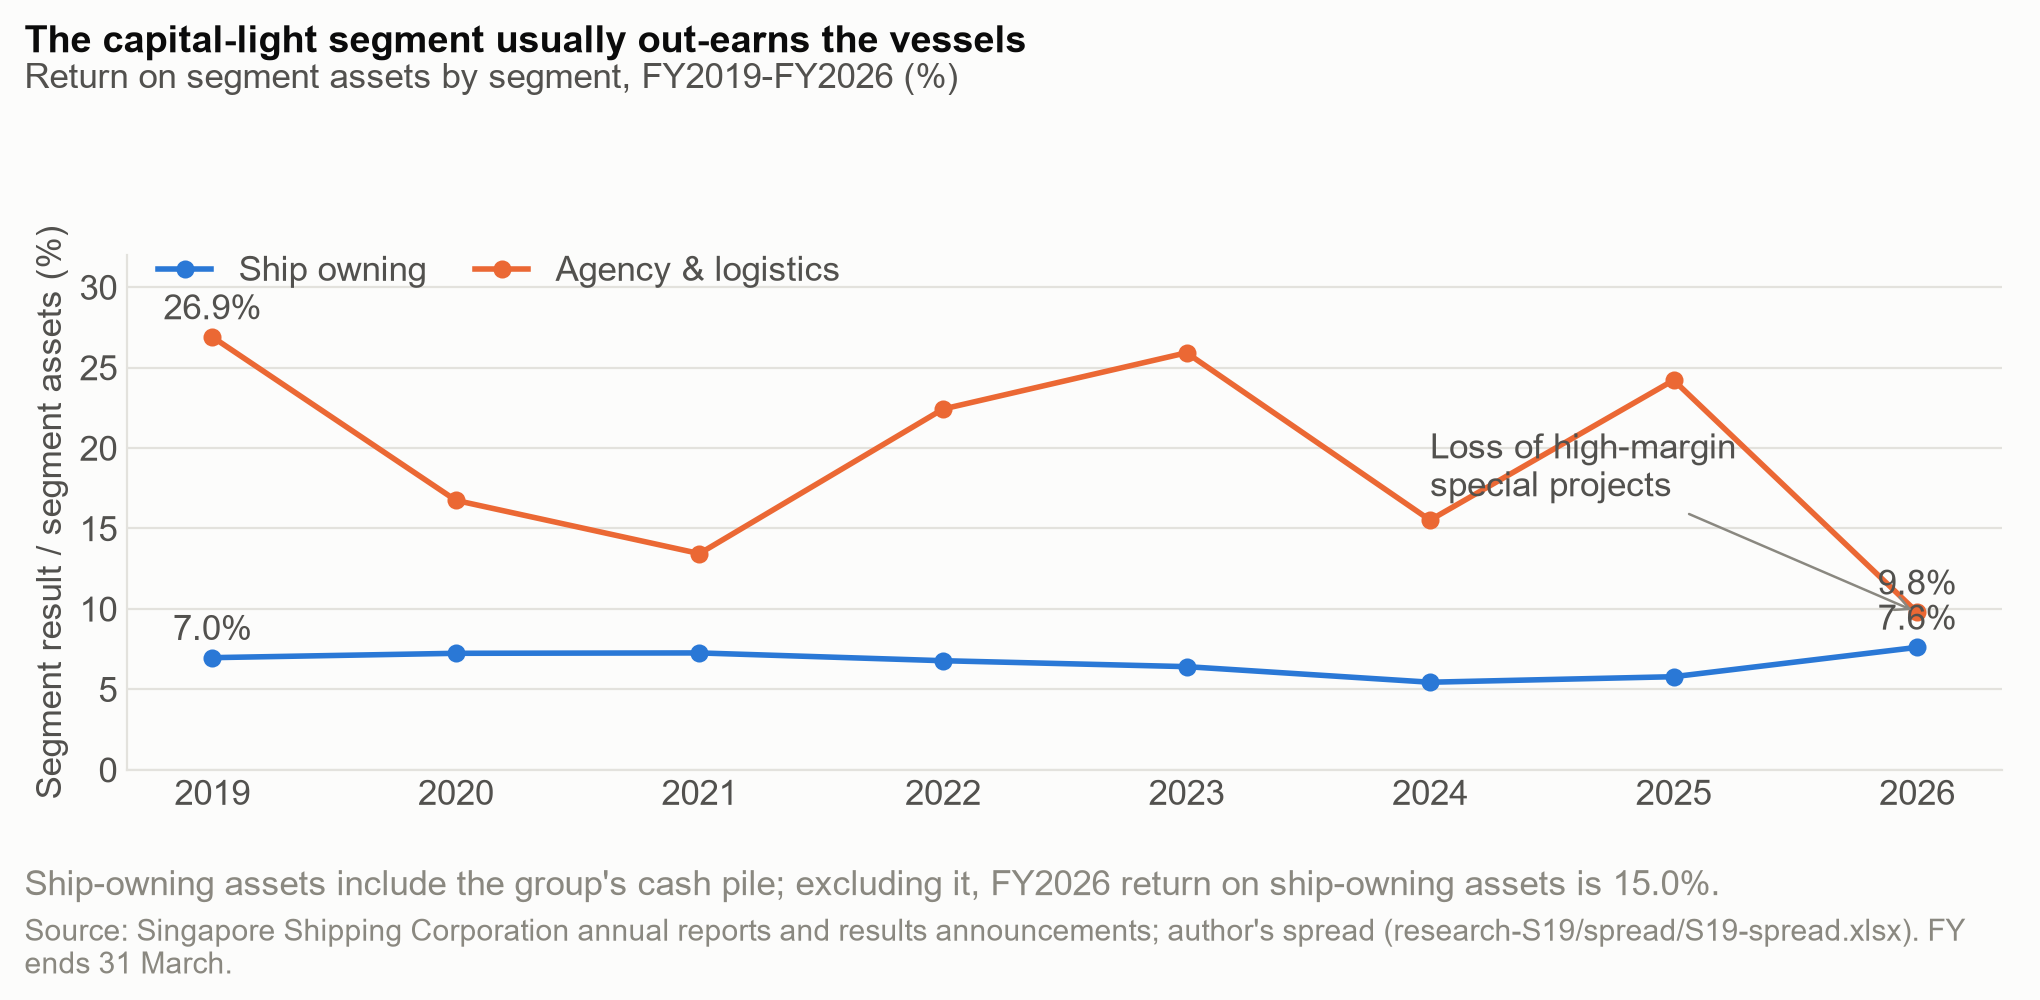
Agency & logistics has out-returned ship owning in all eight years on reported assets — ~19% average against 6.7% — on 2.9% of segment assets, with no residual-value risk, negligible debt, and a many-small-customers base that diversifies the 84% charter concentration. Its FY2026 collapse (−70.4%) is cyclical — the absence of high-margin special-project work, the same driver as the FY2021 and FY2024 troughs. The genuine criticism runs the other way: this is the segment earning the higher return, and it is the one the group has starved — its assets have shrunk every year since FY2019. (D/O)
Two segments: the capital sink that carries the group, and the capital-light diversifier.Return on segment assets, eight years: A&L above ship owning in every year.
5 · Track record, and what FY2026's record profit was made of
US$'000
FY2021
FY2022
FY2023
FY2024
FY2025
FY2026
Revenue
42,169
45,808
47,366
45,492
48,554
50,593
Net profit
10,273
9,834
11,514
9,136
11,382
16,415
Operating cash flow
21,669
21,143
20,028
17,345
20,492
23,183
Equity
96,605
105,903
117,811
123,323
130,832
144,147
Bank debt
46,907
39,827
34,517
29,207
23,897
18,587
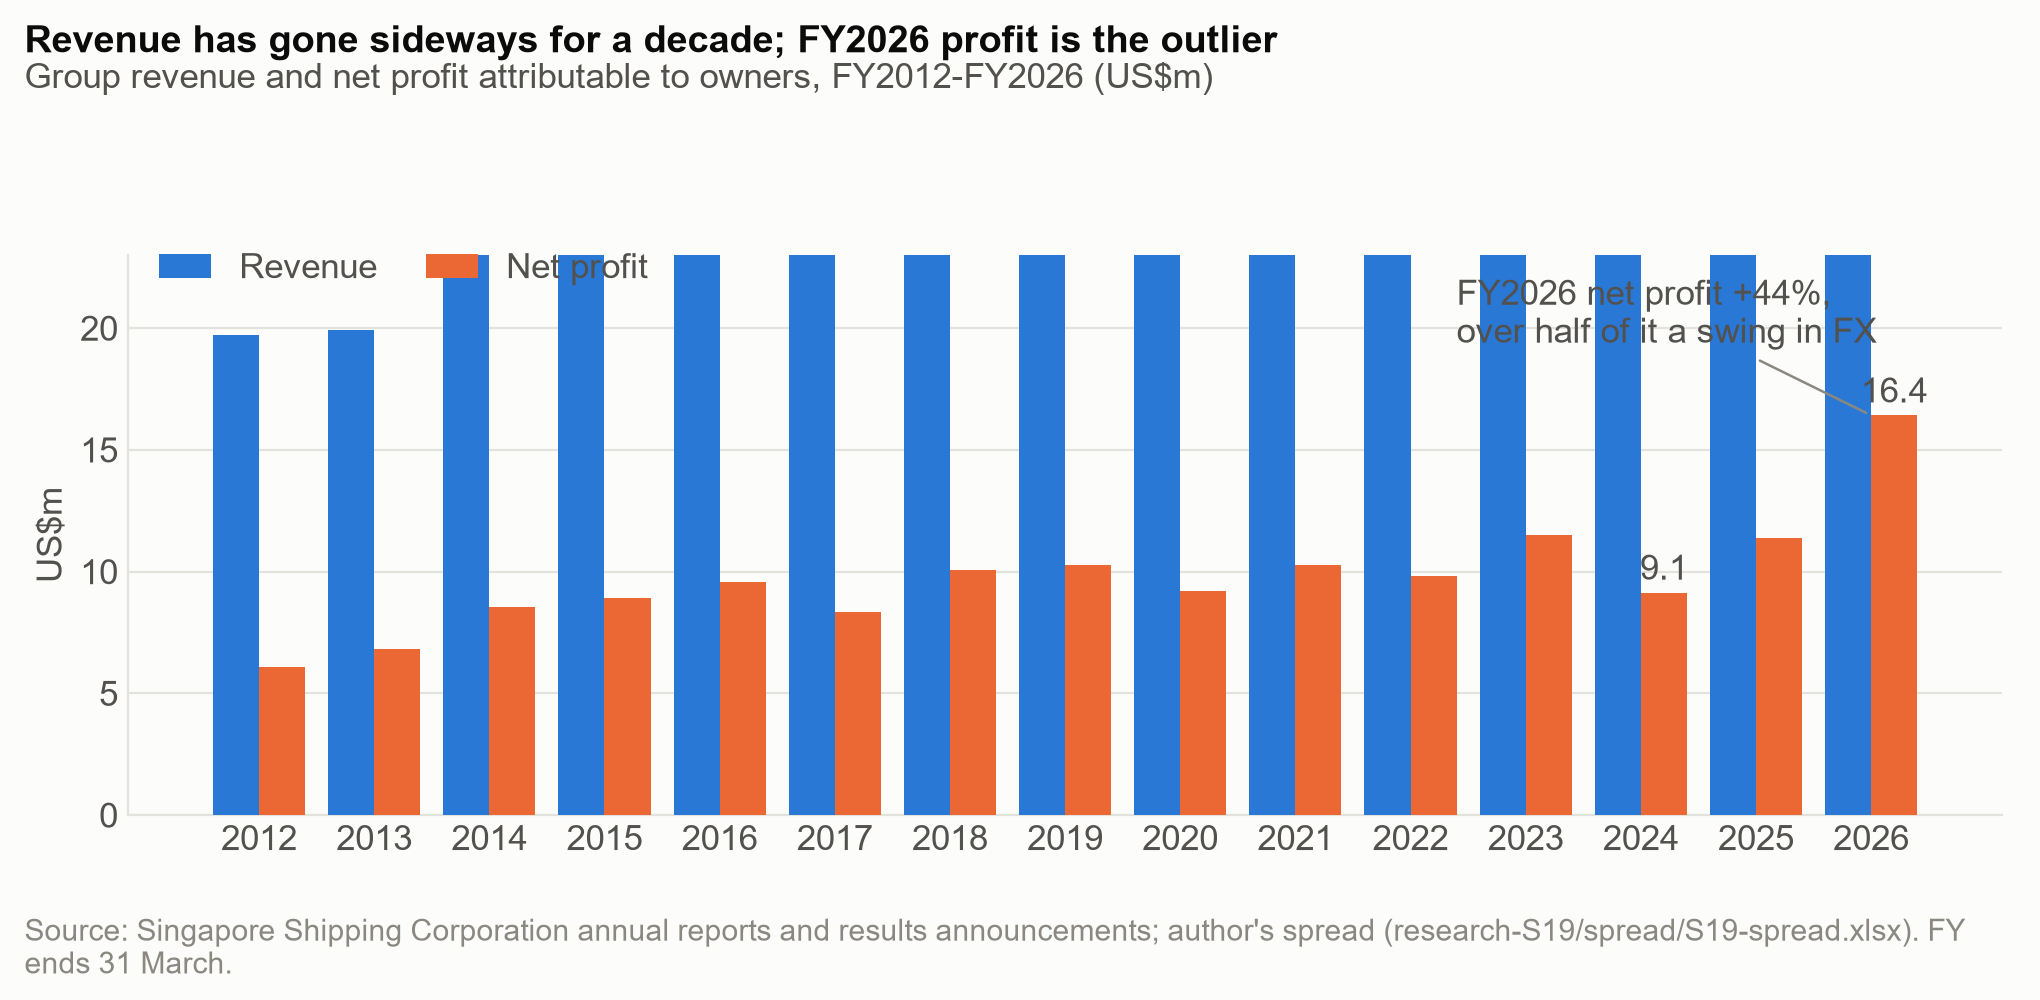
R, re-keyed. Revenue has compounded 1.2% a year since FY2016 — what a fixed fleet on fixed charters produces — while NAV per share compounded ~7.7% a year (US11.85¢ FY2011 → US35.98¢ FY2026) because profits are retained. (D)
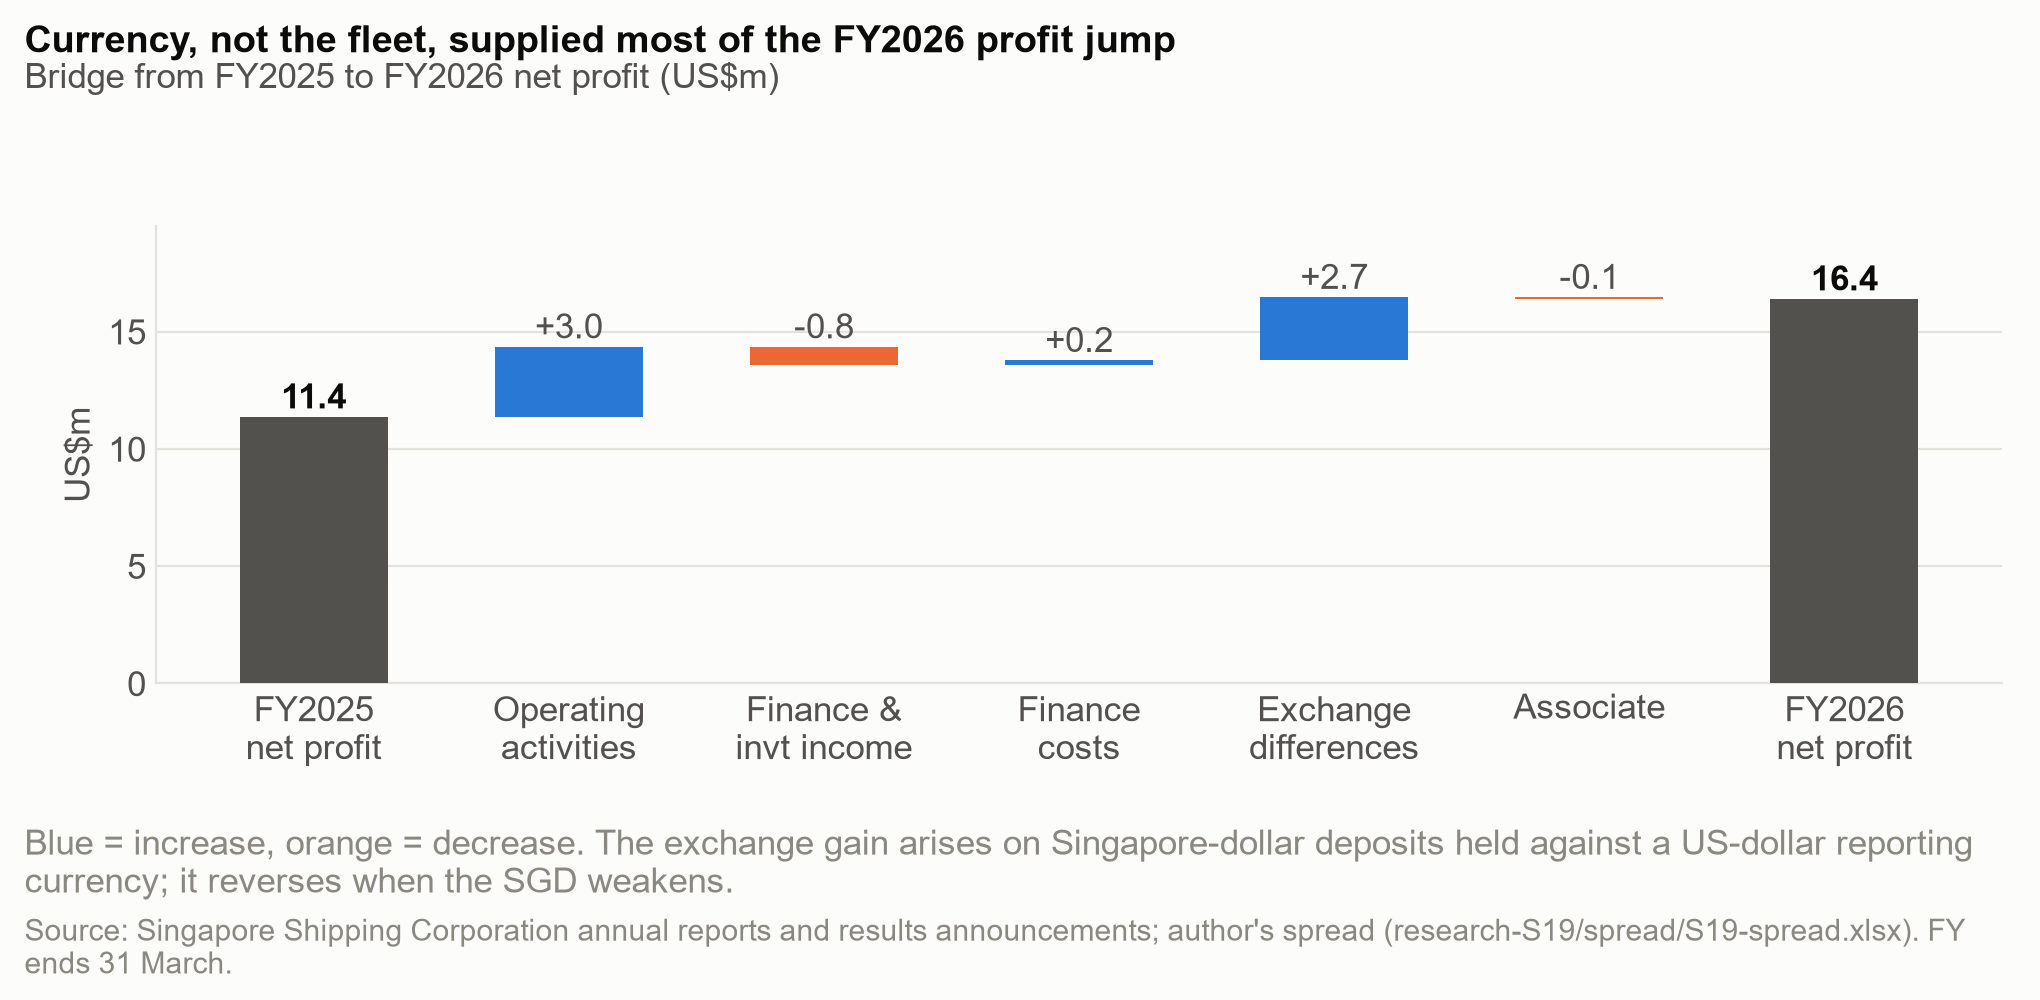
FY2026's record profit is over half currency
Profit before tax rose US$5.0m; US$2.7m of it was the swing in exchange differences on Singapore-dollar deposits translated into USD accounts (+US$2.5m in FY2026 vs −US$0.2m in FY2025). Ex-FX, profit grew 20.2% — real, but a different number from the headline 44.2%. The same line was large enough in FY2009 to turn the whole year into a loss. Sensitivity: ~US$0.95m per 1% SGD/USD move (upper bound, D). The half-on-half "deceleration" some readers flagged is the same optics in reverse: ex-FX, 1H/2H profits were US$7.05m and US$6.89m — flat. (R/D)
The FY2026 bridge: operations +US$3.0m, exchange differences +US$2.7m.
6 · Cash quality — and the number the FCF headline needs
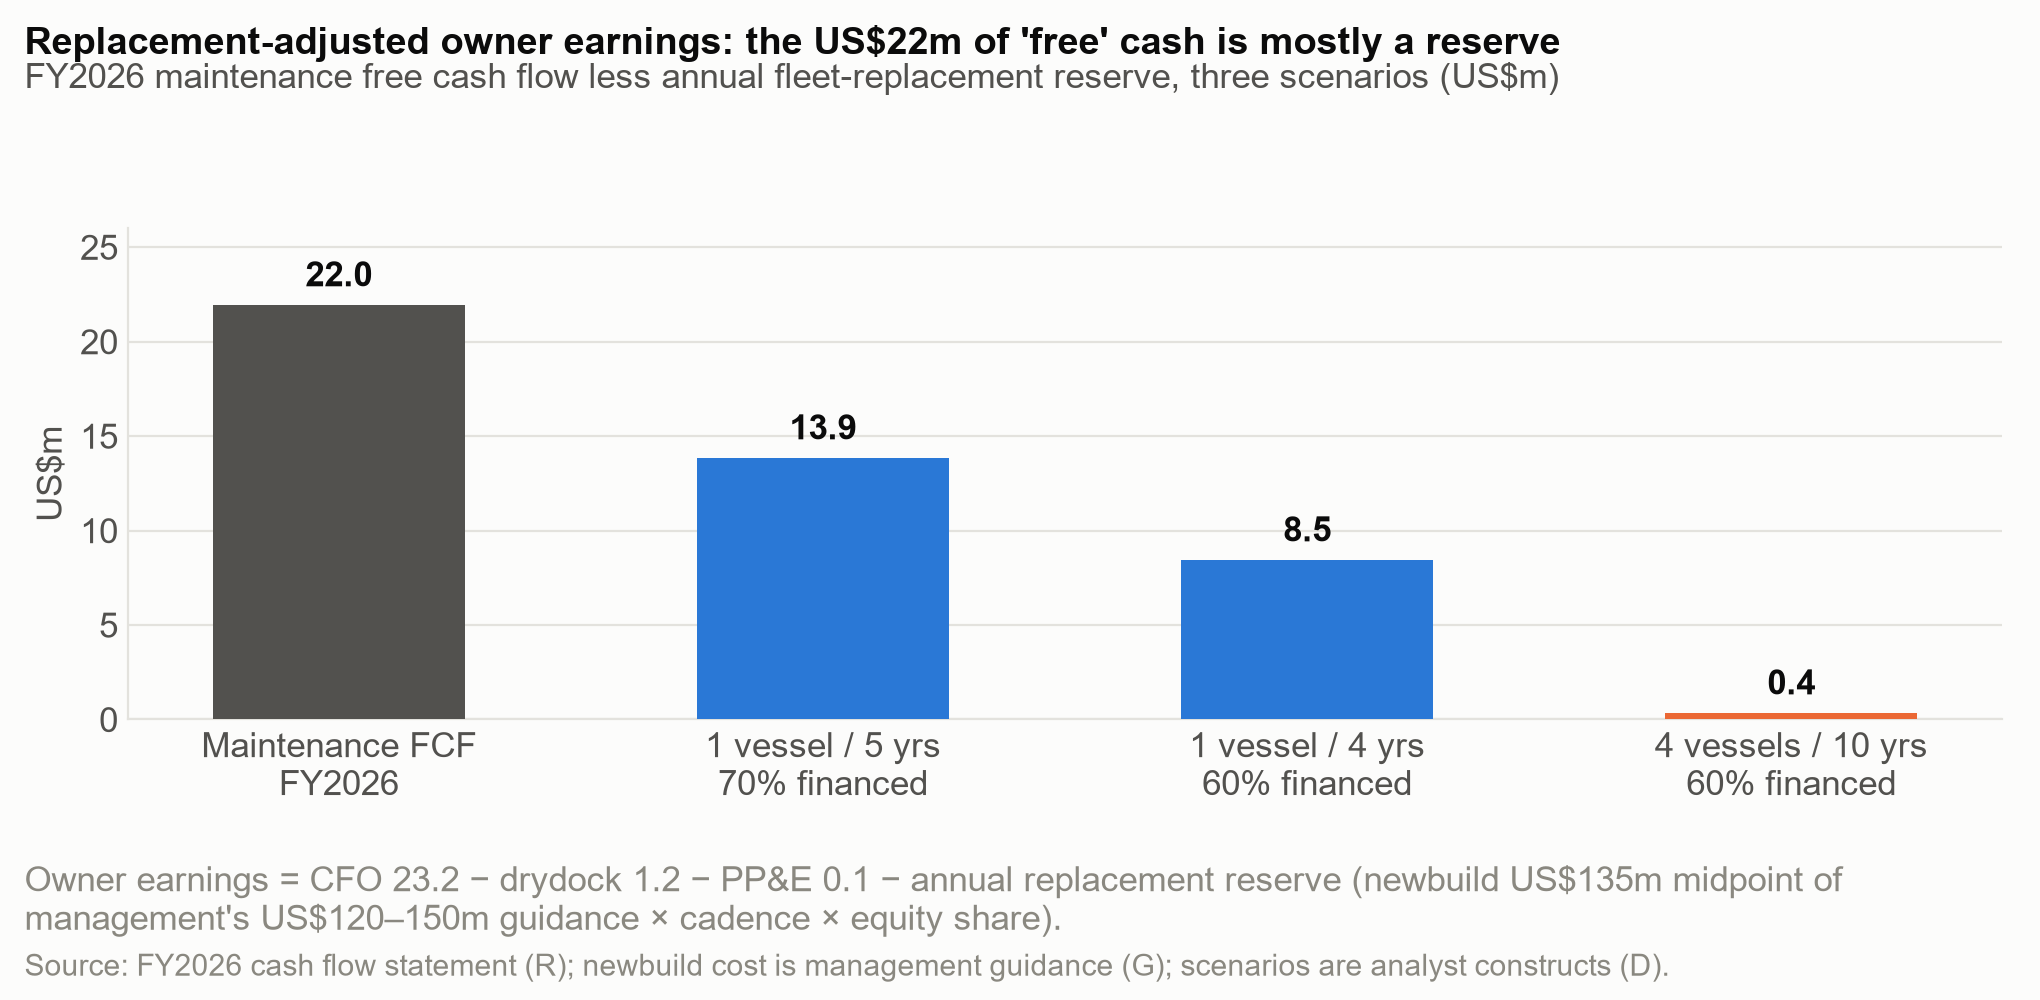
Operating cash flow has exceeded net profit every year available (1.41x–1.90x) for benign structural reasons: US$7.9m of non-cash depreciation, and deferred income building as charters are billed front-loaded but recognised straight-line. The caveat: FY2026 capex was US$1.2m against US$7.9m of depreciation — 16% — so the US$22m of "free cash flow" is partly the fleet liquidating itself. Maintenance is not replacement, and management has stated what replacement costs (US$120–150m per vessel, G). Charging an annual replacement reserve at the midpoint: (D)
Renewal cadence scenario
Annual reserve
Owner earnings
One vessel every 5 years, 70% financed
US$8.1m
US$13.9m
One vessel every 4 years, 60% financed
US$13.5m
US$8.5m
Four vessels over 10 years, 60% financed
US$21.6m
US$0.4m
D. Distributable economics sit somewhere between substantial and approximately zero — and the board's renewal cadence, not next year's P&L, decides which. The US$22m should never be capitalised as a perpetuity.
Replacement-adjusted owner earnings under three renewal cadences.
A pre-registered accounting warning for FY2029–31: as old vessels' book values reach zero while they keep trading, depreciation stops and charter revenue falls almost straight to profit — a mechanical earnings jump that is optics, not economics. The deferred-income reversal will simultaneously drag reported operating cash flow the other way. The P&L and the cash-flow statement will tell opposite stories in that window; neither will be lying. (D/O)
7 · Six years of capital allocation, as filed
US$’000, financial years ended 31 March, from the consolidated statements of cash flows in the FY2022, FY2024 and FY2026 annual reports. †† The dividend row is the CASH paid: FY2023’s declared dividend was US$2,741k, of which US$1,689k was satisfied by issuing new shares under the scrip dividend scheme. Total capital spend is the two lines above it added together: the company reports plant purchases and drydocking payments separately, and drydocking is the larger of the two in every year. Section 8.3 walks the FY2026 column in full; this is the same walk six years deep.
US$’000
FY2021
FY2022
FY2023
FY2024
FY2025
FY2026
Operating cash flow
21,669
21,143
20,028
17,345
20,492
23,183
Purchase of property, plant and equipment
322
88
268
164
130
57
Payment for drydocking
1,050
888
1,711
1,985
2,666
1,175
… total capital spend
1,372
976
1,979
2,149
2,796
1,232
Repayment of bank borrowing
7,667
7,080
5,310
5,310
5,310
5,310
Repayment of lease liabilities
317
33
298
368
435
471
Finance costs paid
1,679
1,451
1,242
1,080
894
718
Dividends paid in cash††
2,930
1,484
1,052
2,981
3,076
3,120
Treasury shares purchased
210
1,336
92
375
–
–
Interest received
449
179
843
2,320
3,020
1,759
Cash and bank balances at year end
38,726
44,597
59,393
66,577
80,014
97,643
The two years the track-record table could not show are the second and third best of the six. Operating cash flow was US$21.7m in FY2021 and US$21.1m in FY2022, both above FY2023, FY2024 and FY2025. Read from FY2023 onward the series looks like a climb from US$20.0m through a US$17.3m trough to a US$23.2m record; read across all six it is a business that generated between US$17m and US$23m every year for six years, and whose FY2026 record beats a level it had already reached in FY2021 by US$1.5m. Both figures are now filled in from the FY2022 annual report.
Capital spend is small, and most of it is drydocking rather than plant. Six years of purchases of property, plant and equipment come to US$1.03m in total. Drydocking, which maintains existing vessels rather than adding to them, is US$9.48m over the same period and larger than the plant line in every single year. The combined US$10.5m sits against US$48.8m of depreciation charged over the same six years — 8,309, 7,991, 8,287, 8,164, 8,177 and 7,907 — so capital spend has replaced 21.5% of what the accounts wrote off. The company is not renewing the fleet out of cash flow; it is maintaining it, and the accounts say so plainly once the two lines are read together.
The debt repayment is a fixed schedule, not a decision. Exactly US$5,310,000 of bank borrowing was repaid in each of FY2023, FY2024, FY2025 and FY2026 — the same figure four years running, which is contractual amortisation. Finance costs paid have fallen every year without exception, from US$1.68m to US$0.72m, a 57% reduction, because the balance being charged shrinks on that schedule. Almost nothing in those two rows is discretionary, which is the point: cash available for anything else rises mechanically each year as the interest bill retires.
The dividend row is cash, and in FY2023 the dividend was not all cash. The US$1.05m in that column is the cash half of a dividend of US$2.74m; the other US$1.69m was satisfied by issuing new shares under the scrip dividend scheme. So the declared dividend ran US$2.93m, US$1.48m, US$2.74m, US$2.98m, US$3.08m, US$3.12m — a single cut in FY2022 and a recovery since, not the collapse and tripling the cash line alone suggests. The distinction matters because a scrip dividend conserves cash without cutting the distribution, which is a different decision from cutting it. Buy-backs run the other way: US$2.01m across FY2021 to FY2024 and nothing at all in the last two years. The company stopped repurchasing at almost exactly the point the dividend recovered.
Where six years of cash went, in total: US$123.9m generated by operations; US$10.5m of capital spend; US$14.6m of dividends; US$36.0m of bank repayment and US$1.9m of lease repayment; US$7.1m of finance costs; US$2.0m of buy-backs. Against that, US$8.6m of interest was received. Cash and bank balances rose from US$30.5m at 31 March 2020 — where these six years of flows begin — to US$97.6m. The US$38.7m in the table is the balance at the end of FY2021, after the first year’s flows have already run.
8 · Balance sheet — close to unimpeachable, with one definitional nuance
Cash of US$97.6m (mostly time deposits) against US$18.6m of bank debt amortising at exactly US$5.31m a year to ~FY2030: net cash US$78.6m, equity 70.8% of assets, interest cover 17.3x, no maturity wall, no covenant cliff, share count unchanged for years. (R/D)
The nuance: deferred income of US$33.0m is cash already received for charter service not yet delivered — a genuine claim on future delivery. Management itself nets it off, quoting net cash of US$46.1m (97.6 − 18.6 − 33.0; the bridge reconciles exactly). Both definitions are defensible; the conservative one is management's own. And critically, the chairman has stated in writing that this cash is not surplus — current reserves are insufficient to fund fleet replacement at today's capital costs and must be preserved (R, FY2026 Chairman's Message). Whatever the cash pile suggests, the company has ruled out, in writing, the use of it that a reader might assume. (R/D)
Context on asset values, handled with care: press-sourced indications (E, unverified, cycle-dependent) put the fleet's market value at US$250–290m against a US$95.8m carrying value, and a 26-year-old PCTC sold for US$42m in July 2026. Historical depreciation has outrun economic consumption — prior years' profits were conservatively stated. These are secondhand-market indications in a hot asset market; an aged vessel's value is charter-attached, and the same rate cycle that supports them supports renewal economics — one factor, not two. (E/D)
Eleven years of depreciate-repay-accumulate.
9 · The credit view — the same company, read by a lender
SSC has no public bonds, no rated debt and no agency rating. What follows is the credit lens applied to the same filings: leverage, coverage, cash conversion, liquidity, security and what a replacement programme would do to all five. It was built once and then attacked by a separate review with a mandate to break it rather than confirm it — eight remits, from build integrity through adversarial challenge to a pre-mortem that assumes the conclusion is already wrong. Where the review changed something is more useful than where it agreed, and §8.7 records it. (D/O)
The leverage is not the credit question
Total debt of US$19.1m against EBITDA of US$20.7m and cash of US$97.6m: gross leverage 0.92x, EBIT interest cover 17.3x, funds from operations at 114% of debt. Every one of those sits in the strongest band any agency publishes, and none of them is what a credit committee would spend its time on. The constraint is five vessels, US$50.6m of revenue, three customers at 84% of it and one at 42% — a franchise of four charter relationships whose contracted book is shortening (weighted average term about 3.5 years, from 6.0) and whose FY2026 contract-book bridge has an unexplained negative US$21.9m residual after expected runoff, which does not by itself establish lost contracts. A credit like this is not rated on its leverage. (R/D/O)
9.1 · Six years of credit ratios
US$'000 unless stated
FY2021
FY2022
FY2023
FY2024
FY2025
FY2026
EBITDA
19,059
18,879
18,765
16,210
17,978
20,695
EBITDA margin
45.2%
41.2%
39.6%
35.6%
37.0%
40.9%
Total debt (bank + leases)
46,907
39,827
34,517
29,207
24,801
19,079
Cash and bank balances
38,726
44,597
59,393
66,577
80,014
97,643
Net debt / (net cash)
8,181
(4,770)
(24,876)
(37,370)
(55,213)
(78,564)
Total debt / EBITDA
2.46x
2.11x
1.84x
1.80x
1.38x
0.92x
EBIT / finance costs
6.44x
7.65x
8.42x
7.55x
10.54x
17.28x
FFO / total debt
—
—
53.2%
59.7%
81.1%
113.9%
FFO ex-interest income / total debt
—
—
50.8%
51.8%
68.9%
104.7%
Free operating cash flow / total debt
—
—
52.3%
52.0%
71.4%
115.1%
Equity / total assets
55.1%
59.2%
62.9%
65.2%
67.8%
70.8%
Capex / depreciation
—
—
23.9%
26.3%
34.2%
15.6%
R/D — every input is reported; every ratio is a live formula in the spread. Total debt is bank borrowing plus lease liabilities. Leases are disclosed in the sources used for FY2025–FY2026 only, so FY2021–FY2024 is bank borrowing alone and is understated by an amount whose annual repayment ran at US$0.3–0.4m. FY2021–FY2022 cash-flow detail was not extracted and is left blank rather than estimated; FY2023 inherits an unreconciled cash-flow difference already recorded in the assumptions register.
Every leverage and coverage measure improved in every year of the series — net debt of US$8.2m in FY2021 became net cash of US$78.6m, and the company repaid US$36.0m of bank debt over the six years — US$7,667k in FY2021 and US$7,080k in FY2022, then exactly US$5,310k in each of FY2023 through FY2026. On the amortisation schedule the facility retires during FY2030: no maturity wall, no refinancing event, and the whole balance swapped from floating to fixed at a weighted average effective rate of 3.24%, unchanged from FY2025. (R/D)
Deferred income is not treated as debt here, and that is the agency convention rather than a generous reading. The US$33.0m arises from straight-lining the lease component of charter revenue — cash collected ahead of the revenue it will be recognised against — and it is discharged by providing charter service, not by paying cash. Including it would take leverage to 2.52x, which is still minimal. (R/D) The real point is not leverage but forward cash conversion: as charters run off, that US$33.0m unwinds into revenue with no cash behind it, in the same window in which the P&L is flattered by depreciation ending on fully written-down vessels (§6). The two statements will pull in opposite directions and neither will be wrong.
9.2 · The forward view is not published here
The operating model carries these credit measures beyond the last reported year. Consistent with the rest of this page, the forward view and its projected credit measures — forecast EBITDA, closing debt and cash, and the leverage and debt-service cover derived from them — are not published here. They are held with the private working files behind the rated view 🔒. What the reported record shows without any forecast is in §9.1: the facility amortises on a contracted schedule that retires it during FY2030, and every leverage and coverage measure improved in every year of the six-year series. The question a forecast cannot answer is the one that carries this credit — what happens if the board reintroduces debt to renew the fleet — and that is stressed on reported figures in §9.5.
9.3 · Where the cash actually went
FY2026 cash waterfall (US$'000)
Amount
Note
Revenue
50,593
Ship owning 36,200; agency and logistics 14,393
Cash operating costs
(29,898)
Revenue less EBITDA
EBITDA
20,695
Operating result 12,788 plus depreciation 7,907
Non-operating items inside operating cash flow
111
Residual investment income and realised-versus-reversed FX
Working capital and deferred income
2,379
Of which deferred income +1,465
Income tax paid
(2)
Singapore-flag shipping income is largely exempt
Net cash from operating activities
23,183
Ties to the reported figure
Capital expenditure
(1,232)
PP&E 57 plus drydocking 1,175 — 15.6% of depreciation
Free operating cash flow
21,951
Before any allowance for fleet replacement
Dividends paid
(3,120)
1.0 Singapore cent per share
Interest received / finance costs paid
1,041
1,759 received in investing; 718 paid in financing
Bank borrowing and lease repayment
(5,781)
Contractual amortisation
Associate capital reduction and dividend
1,867
The associate became a subsidiary during the year
Purchase of other investments
(1,190)
Effect of exchange rate changes on cash
2,861
Translation of Singapore-dollar deposits
Increase in total cash and bank balances
17,629
US$80,014k to US$97,643k — ties exactly
R/D — consolidated statement of cash flows and note 19, FY2026. A trap worth naming: the reported cash and cash equivalents line fell US$53.3m in FY2026, purely because US$70.9m was moved into time deposits with maturity over three months, which the statement classifies as investing. Total cash and bank balances rose US$17.6m. Reading the equivalents line alone inverts the year.
The largest single adjustment: free cash flow is partly the fleet liquidating itself
FY2026 capex was 15.6% of depreciation. A fleet spending that little is consuming itself, and the cash that appears free is partly the proceeds. Charging an annual replacement reserve at management's own US$135m midpoint turns US$22.0m of free operating cash flow into US$13.9m, US$8.5m or US$0.4m depending on renewal cadence (§6). Under the cadence that actually addresses the problem management has described, it is approximately zero. The reported 115% ratio of free operating cash flow to debt is arithmetically correct and economically misleading, and no credit conclusion should rest on it unadjusted. (D/G)
9.4 · Liquidity, security and what is not disclosed
Liquidity test (US$'000)
12 months
24 months
Cash and bank balances
97,643
97,643
Funds from operations
21,734
43,468
Total sources
119,377
141,111
Bank amortisation, leases, capex, dividends
(10,115)
(19,816)
Sources / uses
11.80x
7.12x
D — FY2026 free cash generation, capex and dividends held flat. This is a liquidity test, not a projection. No committed undrawn facility is disclosed, so none is counted as a source.
The contractual maturity note supports it: total financial liabilities carry at US$24.7m and total US$25.9m undiscounted, of which US$11.9m falls within a year and US$13.9m between one and five. Nothing falls due beyond five years. The bank facility is secured by mortgage over vessels carrying at US$51.9m — 2.79x the drawn balance on book values alone, before any credit for the press-sourced market indications in §7, which are unverified and are not relied on. (R/D/E)
Which ships secure the loan is not disclosed — but note 10 narrows it, and the residue does not matter
Every year from FY2022 to FY2026 the accounts say “the vessels mortgaged” without naming or counting them. Note 10's vessel-level cost and depreciation settles the direction anyway. In FY2026 the mortgaged pool was 54.2% of vessel carrying value but only 43.8% of vessel depreciation — US$51,947k against US$95,787k of book, declining US$2,519k against US$5,747k of fleet depreciation. That implies an average remaining life of 20.6 years for the mortgaged ships against 16.7 for the fleet and 13.6 for the unmortgaged: the bank holds the newer tonnage. (R/D) The pool has also been shrinking as the debt amortises — the FY2022 fall of US$15.5m is far larger than any plausible depreciation charge, so at least one vessel came out of the mortgage that year. (D)
Why it is recorded rather than left as an open question: the count cannot be established, but the consequence can be bounded. Against US$18.6m of secured debt there is US$43.8m of unmortgaged vessel book and US$97.6m of cash. Even on the least favourable reading — the mortgage covering only the single longest-lived ship — an unsecured claim is still covered many times over. The ambiguity is real and changes nothing at this capital structure. It would begin to bite only after a debt-financed newbuild, when secured debt rises toward US$106m and the unsecured residual becomes the tonnage nearest the end of its life. (D/O)
Three things a credit file would flag as not disclosed. The company states it complied with all covenants at 31 March 2026 and 2025, but the thresholds themselves are not published, so headroom cannot be measured. No committed undrawn facility is disclosed. The deposit-book currency split is undisclosed, which is why the FX sensitivity in §5 is an upper bound. And the mortgaged vessels are never named or counted — see above. None is assumed benign. (R/L)
9.5 · The credit question is the replacement decision
Everything above describes a company that is not going to miss a payment. The credit question is what happens when it stops being that company — and management has said in writing that it may have to. One replacement vessel at the stated US$135m midpoint, financed 65% with debt, replacing a vessel earning the contracted rate of US$22.5k/day (§2 — corrected from the lease-line basis on 20 August 2026, which makes pro forma leverage higher at every rate):
Charter rate secured (US$/day)
25,000
35,000
45,000
55,000
65,000
Incremental EBITDA from the rate uplift
913
4,563
8,213
11,863
15,513
Pro forma EBITDA
21,608
25,258
28,908
32,558
36,208
Pro forma total debt
106,829
106,829
106,829
106,829
106,829
Pro forma total debt / EBITDA
4.94x
4.23x
3.70x
3.28x
2.95x
Pro forma net debt / EBITDA
2.61x
2.23x
1.95x
1.73x
1.56x
D — the market benchmark for modern tonnage is quoted at US$55–67k/day (E, unverified); Boheme, the one realised renewal, was re-let at about US$41.5k/day (E). Read the gross line: the cash is consumed by the equity cheque in the same transaction, so the net measure double-counts the comfort. Same capital expenditure, two full bands of difference — the whole of it decided by whether a charter is attached, and at what rate.
Reverse stress: the balance sheet does not fund one vessel
Total debt consistent with 4.0x at today's EBITDA is US$82.8m. Less the existing US$19.1m, new capacity is US$63.7m — which funds US$98.0m of vessel cost at a 65% debt share, or 0.73 of one vessel at management's midpoint. Without incremental charter income the company cannot debt-finance a single replacement and stay under 4.0x. The full programme is further out of reach than that: four vessels is US$540m, the equity cheque at a 65% debt share is US$189m against US$144.1m of total book equity, and the debt drawn would be 17.0x FY2026 EBITDA before any new vessel earns anything. Staged renewal part-funded by retained earnings is the only version that closes — which is why the chairman's written statement that current reserves are insufficient is arithmetically correct rather than defensive: US$97.6m does not buy one vessel at US$120–150m. (D/G/R)
9.6 · What a credit file would watch, and what would settle it
The terms of the next vessel decision — counterparty, rate, duration, financing. A vessel arriving with a long-dated charter near benchmark is a two-to-three-times credit. The same vessel without employment is a four-and-a-half-times credit at identical cost. All four terms are knowable at announcement.
The 42% customer. One counterparty failure removes 42% of revenue. The company notes its counterparties have no history of payment default — true, and narrower than it sounds, given Daiichi Chuo's 2015 civil rehabilitation (§1). A single observation of survival is not evidence the exposure is small.
Whether the cash stays where it is. Its size relative to US$25.9m of total contractual liabilities is the single largest analytical support in the file. A distribution or a related-party application of it would remove that support directly.
The roll-forward residual, and what happened to the US$21.9m. Not the beyond-five-year bucket, which empties mechanically. The residual reconciled within US$1,000 of rounding for eight years, then was +US$75.8m in FY2025 and −US$21.9m in FY2026. A dated roll-forward is needed to distinguish earned hire, new or amended contracts, currency and other movements. The FY2027 lessor note may narrow that question; the residual alone cannot answer it.
A permanent CFO. Four departures since January 2023 and none in post while the largest capital decision in a decade is pending (§9). The credit cannot improve while the function that would execute a US$500m programme has no permanent head.
9.7 · The review, and the two things it overturned
The credit view was attacked by a separate review across eight remits: build integrity, scope and publication boundary, the credit view itself, adversarial challenge, integration, hardening, builder-facing lessons, and a pre-mortem that assumes the conclusion is already wrong. Twenty-nine findings, four of them severity-1. Two changed facts on this page. (D/O)
Overturned #1 — the independent-director departure was not churn
The prior reading treated rapid independent-director turnover as part of the governance problem. It was wrong. Pebble Sia Huei-Chieh, on the board since 28 July 2017, stepped down at the July 2026 AGM under the nine-year tenure limit in the SGX mainboard rules — a required, scheduled rotation, and the cessation announcement says so in terms. (R) The board's response cuts the other way: with effect from 31 July 2026 a new independent director was appointed as chairman of the nominating committee and a member of the audit-and-risk and remuneration committees, and a lead independent director was named for the first time. The board is now five, of whom three are independent. (R) That is a governance strengthening, and the earlier version of this page did not have it. See §9.
Overturned #2 — the source library was missing the whole July–August sequence
Source completeness had been asserted rather than tested. Retrieving the full 2026 announcement tape and differencing it against the library found twelve documents missing, including the 38th AGM results, the board and committee reconstitution, the independent-director cessation and appointment, the chief operating officer and company-secretary cessations, and the acting-CFO cessation. All twelve were retrieved, checked for openability and filed. (R) A 24 August refresh then added the AGM minutes, the scrip despatch/election notice and the chairman's latest interest notice; none changes the operating or credit inputs.
Challenge to the credit view
Outcome
What it changed
Free operating cash flow is overstated; capex at 15.6% of depreciation means the ratio describes a fleet consuming itself
Upheld
Replacement-adjusted cash flow carried alongside the reported ratio, with an explicit warning against extrapolating it
Funds from operations are flattered by interest income earned on the cash pile, not by the business
Upheld
An ex-interest-income line added through the ratio history — 104.7% against 113.9% — with the deposit-rate sensitivity attached
The governance reading mislabels a scheduled rotation as instability
Upheld
The most useful single finding of the review. Corrected above and in §9
Which vessels secure the facility is unresolved, and it changes what an unsecured claim would recover
Upheld
The annual report says "vessels"; the operating model reads it as one. Recorded as an open gap rather than assumed either way
The cash is earmarked against replacement, so it should not count as ordinary liquidity
Upheld in substance, rejected as an adjustment
Stated intention is not a legal restriction. But the point cuts twice: the cash is not only earmarked, it does not fund even one vessel at US$120–150m
The deferred-income unwind will drag future operating cash flow
Upheld forward, rejected as debt
It is discharged by providing charter service, not by paying cash. Carried as the window in which the P&L and the cash-flow statement tell opposite stories
FY2026 profit is more than half currency, so the earnings are not what they appear
Rejected
Exchange differences sit below the operating line and are excluded from EBITDA by construction. Correct about net profit (§5); touches no credit measure here
Net leverage should not be used; the cash is not free
Rejected as framed
Every measure driving the conclusion is already on gross debt. The replacement stress reads the gross line and discards the net one
D/O — the full review record, including the build-integrity findings and the pre-mortem, is held with the private working file. One challenge — whether scale alone should place this credit lower regardless of payment capacity — was not resolved by evidence and is recorded as an open disagreement rather than averaged away. The discriminating evidence is named in advance: the terms of the next vessel decision.
Consistent with the rest of this page, the credit conclusion these teams reached is not published here. What is published is the evidence, the ratios, the waterfall, the stress work on reported figures and the record of what the review changed — which is the part a reader can check. The forecast the credit view was built on is not published here; it sits with the private working files behind the rated view 🔒. Working figures tie to the credit sheets of the model workbook.
10 · Governance — both columns of the ledger, dated
Corrected 20 August 2026 — board turnover was partly scheduled, and the board strengthened. The independent-director departure of July 2026 was the nine-year tenure limit under the SGX mainboard rules, not instability: Pebble Sia Huei-Chieh had served since 28 July 2017 and the cessation announcement states the rule. (R) With effect from 31 July 2026 the board appointed a new independent director as nominating-committee chairman and a member of the audit-and-risk and remuneration committees, and named a lead independent director for the first time. The board is now five, three of them independent. (R) The executive chairman still sits on the nominating committee that governs board appointments, and all 2026 resolutions passed — the only meaningful dissent was 0.83% against one independent director's re-election and 1.06% against the general share-issuance authority. (R/D)
Finance-function churn at the worst possible moment. Four CFO departures since January 2023; the company still has no CFO, only a Financial Controller — who now signs the company's announcements. The acting CFO's cessation announcement states there were no financial-reporting concerns and no disagreements with the board (R), which is a mitigant worth carrying and not a resolution — while facing the largest capital decision in a decade. Company-secretary and independent-director turnover has been similarly rapid. For a five-vessel, two-segment group, that is a great deal of churn in exactly the functions that produce the numbers. (R)
The chairman's message contains a verifiable inaccuracy. FY2026's claim that the group has never reported a loss since listing is contradicted by the company's own filings (FY2009 net loss of US$3.5m). The sharper finding: FY2023's message stated the exception correctly, and FY2026 dropped it — the company overwrote its own earlier accurate disclosure. The dividend half of the claim survives its hardest test: even the FY2009 loss year paid the full 1.0¢ dividend. (R)
Insiders are heavy, persistent buyers. 96 director interest-change notices and 351 daily buy-back notices in twelve months; after the 20–21 August purchases the chairman holds 43.934% and receives ~44% of dividends. Alignment is real. So is the scale of the management take: key management compensation plus payments to director-related companies (~US$5.0m) exceed total dividends to all shareholders (~US$3.1m) each year. (R/D)
The family's other listco is the observable governance test, and it reads both ways. Against: the 2021 Stamford Land rights-issue allocation dispute (resolved without admission via a S$2m donation), failed low-ball general offers on both listcos in 2005–06, a 2018 defamation suit against an activist. For: ~S$187m returned to SSC holders in FY2006–08 after peak-cycle vessel sales, treasury cancellation in 2020, a bonus forfeiture in 2023, and a decade of insider buying with zero recorded sales. (E) The realistic tail-risk is not expropriation but a future low-ball privatisation attempt at maximum pessimism — the 2005 precedent shows both that they will try and that minorities can rebuff it. (O)
The scrip dividend revival, read as competing hypotheses — cash preservation for renewal (most plausible), dividend optics, controller stake-creep, buy-back recycling. None is exclusive; the 28 September 2026 allotment result discriminates between them — watch whether the family elects scrip. (R/O)
11 · Defensiveness and growth attribution
Defensive against freight-rate cycles — revenue is contracted hire, which is why profit held stable through COVID and the 2022–23 rate shock, and US$41.0m of the next twelve months' income is already contracted. Exposed to counterparty loss, currency, and obsolescence — three legs, one factor: a vehicle-trade downturn would hit renewal appetite, residual values and the timing of replacement capex simultaneously. A mix-risk sharpens it: Chinese EV exports increasingly move on Chinese-controlled tonnage, while SSC's franchise is Japanese operators carrying Japanese brands — aggregate demand can grow while SSC's specific counterparties' cargo shrinks. (R/E/O)
Growth attribution: essentially none of the recent growth renews itself. The five-year revenue increase came from repricing one existing asset (Boheme), not from adding assets or winning share — and the same asset must be repriced again, or replaced, within years. The FY2026 headline should not be extrapolated. (D/O)
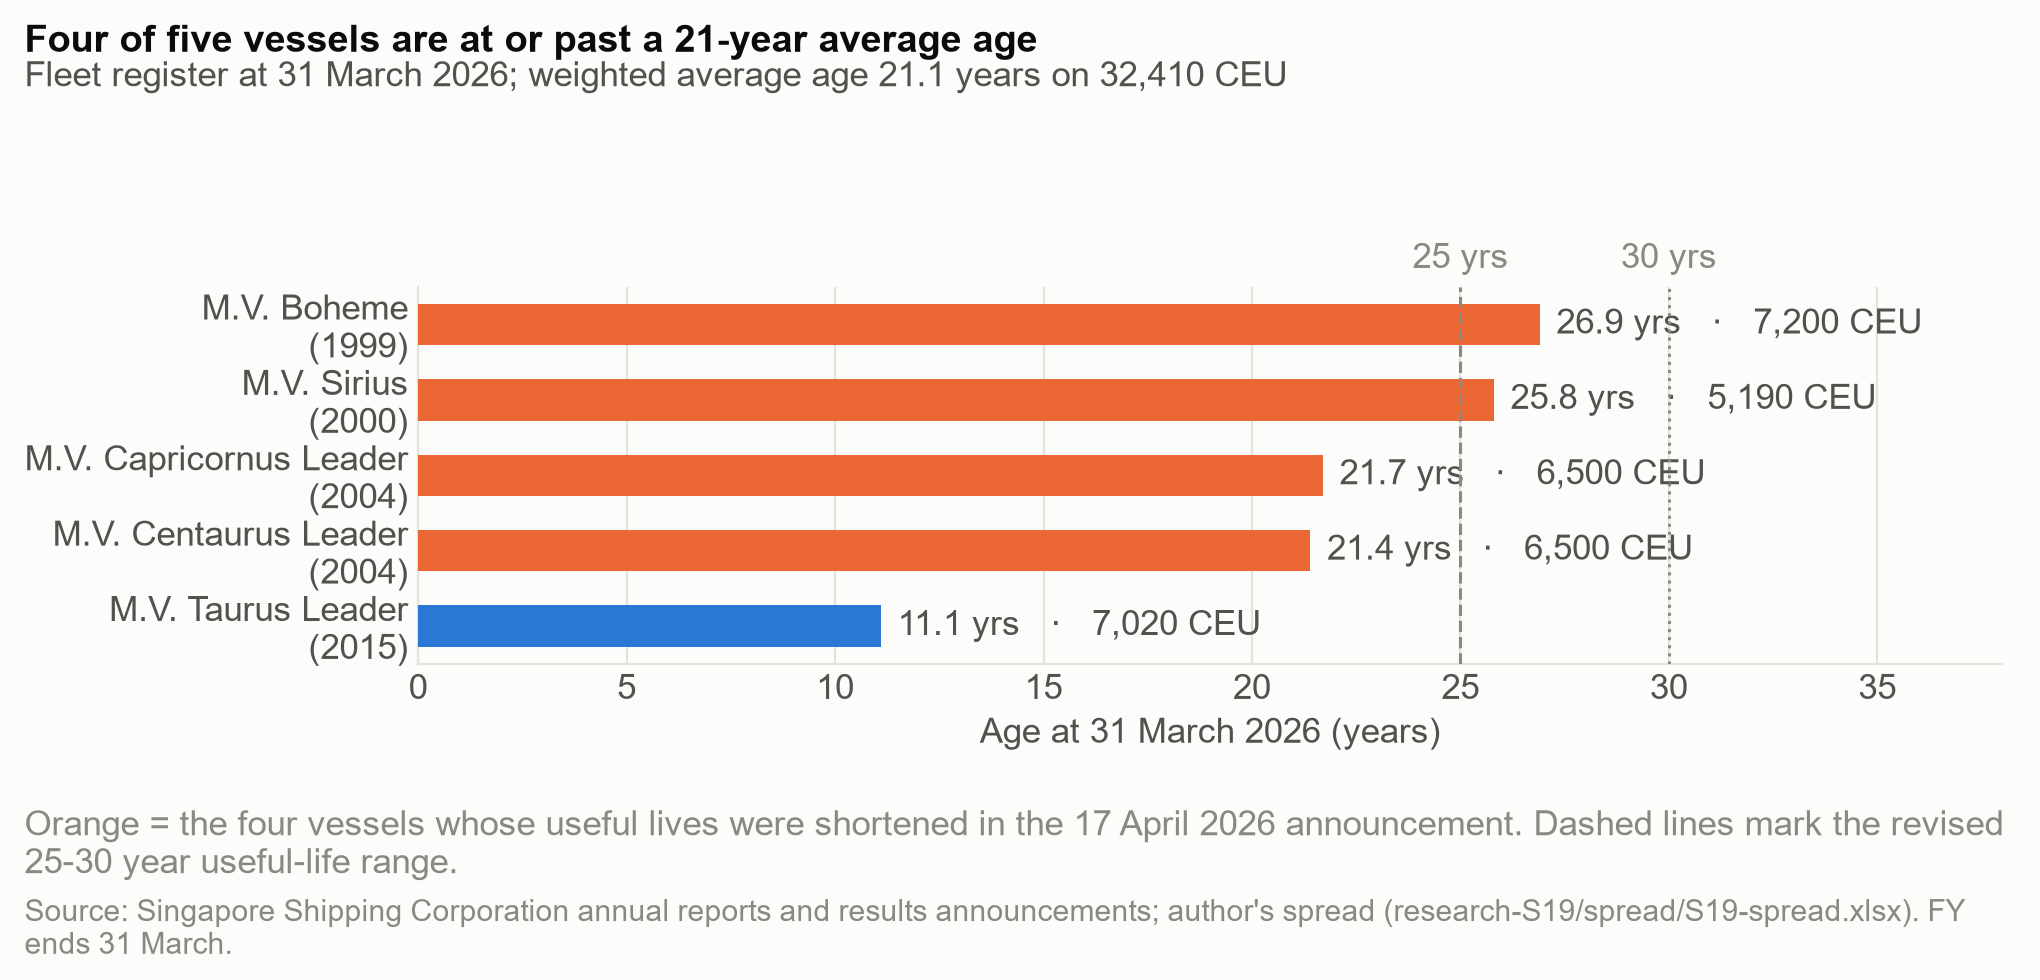
A decade of flat revenue and stable profit — the contract structure at work.Four of five vessels average 24 years; the fleet book is concentrated in one 2015 vessel.
12 · Red-flags scorecard
Item
Verdict
Evidence
Customer concentration
Flag
Top three 84% of revenue; largest 42%
Finance-function turnover
Flag
Four CFO departures since Jan 2023; currently no CFO
Fleet age vs replacement capacity
Flag
~80% of vessels near end of life; replacement US$120–150m each vs US$92m market cap
Inaccurate chairman's claim
Flag
"Never reported a loss" contradicted by the company's own FY2009 filings
Related-party / management take
Watch
~US$5.0m to management and director-related companies vs US$3.1m of dividends
Cash-rich yet borrowing
Watch
Legacy amortising vessel debt; no refinancing risk
Useful-life change
Watch
Shortened prospectively, clearly quantified (+US$2.5m depreciation from FY2027)
Counterparty credit history
Watch
Daiichi Chuo's 2015 civil rehabilitation — survived without loss, but precedented
Equity fundraising / dilution
Clear
No issuance; net buyer of its own stock; scrip is the one watch item
Auditor
Clear
EY; single KAM is vessel carrying value — pointing at exactly what a skeptic would stress
Interest income vs cash
Clear
~2.1% on average cash — consistent with SGD deposit rates; no phantom-cash signal
13 · The watch-list — dated and falsifiable
What charter backs the next vessel decision — counterparty, rate, duration, financing? An order carrying all three at sensible levels is a different company from an order missing them; the discriminating terms are known in advance. (Undated — the central question)
Does the May 2026 extended charter in fact offset the US$2.5m depreciation step-up, as guided? (1H FY2027 results, early–mid Nov 2026 — the key print)
Does the controlling family elect scrip? (Allotment 28 Sep 2026 — cash conservation, stake-creep and valuation signal in one number)
Does Sirius trade, sell, or scrap — and at what price vs carrying value? (Tests the asset-value question directly)
Does the beyond-five-years contracted bucket stop falling? (FY2027 AR, ~Jul 2027 — the cleanest single metric in this name)
Is a permanent CFO appointed before the largest capital decision in a decade? (Announcement tape)
Are treasury shares cancelled, or recycled into the scrip? (Capital-return durability signal)
13 · The share price and what came with its moves
Over the window Singapore Shipping returned +37.8% on a dividend-adjusted basis; the Straits Times Index returned +80.0% and the median of the 3 listed comparisons +71.5%.
Click a quarter — on the chart or in the return strip under it — to read its filings beside its large moves.
Key: Singapore Shipping (S19) as a solid line; Straits Times Index rebased, dashed; peer median rebased, dotted; the benchmark runs off scale from Jul 25 and is clipped there; the peer median runs off scale from Oct 23 and is clipped there; filing ticks above the axis; ex-dividend ticks on it; numbered pins are moves with a written note; plain dots are other detected moves.
Key moves
The five largest moves over a day or up to two weeks, with no day counted twice.
Each move is shown next to the market over the same days (and peers, where shown). News listed with a move was published within its dates; that does not mean the news caused the move. The quarter view has all the news.
Index: Straits Times Index. Peers: the median of three listed companies used as a sector check; the notes name them and their limits.
Q3 2023
22 Aug 2023 – 29 Sep 2023 (part quarter)
S19 +2.1%STI +1.8%Peer median +4.2%Range S$0.23–S$0.25Close S$0.24
Q4 2023
2 Oct 2023 – 29 Dec 2023
S19 −2.1%STI +0.7%Peer median −3.8%Range S$0.23–S$0.24Close S$0.23
Ship owning revenue fell 2.5% to US$15.9m and segment profit 3.3% to US$5.0m, which the company attributed to off-hire for drydocking. Agency and logistics revenue rose 1.2% to US$6.9m but segment profit fell 27.3% to US$0.7m in the absence of high-margin special projects. Finance and investment income rose to US$1.3m from US$0.3m on interest from time deposits; the exchange loss widened to US$1.1m from US$0.8m on US dollar appreciation. Earnings per share were 1.11 US cents against 1.06. Operating cash flow was US$9.1m; cash and bank balances were US$61.5m against bank borrowings of US$31.9m, and net asset value per share was 29.7 US cents.
Guidance: The company said it continues to record stable results in both segments, continues to cautiously evaluate investment opportunities and, net of cash, has no gearing.Next session (10 Nov): S19 +0.0% · STI −0.9% · peers −1.6%
Ms Ng, appointed on 28 February 2023, left on 1 January 2024 to pursue other interests; the company said there were no concerns over financial reporting and no disagreements with the board. Her successor, announced on 19 December 2023, came from Singtel, where she was Senior Finance Director.
Large price moves
113 Oct 2023 · −6% · index −1% · peers 0%
21 Nov 2023 · −8% · index 0% · peers 0%
3week to 3 Nov 2023 · −6% · index +3% · peers 0%
45 Dec 2023 · +4% · index 0% · peers 0%
Q1 2024
2 Jan 2024 – 28 Mar 2024
S19 +2.1%STI −0.5%Peer median +14.4%Range S$0.23–S$0.25Close S$0.24
The first purchase under the mandate renewed on 27 July 2023 was 10,000 shares at S$0.24 on 10 January 2024. There were 33 daily notices in all, the largest for 721,300 shares on 21 February 2024; total consideration across the run was S$504,035 (computed from the daily notices). Treasury shares rose from 7,940,300 to 10,050,600 and shares outstanding fell to 400,576,565. No further purchases were notified until July 2026.
Next session (11 Jan): S19 +2.1% · STI +0.7% · peers −1.1%
Mr Huong, a director since July 2018, cited family commitments and personal interests. Mr Hoon, chief operating officer of Intraco, takes the Audit and Risk Management Committee chair and a Remuneration Committee seat. The board stays at six with three independent directors.
Q2 2024
1 Apr 2024 – 28 Jun 2024
S19 +2.1%STI +3.4%Peer median +6.8%Range S$0.23–S$0.25Close S$0.24
Ship owning revenue fell 2.6% to US$31.6m and segment profit 13.6% to US$8.9m on drydocking off-hire; agency and logistics revenue fell 7.0% to US$13.9m and segment profit 47.5% to US$1.1m on lower volumes and no high-margin special projects. The second half was weaker: 2H revenue of US$22.6m was down 6.4% and 2H profit of US$4.7m down 36.6%. Finance and investment income rose 76.1% to US$2.8m on deposit interest, while exchange differences swung to a US$0.7m loss from a US$0.7m gain, attributed to forward contracts to sell US dollars entered in FY2023. Earnings per share were 2.3 US cents. Operating cash flow was US$17.3m; cash and bank balances rose to US$66.6m against bank borrowing of US$29.2m; net asset value per share was 30.8 US cents.
Guidance: Excluding planned drydocking off-hire, the company said the ship owning segment continues to record stable results; it continues to cautiously evaluate investment opportunities and, net of cash, has no gearing.Next session (24 May): S19 −2.0% · STI −0.2% · peers +0.6%
The notices run to 19 August 2026, mostly for 10,000-100,000 shares at a time. Over the run his direct interest rose from 161,181,953 shares (40.24%) to 167,574,853 (41.91%), while his deemed interest fell from 10,918,635 to 7,824,335 shares after disposals by a registered holder notified from September 2025; his total interest moved from 42.97% to 43.86% (figures as filed on the first and last notices).
Q3 2024
1 Jul 2024 – 30 Sep 2024
S19 +2.1%STI +7.6%Peer median −1.8%Range S$0.23–S$0.26Close S$0.24
The board falls to five: two executive directors (Ow Chio Kiat and CEO Ow Yew Heng) and three independent directors. Mr Ow Cheo Guan, 75, held a deemed interest in 13,200,000 shares.
The company said fuel choice is the charterer's prerogative, that it does not initiate newbuilds speculatively while LNG is a transitional fuel, and that any such project must be linked to a long-term charter with a blue-chip operator. On the 1999-built Boheme it said operators may restrict PCTCs beyond 30 years under energy-transition policies. It confirmed the internal audit function moved from CLA Global TS to Forvis Mazars and said it would explore partnerships or joint ventures with incoming Chinese operators.
Approved at the AGM of 30 July 2024; record date 12 August and paid on 23 August 2024. The chart's return series is adjusted for it, so the ex-date step is not counted as a move.
Large price moves
54 Sep 2024 · +6% · index −1% · peers −1%
65 Sep 2024 · −6% · index +1% · peers 0%
Q4 2024
1 Oct 2024 – 31 Dec 2024
S19 +14.6%STI +5.6%Peer median −1.8%Range S$0.23–S$0.28Close S$0.28
Ship owning revenue fell 2.9% to US$15.5m and segment profit 24.6% to US$3.8m, which the company attributed to vessel off-hire from an operational issue. Agency and logistics revenue rose 41.5% to US$9.8m and segment profit 126.8% to US$1.6m on higher-margin special projects. Finance and investment income rose 8.5% to US$1.5m, and exchange differences swung to a US$2.1m gain from a US$1.1m loss on Singapore-dollar deposits as the Singapore dollar appreciated. Earnings per share were 1.92 US cents. Operating cash flow was US$8.8m; cash and bank balances were US$74.5m against bank borrowing of US$26.6m; net asset value per share was 31.9 US cents. No interim dividend.
Guidance: The company said the ship owning segment continues to record stable results and that it is 'optimistic to enjoy higher charter rate in the near term'; agency and logistics volumes showed 'sporadic improvement'. Net of cash, no gearing.Next session (8 Nov): S19 +6.4% · STI +1.4% · peers +1.2%
The 1999-built vessel, held through SSC Boheme Pte. Ltd., is the fleet's oldest. The company said the charter is expected to have a favourable impact on revenue and to contribute positively to net profit for its duration, and flagged that green-recycling requirements may raise demolition costs and lower the vessel's eventual scrap value. No rate was disclosed.
Next session (3 Dec): S19 +0.0% · STI +0.9% · peers −1.3%
Large price moves
78 Nov 2024 · +6% · index +1% · peers +1%
8week to 6 Dec 2024 · +8% · index +2% · peers +3%
Q1 2025
2 Jan 2025 – 28 Mar 2025
S19 −1.8%STI +4.9%Peer median +5.3%Range S$0.27–S$0.28Close S$0.27
Q2 2025
1 Apr 2025 – 30 Jun 2025
S19 +3.7%STI −0.2%Peer median +2.9%Range S$0.24–S$0.28Close S$0.28
Ship owning revenue rose 2.3% to US$32.3m and segment profit 11.6% to US$9.9m on no drydocking off-hire and a US$0.6m waiver of an off-hire claim from the July 2024 operational issue. Agency and logistics revenue rose 16.7% to US$16.2m and segment profit 66.4% to US$1.8m on high-margin special projects, though both fell in the second half. 2H revenue of US$23.3m was up 2.9% but 2H profit of US$3.7m was down 20.7% on a US$2.4m exchange loss from forward contracts to sell US dollars. Finance and investment income eased 5.0% to US$2.7m. Earnings per share were 2.8 US cents. Operating cash flow was US$20.5m; cash and bank balances rose to US$80.0m against bank borrowing of US$23.9m; net asset value per share was 32.7 US cents.
Guidance: With global trade 'in flux amid rising tariffs and geopolitical shifts', the company said it continues to deliver stable results in ship owning on its long-term charter model, pointed to the Boheme renewal, and said it remains prudent on new investments with zero gearing net of cash.Next session (30 May): S19 +0.0% · STI −0.6% · peers +0.0%
The company cited personal reasons and said there were no financial-reporting concerns or disagreements with the board. Mr Tan has been with the company since 2014. This is the second CFO departure in the window.
Large price moves
97 Apr 2025 · −11% · index −8% · peers −12%
10week to 11 Apr 2025 · −7% · index −8% · peers −4%
Q3 2025
1 Jul 2025 – 30 Sep 2025
S19 +9.1%STI +8.5%Peer median +16.1%Range S$0.27–S$0.31Close S$0.29
The 9 July 2025 purchase was the largest single transaction in his two-year run of notices; direct holdings rose to 166,896,053 shares. The same evening the company issued the AGM notice, the dividend record-date notice and the proposed renewal of the share buy-back mandate.
Mr Hoon left on 29 July 2025 after 18 months in the role. Mr Chow, a director of Equifis Associates, chairs the Audit and Risk Management Committee and sits on the Remuneration Committee; the board remains five strong with three independent directors.
Ship owning revenue rose 16.3% to US$18.0m and segment profit to US$6.9m from US$3.8m, which the company attributed to the five-year Boheme charter renewal. Agency and logistics revenue fell 24.6% to US$7.4m and segment profit 73.8% to US$0.4m on fewer high-margin special projects. Finance and investment income fell 26.4% to US$1.1m on lower deposit rates; the exchange gain rose 18.6% to US$2.5m. Earnings per share were 2.39 US cents. Operating cash flow was US$10.4m; cash and bank balances rose US$9.1m to US$89.1m against bank borrowing of US$21.2m; net asset value per share was 34.3 US cents. No interim dividend. The company said the current charter is Boheme's final period before she is retired for demolition.
Guidance: Stable results in ship owning on the long-term charter model amid tariffs and geopolitical shifts; prudent on new investments with zero gearing net of cash.Next session (14 Nov): S19 −3.3% · STI −0.7% · peers −0.6%
Q1 2026
2 Jan 2026 – 31 Mar 2026
S19 −3.3%STI +5.1%Peer median −15.0%Range S$0.29–S$0.32Close S$0.29
Mr Tan, acting CFO since June 2025, cited personal reasons; the company said there were no financial-reporting concerns. Ms Xiong, finance manager since November 2023, takes responsibility for financial reporting, treasury and controls. The company secretary role also passed on the same day.
Large price moves
165 Mar 2026 · +5% · index +1% · peers −4%
Q2 2026
1 Apr 2026 – 30 Jun 2026
S19 +6.9%STI +5.8%Peer median −0.7%Range S$0.29–S$0.32Close S$0.31
The revision is a change in accounting estimate applied prospectively; one vessel keeps a 30-year life on a fixed long-term charter. The company said the higher FY2027 depreciation is expected to be offset by a new extended time charter at increased rates commencing in May 2026. Neither the new lives nor the depreciation amount was quantified, and the re-fixed vessel was not named.
Guidance: Barring unforeseen circumstances, no material impact on consolidated net profit for FY2027.Next session (20 Apr): S19 +0.0% · STI +0.1% · peers −1.7%
Ship owning revenue rose 12.0% to US$36.2m and segment profit 46.0% to US$14.4m on the Boheme renewal; agency and logistics revenue fell 11.3% to US$14.4m and segment profit 70.4% to US$0.5m without high-margin special projects. Exchange differences swung to a US$2.5m gain from a US$0.2m loss; finance and investment income fell 29.1% to US$1.9m. Earnings per share were 4.1 US cents. Operating cash flow was US$23.2m; cash and bank balances rose to US$97.6m against bank borrowing of US$18.6m; net asset value per share was 36.0 US cents. The commentary dropped the 'zero gearing' line of earlier releases and instead flagged an ageing fleet with about 80% of vessels nearing the end of their useful lives, rising replacement costs, lubricant shortages from the Iran crisis, and long-term charters becoming harder to secure.
Guidance: Higher operating costs expected from lubricant prices, spare parts and insurance; the board 'may need to adopt a less risk-averse approach for continuity of business'.Next session (26 May): S19 −1.6% · STI −0.8% · peers −0.6%
Shareholders may take new shares in lieu of cash, with the issue price set from the volume-weighted average between the ex-date and the record date; the shares are to be issued under the general mandate. The scheme was last used for the FY2022 dividend, when 10,637,000 new shares were issued. A replacement on 1 July 2026 corrected a reference to the AGM date.
Large price moves
171 Apr 2026 · +5% · index +2% · peers +2%
1828 Apr 2026 · +5% · index 0% · peers −1%
Q3 2026
1 Jul 2026 – 21 Aug 2026 (part quarter)
S19 −3.3%STI +10.0%Peer median −1.8%Range S$0.28–S$0.31Close S$0.29
Ten daily notices under the 2025 mandate took cumulative purchases to 551,100 shares by 28 July, and two more under the mandate renewed at the 30 July AGM added 150,400 (total computed). Consideration was S$210,161 across the run (computed from the daily notices). Treasury shares rose to 10,752,100 and shares outstanding fell to 399,875,065. The purchases ran alongside the chairman's own buying.
Next session (9 Jul): S19 +0.0% · STI +1.2% · peers +0.0%
Ms Sia, a director since July 2017 and lead independent director, left at the 30 July 2026 AGM. Mr Tan, co-managing partner of Audent Chambers, chairs the Nominating Committee and sits on the audit and remuneration committees. The board remains five strong with three independent directors.
Approved at the AGM of 30 July 2026; record date 11 August, payment and crediting of new shares on 28 September 2026. On 12 August the company set the scrip issue price at S$0.266, a 9.83% discount to the average volume-weighted price over the two-day determination period.
Notes and sources
Share price record
How this section was built
The detector flagged 18 large moves in the window — 12 single sessions and 6 weekly windows — before any news was read. 3 market moves, 3 sector moves; 12 are left over after both controls, unexplained by them. Of those, 2 followed a filing by timestamp, 1 coincided with one in the same session or week and 9 have nothing filed against them beyond routine notices and are recorded as unexplained rather than explained away.
This section records the 36-month price history and puts every large move through two subtractions and reports what is left over, not what caused it: first the Straits Times Index, then the median of the 3 listed comparisons — Uni-Asia, Samudera Shipping and Marco Polo Marine — which trade the same session. “Left over” is what survives both controls.
Each quarter panel pairs two records. Key developments are the filings that carry information — results, the charter book, buy-backs and the scrip scheme, finance-head changes, dividend events — with the figures as filed, the guidance given, the close on the day and how the reacting session traded against the controls; a filing after the 09:00 open is read against the next session. Large price moves are the threshold-detected sessions, detected before any news was read and dispositioned from the controls and the enumerated tape; rows with a written note carry a numbered pin, the rest are dots on the line.
How to read the tags.Market-wide and Sector-wide mean the index or the peer median moved with the share over the same session or week; Residual means the move is still large after both are subtracted. A residual is what is left over, not a cause: it does not establish that the company’s own news moved the price, and an unchanged or thinly traded price is not proof that no information arrived. Returns use the dividend-adjusted close; a filing released after the open is read against the next session.
Prices are Yahoo Finance daily closes for S19.SI in Singapore dollars, adjusted for the three 1.0-cent ex-dividend dates (8 Aug 2024, 8 Aug 2025, 7 Aug 2026); the filings are every SGXNet announcement the issuer broadcast between 22 Aug 2023 and 21 Aug 2026, enumerated from the SGX announcements API on 23 Aug 2026 with SGX broadcast times. A filing after the open is read against the next session.
Limitations bound every row above. The tape is every SGXNet broadcast by Singapore Shipping Corporation between 22 August 2023 and 21 August 2026, with SGX broadcast times; 163 items, of which 61 are the chairman's Form 1 notices, 45 are daily share buy-back notices and 28 are AGM, annual-report, mandate, secretary and registrar paper; the register's 25 entries are drawn from the remaining 29 plus the first and last notice of each buy-back run and of the chairman's buying. Broker notes, block trades and substantial-shareholder timing beyond the chairman's own notices, trade press (including charter-market reporting on PCTC rates) and index reviews were not examined. The issuer's subsidiaries (SSC Boheme Pte. Ltd., Island Line Pte. Ltd. and the other vessel-owning companies) are unlisted and broadcast nothing of their own; the pack has no `research/entity-tape-register.json`, so no separate entity stream was enumerated. The peer set is three Singapore-listed shipping names (Uni-Asia, Samudera Shipping, Marco Polo Marine) whose businesses differ from a PCTC lessor's, and their session moves disperse widely — on 7 April 2025 the peer range was -5.0% to -20.0% — so the "sector" reading on any one day is a loose control. The company gives no numerical guidance; the `guidance` field carries its qualitative commentary as written.
A quarter shows only the columns it has. An empty developments column means: No filings beyond routine disclosures this quarter. An empty moves column means: No session cleared the large-move threshold this quarter.
The full move register — every large move and its market and sector controls
Every threshold-detected move in the window with its controls, dispositioned in the price-driver register; rows with a written note carry a numbered pin on the chart.
#
Session
S19
STI
Peers
Left over
Control result
What the evidence supports
1
13 Oct 2023
−6.1%
−1.0%
+0.0%
−6.1%
Residual
Fell from S$0.245 to S$0.23 on 100,000 shares (2.5× median), reversing the two prior sessions' rise from S$0.23 (+4.3% on 11 October, +2.1% on 12 October). The index fell 1.0% and the peer median was flat (Samudera −0.7%, Uni-Asia and Marco Polo unchanged), leaving about six points. Nothing was filed between the AGM minutes of 24 August and the 1H FY2024 results of 9 November. The close was S$0.235 two sessions later. No filing explains it. UniAsia +0.0 · Samudera −0.7 · MarcoPolo +0.0
2
1 Nov 2023
−8.2%
+0.3%
+0.0%
−8.2%
Residual
A 2.0-cent fall from S$0.245 to S$0.225, the low of the window, on 31,300 shares (0.8× median). The three prior sessions had no trades, so the S$0.245 reference is the 26 October close. The index rose 0.3% and the peer median was flat (Samudera −2.4%, Uni-Asia and Marco Polo unchanged), so the whole move is left over. Nothing was filed between the AGM minutes of 24 August and the 1H FY2024 results of 9 November, six sessions later, on which the shares did not move. The close recovered to S$0.23 on 3 November and S$0.235 by 15 November. No filing explains it. UniAsia +0.0 · Samudera −2.4 · MarcoPolo +0.0
3
week to 3 Nov 2023
−6.1%
+2.7%
+0.0%
−6.1%
Residual
Weekly window, 2023-10-27 to 2023-11-03: against an index move of +2.7% and a peer median of +0.0%, about 6 points are left over. No filing beyond routine notices inside the window. UniAsia +1.7 · Samudera −6.7 · MarcoPolo +0.0
4
5 Dec 2023
+4.4%
−0.2%
+0.0%
+4.4%
Residual
Against an index move of −0.2% and a peer median of +0.0%, about 4 points are left over; 0.1× median volume. No filing beyond routine notices in the prior three sessions. UniAsia −0.6 · Samudera +0.0 · MarcoPolo +2.0
5
4 Sep 2024
+6.1%
−1.1%
−0.6%
+6.8%
Residual
Rose from S$0.245 to S$0.26 on 246,100 shares (6.2× median), after a 2.1% rise on 153,100 shares the session before. The index fell 1.1% and the peer median 0.6% (Samudera −1.8%, Uni-Asia −0.6%, Marco Polo flat), leaving about seven points. The only filing within three sessions is the chairman's Form 1 of 30 August, broadcast at 18:26, recording 114,600 shares bought at S$0.235 on 28–29 August; the next filing of any kind is the 1H FY2025 results on 7 November. The rise reversed in full the next session. No filing explains it. UniAsia −0.6 · Samudera −1.8 · MarcoPolo +0.0
6
5 Sep 2024
−5.8%
+0.5%
+0.0%
−5.8%
Residual
The next session gave back the whole of 4 September's gain, S$0.26 to S$0.245, on 64,800 shares (1.6× median), with the index up 0.5% and the peer median flat (Samudera +1.2%, Marco Polo −1.9%, Uni-Asia unchanged). Nothing was filed between the chairman's Form 1 of 30 August and the 1H FY2025 results of 7 November. The two sessions together are a round trip on elevated volume with nothing on the tape against either; the close then stayed between S$0.235 and S$0.245 until the results. UniAsia +0.0 · Samudera +1.2 · MarcoPolo −1.9
7
8 Nov 2024
+6.4%
+1.4%
+1.2%
+5.2%
Residual
Followed the 1H FY2025 results, filed at 17:38 on 7 November after the close: revenue up 10.6% to US$25.3m and profit for the period up 71.9% to US$7.7m, with a US$2.1m exchange gain and higher-margin logistics projects accounting for the increase while ship-owning segment profit fell 24.6%, which the company attributed to off-hire; the company said it was 'optimistic to enjoy higher charter rate in the near term'. The shares rose from S$0.235 to S$0.25 on 194,900 shares (4.9× median); the index rose 1.4% and the peer median 1.2% (Uni-Asia +2.0%, Samudera +1.2%, Marco Polo flat), leaving about five points to the results. The close held at S$0.25 for the following six sessions on four to six times median volume, so there was no reversal. UniAsia +2.0 · Samudera +1.2 · MarcoPolo +0.0
8
week to 6 Dec 2024
+8.0%
+1.5%
+3.1%
+4.9%
Residual
The week included the Boheme announcement, filed at 17:49 on 2 December: a five-year time charter from 23 April 2025 for the fleet's oldest vessel, which the company expects to contribute positively to net profit for its duration; no rate was disclosed. Over the week the shares rose from S$0.25 to S$0.27 against an index move of +1.5% and a peer median of +3.1% (Marco Polo +5.8%, Samudera +3.1%, Uni-Asia flat), leaving about five points. The part after the filing was S$0.255 to S$0.27 over four sessions, the first of them on 511,300 shares, the heaviest session since February; the chairman's Form 1 notices of 5 and 9 December record 275,400 shares bought across 3–6 December at S$0.26–0.27. The close held at S$0.27 through the following week. UniAsia +0.0 · Samudera +3.1 · MarcoPolo +5.8
9
7 Apr 2025
−11.1%
−7.5%
−12.2%
+1.1%
Sector-wide
Tracked the sector: against an index move of −7.5% and a peer median of −12.2%, about 1 points are left over. UniAsia −5.0 · Samudera −12.2 · MarcoPolo −20.0
10
week to 11 Apr 2025
−7.4%
−8.2%
−4.3%
−3.1%
Market-wide
In line with the market: against an index move of −8.2% and a peer median of −4.3%, about 3 points are left over. UniAsia −3.7 · Samudera −4.3 · MarcoPolo −15.6
11
1 Jul 2025
−5.4%
+0.6%
+0.0%
−5.4%
Residual
Fell from S$0.28 to S$0.265 on 190,200 shares (4.8× median), with the index up 0.6% and the peer median flat (Uni-Asia −2.4%, Samudera +0.6%, Marco Polo unchanged), leaving about five points. The filings within three sessions are all the chairman's Form 1 notices: those of 25 and 27 June, before the session, record daily purchases of 30,100–40,400 shares at S$0.275–0.28; the notice broadcast at 18:10 on 1 July, after the close, covers 27 and 30 June; and the notice of 3 July records that he bought 60,000 shares at S$0.275 during the session itself. The CFO change filed on 19 June was eight sessions earlier, and the close had risen from S$0.27 to S$0.28 since. The close recovered to S$0.27 the next day and S$0.28 by 9 July. No filing explains it. UniAsia −2.4 · Samudera +0.6 · MarcoPolo +0.0
12
week to 11 Jul 2025
+5.6%
+1.9%
−0.6%
+6.2%
Market-wide
In line with the market: against an index move of +1.9% and a peer median of −0.6%, about 6 points are left over. UniAsia −0.6 · Samudera +3.5 · MarcoPolo −4.3
13
14 Jul 2025
+5.3%
+0.5%
+0.0%
+5.3%
Residual
Followed six filings broadcast between 17:35 and 17:38 on Friday 11 July. Five are annual paper — the AGM notice, the annual report, the record date for the 1.0-cent final dividend declared on 29 May, the proposed renewal of the share buy-back mandate and a director's retirement — and the sixth is the chairman's Form 1 for a 2,500,000-share block bought at S$0.275 on 9 July, the session on which 2,729,900 shares printed, taking his total interest to 44.39%. The shares rose from S$0.285 to S$0.30 on 167,000 shares (4.2× median), with the index up 0.5% and the peer median flat (Samudera +2.2%, Uni-Asia and Marco Polo unchanged), leaving about five points; the rise continued to S$0.31 on 17 July and was back at S$0.295 by 21 July. None of the six filings carries a new figure for the business. UniAsia +0.0 · Samudera +2.2 · MarcoPolo +0.0
14
week to 1 Aug 2025
−6.6%
−2.5%
−3.0%
−3.5%
Sector-wide
Tracked the sector: against an index move of −2.5% and a peer median of −3.0%, about 4 points are left over. UniAsia −3.0 · Samudera +0.0 · MarcoPolo −6.7
15
week to 8 Aug 2025
+5.4%
+2.1%
+2.0%
+3.4%
Market-wide
In line with the market: against an index move of +2.1% and a peer median of +2.0%, about 3 points are left over. UniAsia −1.2 · Samudera +2.0 · MarcoPolo +7.1
16
5 Mar 2026
+5.0%
+0.7%
−3.6%
+8.6%
Residual
The largest residual in the register: Singapore Shipping rose 5.0% from S$0.30 to S$0.315, matching the 26 February window high, on 528,500 shares (13.2× median), while the index rose 0.7% and the peer median fell 3.6% — Marco Polo −6.0%, Samudera −3.6%, Uni-Asia +0.6% — leaving about nine points. The session regained the prior day's 3.2% fall and a further half-cent. The only filing within three sessions is the chairman's Form 1 broadcast at 18:22 that evening, after the close, and it records a 200,000-share reduction in his deemed interest from a disposal by a registered holder on 3 March, not a purchase; nothing else was filed between 5 February and the finance-head change of 20 March. The gain was given back in full over the next three sessions, to S$0.30 on 10 March. No filing explains it. UniAsia +0.6 · Samudera −3.6 · MarcoPolo −6.0
17
1 Apr 2026
+5.2%
+1.9%
+2.0%
+3.2%
Sector-wide
Tracked the sector: against an index move of +1.9% and a peer median of +2.0%, about 3 points are left over. UniAsia +0.0 · Samudera +2.0 · MarcoPolo +3.7
18
28 Apr 2026
+5.0%
−0.1%
−0.6%
+5.6%
Residual
Rose from S$0.30 to S$0.315 on 833,000 shares, 20.8× median and the fourth-largest session volume in the window, with the index flat (−0.1%) and all three peers within a point (Uni-Asia −0.5%, Samudera −0.9%, Marco Polo −0.6%), leaving about six points. Nothing was filed within three sessions either side. The nearest filings are the revision of vessel useful lives broadcast at 17:38 on 17 April, seven sessions earlier, after which 653,200 shares changed hands on 20 April without moving the price, and the chairman's Form 1 notices of 7 April and 7 May, both of which record reductions in his deemed interest rather than purchases. The gain was given back over the next two sessions, to S$0.305 on 30 April, with a further 617,200 shares traded on 29 April. No filing explains it. UniAsia −0.5 · Samudera −0.9 · MarcoPolo −0.6
Key developments: sources, timing and notes
9 Nov 2023 · 1H FY2024 results: revenue down 1.4% to US$22.9m, profit for the period up 7.7% to US$4.5m; no interim dividend.ResultsReaction (next session, 10 Nov): S19 +0.0% · STI −0.9% · peers −1.6% · 1.7× median volumeSource: SGX announcement, 9 Nov 2023 (released 17:22, after the close)
10 Jan 2024 · Share buy-back begins: 2,110,300 shares (0.52% of issued shares) bought between 10 January and 28 March 2024 at S$0.23-0.245.Corporate actionReaction (next session, 11 Jan): S19 +2.1% · STI +0.7% · peers −1.1% · 1.6× median volumeSource: Daily share buy-back notice, 10 Jan 2024 · Daily share buy-back notice, 28 Mar 2024
31 Jan 2024 · Board change: Huong Wei Beng resigns as independent director and audit committee chair; Hoon Chee Wai appointed to both roles from 1 February 2024.BoardSource: SGX announcement, 31 Jan 2024
23 May 2024 · FY2024 results: revenue down 4.0% to US$45.5m and profit down 20.7% to US$9.1m; final dividend held at 1.0 Singapore cent.ResultsReaction (next session, 24 May): S19 −2.0% · STI −0.2% · peers +0.6% · 1.9× median volumeSource: SGX announcement, 23 May 2024 (released 17:23, after the close)
31 May 2024 · Executive chairman Ow Chio Kiat begins a run of open-market purchases: 20,000 shares at S$0.24 on 28 May 2024, the first of 61 notices in the window.AnnouncementSource: Form 1 notice, 31 May 2024 · Form 1 notice, 20 Aug 2026
12 Jul 2024 · Board change: Ow Cheo Guan, deputy executive chairman since 1994 and brother of the chairman, retires at the 30 July 2024 AGM.BoardSource: SGX announcement, 12 Jul 2024
30 Jul 2024 · Responses to SIAS questions ahead of the AGM: no speculative newbuilds, a PCTC useful life of about 30 years, and Chinese operators named as possible partners.Business updateSource: SGX announcement, 30 Jul 2024
7 Nov 2024 · 1H FY2025 results: revenue up 10.6% to US$25.3m and profit up 71.9% to US$7.7m, lifted by a US$2.1m exchange gain and special logistics projects.ResultsReaction (next session, 8 Nov): S19 +6.4% · STI +1.4% · peers +1.2% · 4.9× median volumeSource: SGX announcement, 7 Nov 2024 (released 17:38, after the close)
2 Dec 2024 · Boheme fixed on a new five-year time charter from 23 April 2025 with a charterer the company describes as reputable.AnnouncementReaction (next session, 3 Dec): S19 +0.0% · STI +0.9% · peers −1.3% · 12.8× median volumeSource: SGX announcement, 2 Dec 2024
29 May 2025 · FY2025 results: revenue up 6.7% to US$48.6m and profit up 24.6% to US$11.4m; final dividend held at 1.0 Singapore cent.ResultsReaction (next session, 30 May): S19 +0.0% · STI −0.6% · peers +0.0% · 7.0× median volumeSource: SGX announcement, 29 May 2025 (released 17:33, after the close)
11 Jul 2025 · Chairman buys a 2,500,000-share block at S$0.275, taking his direct interest to 41.66% and total interest to 44.39%.AnnouncementSource: Form 1 notice, 11 Jul 2025
13 Nov 2025 · 1H FY2026 results: revenue up 0.4% to US$25.4m and profit up 24.8% to US$9.6m as the Boheme renewal lifted ship owning profit 84.3%.ResultsReaction (next session, 14 Nov): S19 −3.3% · STI −0.7% · peers −0.6% · 3.5× median volumeSource: SGX announcement, 13 Nov 2025 (released 17:52, after the close)
17 Apr 2026 · Useful lives of four of the five vessels to be shortened from 1 April 2026; the company expects no material impact on FY2027 net profit because a vessel was re-fixed at higher rates from May 2026.Business updateReaction (next session, 20 Apr): S19 +0.0% · STI +0.1% · peers −1.7% · 10.5× median volumeSource: SGX announcement, 17 Apr 2026
25 May 2026 · FY2026 results: revenue up 4.2% to US$50.6m and profit up 44.2% to US$16.4m; dividend held at 1.0 Singapore cent; the board says it 'may need to adopt a less risk-averse approach'.ResultsReaction (next session, 26 May): S19 −1.6% · STI −0.8% · peers −0.6% · 2.2× median volumeSource: SGX announcement, 25 May 2026 (released 19:06, after the close)
29 Jun 2026 · Scrip dividend scheme applied to the FY2026 final dividend of 1.0 Singapore cent: record date 11 August, issue price at up to a 10% discount, payment 28 September 2026.DividendSource: SGX announcement, 29 Jun 2026 · Replacement announcement, 1 Jul 2026
8 Jul 2026 · Share buy-back resumes after 27 months: 701,500 shares bought between 8 July and 7 August 2026 at S$0.295-0.305.Corporate actionReaction (next session, 9 Jul): S19 +0.0% · STI +1.2% · peers +0.0% · 4.1× median volumeSource: Daily share buy-back notice, 8 Jul 2026 · Daily share buy-back notice, 7 Aug 2026
13 Jul 2026 · Management change: Lim Bee Lan, chief operating officer of the agency subsidiary Island Line since 2014, to leave on 14 August 2026.BoardSource: SGX announcement, 13 Jul 2026
Every other test on this page waits for the company to file. These do not. Each row is a series you can look up yourself, free, today — with the level this reading was built against, the levels that would put it in question, and what the series cannot tell you.
agency, terminal and logistics services — nothing public to watch
Searched the maritime authority's port statistics and vessel-call series for a proxy. Port calls are published, but this segment earns fees from a specific customer list at one terminal rather than from national throughput, and the company's own page records that the smaller segment earns the higher return on capital — a mix effect no throughput series can see.
vessel ownership and chartering — nothing public to watch
Searched the Baltic Exchange's free daily assessments, the car-carrier rate commentary and global light-vehicle production statistics. The finding is that none of them should be watched here, and that is the point: the fleet is on long-dated fixed charters to a small number of shipping lines, so the spot market does not reach revenue until a charter expires. A reader watching freight indices for this company would be reading a market it is deliberately insulated from. The contract book's run-off schedule — disclosed at results — is the real clock, and it is the company's own disclosure.
Watchlist reviewed on 2026-08-27; each observation has its own date above. This watchlist date does not change the company research cutoff. A series moving past a level is a reason to re-read the case, not a recommendation. The same series across every company covered: what you can watch.
Download
A print-ready PDF of this page, for reading away from the screen: Singapore Shipping Corporation evidence library (PDF). It carries the same content as this page — the contract book, the language delta, segment economics, the track record, cash quality, six years of capital allocation, the balance sheet, the credit view, governance, defensiveness and growth, the red-flags scorecard, the watch-list and the share price — and the same omissions: no rating, no fair value, no forecast.
Annual reports FY2016–FY2026 and full-year results announcements (the FY2022 and FY2024 reports supply the credit comparatives, and the FY2026 notes 19, 22, 23, 24 and 30 the debt, security, maturity and liquidity detail); AGM minutes 2023–2025; the 17 Apr 2026 useful-lives announcement; Boheme recharter announcement (Dec 2024); scrip and buy-back announcement tape (351 notices, 12 months); director interest notices (95, 12 months); segment and lessor notes re-keyed throughout. Market/cycle figures are third-party (E) and labelled. Named gaps: the listing-by-introduction document and the Hai Sun Hup EGM circular do not survive on any archive — the "promised at listing vs delivered" test cannot be run; the deposit-book currency split is undisclosed (FX sensitivity is an upper bound); fleet market-value indications are press-sourced and unverified. Research process is AI-assisted with human verification; load-bearing figures re-verified against primary filings.
No rating, fair value, price target, expected return, forecast or recommendation is published here; the equity and credit ratings held for this company are private and not distributed. Information cut-off 26 August 2026; announcement tape monitored through 28 August; equity library 16 August 2026; credit view 20 August 2026 · Next scheduled update after 1H FY2027 results (~November 2026) or on material announcement.
Corrections log
27 August 2026 — projected financials withdrawn from this page. Section 9.2 published the author’s own five-year forecast of the credit measures as a table — forecast EBITDA, closing bank borrowing, closing cash, total debt to EBITDA and debt-service cover for FY2027E through FY2031E, together with the statement that on the model’s base case the issuer never meets a refinancing event. Those are projected financials, and this page should never have carried them: the publication boundary keeps the forward view, like the rating and the fair value, behind the rated view 🔒. The table and its two framing paragraphs have been removed and the section now records the boundary instead. The material itself is preserved unaltered in the private working files, and the closing note to §9.7 no longer claims the forecast among what is published. Nothing built on reported figures was touched: the six-year credit-ratio history (§9.1), the FY2026 cash waterfall (§9.3), the liquidity test (§9.4) and the replacement-decision stress (§9.5) are unchanged, as is the owner-earnings reserve arithmetic in §6, which charges management’s own stated replacement cost against a reported year rather than projecting one.
Reader questions & corrections
Ask about this company, challenge a source or suggest a factual correction. Only selected questions that SMID Research has reviewed and answered are published.
Submissions are private by default. Your email is encrypted and never published. Please do not send confidential or inside information, allegations about individuals, promotions, or requests for personalised investment advice.
Behind the lock
A complete private working view of this company exists beyond this page: the full initiation note as a PDF, a separate credit initiation with its indicative ratings, scorecard and review record, the financial model workbook with live formulas, the presentation deck, scenario and valuation work, and the independent-review artifacts. It is maintained in the author's vault for the author's own records — not published, and not available for sharing. This page carries everything that is public.
These bounded retrospective corrections clarify specific published facts or calculations. They retain each report's existing research cutoff and do not represent a full refresh or a finding that all possible issues are resolved.
Singapore Shipping Corporation
Internal Inconsistency. The charter-book bridge is closing total minus opening total plus the opening within-one-year bucket, adding back expected runoff. The negative US$21.9m FY2026 residual is not proof of lost contracted revenue. Source basis: published annual-report lessor-note inputs. Limitation: Foreign exchange, timing and contract changes can affect the residual; a dated reconciliation is required.
Transcripts
Find available event transcripts in the transcript library.
· Scrip Dividend Scheme – Allotment and Issue of New Shares · SGX
Titles are from the linked SGX filing, with common words abbreviated. Summaries are written by AI and may contain inaccuracies; refer to the original announcement. Items after 26 August 2026 are not reflected in this page's analysis; earlier items are listed for reference, may not be discussed in it, and may have been updated by later announcements.