Tiong Woon Corporation
SGX: BQM · Information cut-off 31 August 2026
Investor snapshot
Business model
Tiong Woon owns cranes and transport equipment and provides engineered lifting, haulage and installation services.
Latest figures
FY2026 revenue rose 14.8% to S$187.676m, PATMI rose 24.4% to S$23.901m and operating cash flow reached S$67.485m; cash PPE purchases were S$23.795m while accounting additions were S$53.550m.
Main risk
The central risk is that fleet renewal, receivables and project funding absorb more cash than reported utilisation, rates and margins can support, while legal-obligor liquidity and covenant headroom remain undisclosed.
Next proof
The next test is the audited FY2026 capex and funding bridge, followed by FY2027 interim utilisation, realised-rate and collection evidence.
No public letter rating, no valuation.
Information cut-off: 31 August 2026. The latest financial statement in scope is the FY2026 full-year results announced on 28 August 2026; those figures are preliminary, unaudited and unreviewed.
Evidence balance
The live questionDoes the cash from stronger lifting activity cover fleet replacement, receivables and debt service once financed equipment additions are counted?The FY2026 full-year results announced on 28 August 2026 are preliminary, unaudited and unreviewed, so the notes that would separate cash equipment purchases from financed additions are not yet filed.
What improved
FY2026 revenue rose 14.8% to S$187.676m, gross margin recovered to 40.7% from 37.6%, profit attributable to owners rose 24.4% to S$23.901m, and operating cash flow reached S$67.485m against cash PPE purchases of S$23.795m.
What became more demanding
Accounting PPE additions were S$53.550m against those S$23.795m of cash purchases; cash debt flows repaid a net S$19.531m while gross borrowings rose S$7.148m, a S$26.679m derived balancing item the preliminary filing does not reconcile. The listed holding company itself had S$0.079m of cash at 30 June 2026.
Strongest alternative explanation
Higher accounting additions could reflect hire-purchase or bank-financed equipment and unpaid balances rather than unfunded outflow, and payables increased partly because of equipment purchases and customer deposits, which would be consistent with timing rather than strain; it does not by itself establish maintenance capex.
The decisive missing fact
The audited FY2026 equipment note that splits cash purchases, financed additions, unpaid balances, maintenance, replacement and growth capex, together with legal obligors, accessible cash, facility limits, maturities and covenant headroom.
Drawn from the evidence on this page: the improvement, the constraint, the benign reading and the fact that would settle it. It states no view on the shares.
About the private research record
A separate private working record contains analyst judgments, scenario work and model files. It remains private, access-controlled and outside this public evidence library.
On this page
Business anatomy · from inputs to customer value
Heavy-lift jobs turn cranes and crews into certified cash
Project owners and EPC contractors buy an engineered move, not just a crane; utilisation, job economics and collection decide the cash outcome.
Follow the operating chain from demand or inputs to customer outcome and cash.
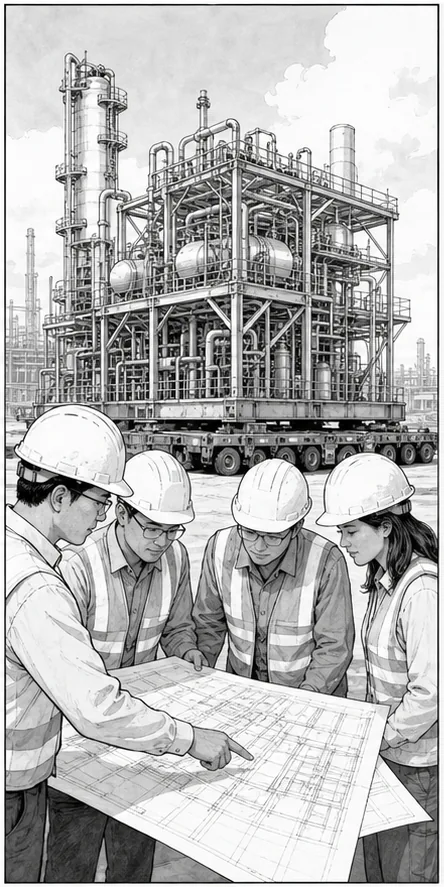
Customer needProject brief
Scope the heavy move
What happensA project owner or EPC contractor specifies a heavy lift, haulage or installation job.
Commercial triggerThe contract sets scope, milestones, price and delivery risk.
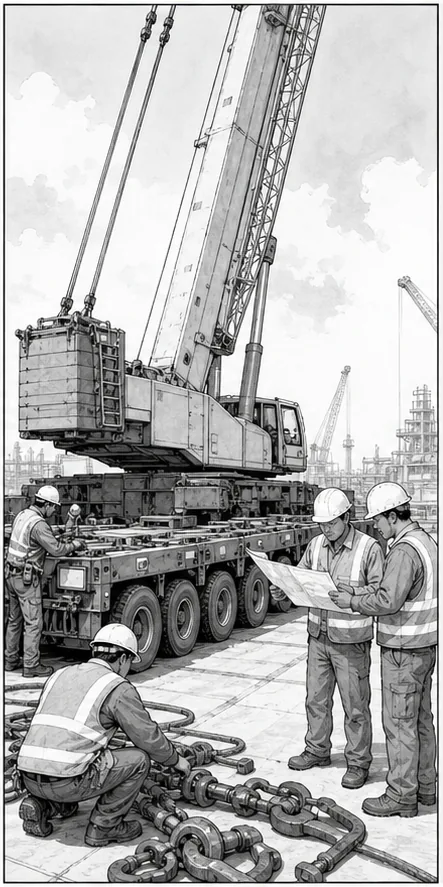
Company actionLift engineering
Plan and mobilise
What happensTiong Woon engineers the lift, selects cranes and transport, then mobilises crews and equipment.
Value createdPlanning and mobilisation turn fleet capacity into a deliverable service.
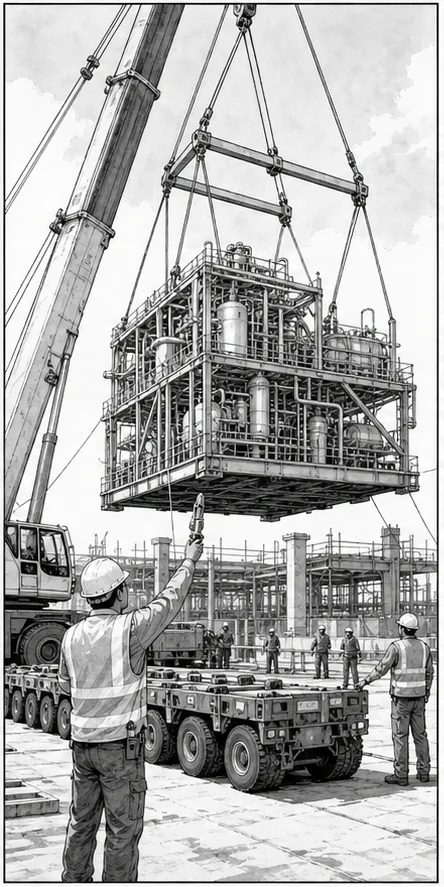
Customer deliverySite execution
Lift, haul and install
What happensCranes, modular trailers and crews move the load and place it at the customer site.
Revenue triggerUtilisation, realised rates, labour, fuel and repairs decide the job margin.
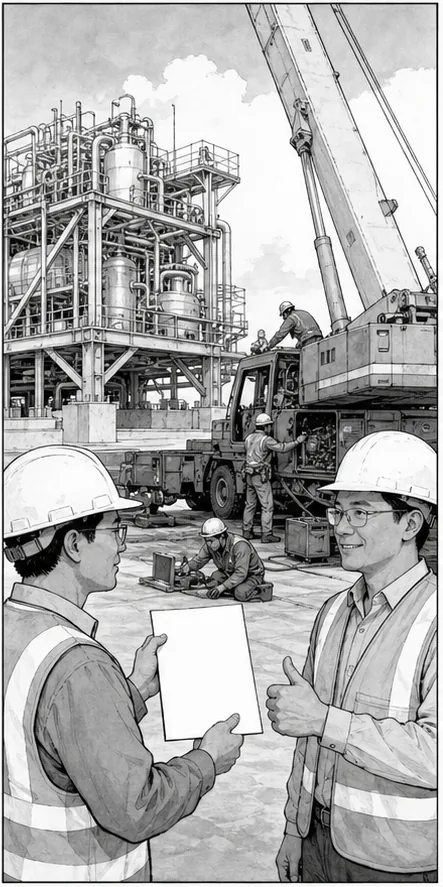
Cash conversionCertified delivery
Bill and collect cash
What happensCustomer acceptance converts completed work into an invoice, receivable and eventual collection.
Cash triggerCash must still fund fleet replacement, interest and shareholder distributions.
Investor translation
What matters after the operating picture
Four questions connect the business model to cash and balance-sheet risk. This is a factual reading aid, not a valuation or recommendation.
- Value lever
- More crane rental and lifting work creates value only when pricing covers crews, fuel, repairs, replacement equipment and interest.
- Cash bottleneck
- Equipment additions, customer receivables and project milestones absorb cash before it is available for debt service or distributions.
- Balance-sheet pressure
- Accessible cash plus operating cash no longer covers current debt, fleet replacement and lender covenant tests.
- Next proof
- Audited debt and capex notes, utilisation, realised rental rates, maintenance spending and the financed-additions bridge.
Text version of this comic
- Customer need · Scope the heavy move A project owner or EPC contractor specifies a heavy lift, haulage or installation job. Commercial trigger: The contract sets scope, milestones, price and delivery risk.
- Company action · Plan and mobilise Tiong Woon engineers the lift, selects cranes and transport, then mobilises crews and equipment. Value created: Planning and mobilisation turn fleet capacity into a deliverable service.
- Customer delivery · Lift, haul and install Cranes, modular trailers and crews move the load and place it at the customer site. Revenue trigger: Utilisation, realised rates, labour, fuel and repairs decide the job margin.
- Cash conversion · Bill and collect cash Customer acceptance converts completed work into an invoice, receivable and eventual collection. Cash trigger: Cash must still fund fleet replacement, interest and shareholder distributions.
What Tiong Woon does
Tiong Woon owns cranes, self-propelled modular trailers, transport equipment, tugboats and barges. It rents equipment and supplies engineering, mobilisation, lifting, haulage and installation services. The customer is usually a project owner, EPC contractor, industrial operator or construction contractor. Marine transportation and equipment trading are much smaller activities.
The group earns mainly from rental income and service or project revenue. Rental income was S$142.579m in FY2026, while service revenue was S$39.648m. Equipment and spare-parts sales were S$5.449m. Those streams carry different economics: equipment time depends on fleet activity and realised rates; project work also depends on engineering scope, execution, certification and collection.
Operating disclosure gap. The FY2025 annual report disclosed average heavy-lifting-asset utilisation of 54%, down two percentage points from FY2024, and 579 cranes and tower cranes at 30 June 2025 versus 543 a year earlier. This is dated aggregate evidence, not FY2026 utilisation or a fleet-class/geography breakdown. The issuer still does not publish crane-days, realised rental rates, fleet age or a maintenance-versus-growth capex split, so FY2026 revenue growth cannot be separated cleanly into fleet volume, rate and mix. FY2025 annual report, page 9.
FY2026 results: stronger activity and margin
Revenue rose 14.8% to S$187.676m in the year to 30 June 2026. Gross profit rose 24.4% to S$76.448m and gross margin recovered to 40.7% from 37.6%. Profit attributable to owners rose 24.4% to S$23.901m, or 10.31 Singapore cents a share. The largest negative below gross profit was a S$3.901m net foreign-exchange loss; manpower-related operating costs also increased.
| S$m except per-share | FY2024A | FY2025A | FY2026A |
|---|---|---|---|
| Revenue | 143.1 | 163.5 | 187.7 |
| Gross profit | 59.0 | 61.4 | 76.4 |
| Gross margin | 41.2% | 37.6% | 40.7% |
| Profit attributable to owners | 18.2 | 19.2 | 23.9 |
| EPS | 7.85c | 8.29c | 10.31c |
| Operating cash flow | — | 51.4 | 67.5 |
| Cash PPE purchases | — | 45.2 | 23.8 |
| Accounting PPE additions | — | 65.5 | 53.6 |
| NAV per share | S$1.33 | S$1.39 | S$1.47 |
Sources: FY2026 results announcement and FY2025 audited annual report. FY2024 is a compact comparative, not a substitute for the complete historical statements.
Cash conversion and the fleet-investment bridge
Operating cash flow was S$67.485m against S$23.901m of profit attributable to owners. Cash PPE purchases were S$23.795m, leaving a strong headline cash result. It is not safe to treat that single-year spend as the fleet’s recurring economic cost: accounting PPE additions were S$53.550m, and payables increased partly because of equipment purchases and customer deposits.
Across FY2025 and FY2026, average cash PPE purchases were about S$34.5m a year and average depreciation was about S$34.8m. That comparison is a useful replacement anchor, but not proof of maintenance capex. The audited FY2026 equipment note is needed to separate cash purchases, financed additions, unpaid balances, maintenance, replacement and growth.
FY2026 operating cash flow
FY2026 cash PPE purchases
FY2026 accounting PPE additions
FY2026 depreciation
One segment carries almost the whole group
| FY2026 | External revenue | Revenue share | Segment result | Segment assets | Accounting capex |
|---|---|---|---|---|---|
| Heavy Lift & Haulage | S$179.585m | 95.7% | S$33.406m | S$502.833m | S$53.173m |
| Marine Transportation | S$2.588m | 1.4% | S$0.825m | S$3.886m | S$0.377m |
| Trading | S$5.503m | 2.9% | S$0.251m | S$1.308m | — |
| Total | S$187.676m | 100.0% | S$34.482m | S$508.027m | S$53.550m |
Singapore supplied S$144.687m, or 77.1%, of FY2026 revenue. That makes Singapore construction and industrial activity relevant context, but national contract awards are not a measure of Tiong Woon’s market share, crane-tonnes, realised rate or collection.
Debt and funding: strong group ratios, incomplete legal map
At 30 June 2026 cash and deposits were S$86.605m, including S$1.937m of pledged deposits, leaving S$84.668m of cash equivalents. Current borrowings were S$25.494m and non-current borrowings S$93.436m. Gross borrowings were therefore S$118.930m and derived net debt was S$34.262m.
| FY2026 group measure | Amount or ratio | What it says |
|---|---|---|
| Cash equivalents | S$84.668m | Excludes pledged deposits |
| Current borrowings | S$25.494m | Group cash exceeds this reported balance |
| Total borrowings | S$118.930m | Current plus non-current |
| Secured borrowings | S$107.983m / 90.8% | Bank and other secured debt as a share of gross borrowings |
| Net debt | S$34.262m | Total borrowings less cash equivalents |
| Net debt / EBITDA | about 0.49x | Consolidated screening ratio |
| EBIT / finance expense | about 8.8x | Consolidated screening ratio |
The FY2025 audited report states that facilities use covenant categories including gearing, consolidated tangible net worth, debt-service coverage and total bank borrowings. It also disclosed S$100.093m of company guarantees for subsidiary facilities and security over certain deposits, machinery, vehicles and other PPE. Exact covenant thresholds, current headroom, committed undrawn facilities and the current guarantee and security map are not public. The listed holding company itself had S$0.079m of cash at 30 June 2026, so consolidated cash should not be assumed to be available to every legal borrower.
There is also a debt-movement question. Cash debt flows repaid a net S$19.531m in FY2026, yet gross borrowings rose S$7.148m. The S$26.679m difference is a derived balancing item that may include financed additions, foreign exchange and reclassifications; the preliminary filing does not reconcile it. Interest cover of about 8.8x is therefore a group screening ratio, not covenant DSCR or fixed-charge coverage.
Projects and demand: award value is not collected cash
On 24 February 2026 Tiong Woon announced new projects with an aggregate contract value exceeding S$40m, expected to run across FY2027 and FY2028. The announcement supports activity visibility, but does not disclose project margin, billing milestones, retention, performance bonds, working capital or collection timing.
BCA projected S$47bn to S$53bn of Singapore construction demand for 2026 after S$50.5bn in 2025. That is supportive background. It does not prove that Tiong Woon wins work, improves utilisation or earns a higher realised rate.
The next public tests
- FY2026 annual report. Confirm the preliminary accounts and inspect debt maturities, financed additions, guarantees, security, covenants, receivables and equipment notes.
- Proposed 2.5-cent final dividend. Watch approval and payment, but do not treat one distribution as proof of fleet economics.
- FY2027 interim results. Track gross margin, operating cash, receivables, net debt and any disclosure of utilisation, rates or project conversion.
- Project execution. Follow the more-than-S$40m programme from award through revenue, margin, billing and collection.
What you can watch yourself
Every other test on this page waits for the company to file. These do not. Each row is a series you can look up yourself, free, today — with the level this reading was built against, the levels that would put it in question, and what the series cannot tell you.
BCA total construction demand, S$ billion of contracts awarded
BCA's January construction-prospects release; read total construction demand and the later review that revises it. Building and Construction Authority, Singapore
- Last recorded
- 50 S$bn, 2026-01-22
- What the reading assumes
- 50.5 S$bn (BCA reported actual, 2025)
- Watch / alert
- 47 and 39 S$bn, on a move below — currently between the assumed level and the watch level
- How often to look
- At each BCA construction-prospects release and review (the series prints event)
What it points to. National awards indicate the pool of construction activity that may create lift and haulage needs, but not Tiong Woon's crane-days, pricing or win rate.
Direction only — this pack does not carry a coefficient from this series to reported earnings.
What it cannot tell you. Construction demand is the nominal value of contracts awarded, not work done or crane-tonnes. A large public award can move the series without creating Tiong Woon revenue, and the series cannot measure pricing, market share or collection.
Settled by Tiong Woon fleet utilisation, realised rental rates, project revenue and collected operating cash, due 2027-02-28. Lead time: Awards can convert into site activity over several years; BCA does not publish a company-specific lag..
Notes and sources
What the filings still do not answer
- Crane utilisation, crane-days and realised rental rate by fleet class and geography.
- Fleet age, remaining useful life, maintenance spending and current asset appraisals.
- The split of FY2026 additions among cash, hire purchase, bank debt and unpaid balances.
- Maintenance, replacement and growth capex.
- Top customers and projects, billing milestones, retention, bonds and project margins.
- Legal obligors, accessible cash, facility limits, commitment, maturities and covenant headroom.
- Current claims, insurance, safety incidents and uninsured operational exposure.
Download
A print-ready PDF of this page, for reading away from the screen: Tiong Woon Corporation evidence library (PDF). It carries the same content as this page — what Tiong Woon does, the FY2026 results, cash conversion and fleet investment, segment concentration, debt and funding, projects and demand, open questions and the next public tests — and the same omissions: no rating, no fair value, no forecast.
Sources and corrections
Primary sources. FY2026 results announcement, 28 August 2026 · FY2025 audited annual report · Tiong Woon announcement archive · annual-report archive · replacement corporate presentation, 13 April 2026 · project announcement, 24 February 2026 · BCA 2026 construction outlook.
Basis. Figures are reported by the issuer unless the arithmetic is described as derived. FY2026 is unaudited and unreviewed. Segment shares, cash equivalents, gross borrowings, net debt and screening ratios are simple computations from the stated figures. The page does not infer fleet values from book PPE and does not use construction awards as company revenue.
Corrections log
Correction status at 31 August 2026: no post-publication corrections had been recorded by that date. Later dated corrections are listed below and do not advance this page’s research cutoff. Corrections are welcome through the contact page and will be dated and described here.
Reader questions & corrections
Ask about this company, challenge a source or suggest a factual correction. Only selected questions that SMID Research has reviewed and answered are published.
Discuss public information and ideas with readers. Posts are independent reader discussion, not SMID Research coverage.
No reader questions have been published yet.
Submit a private question or correction
Submissions are private by default. Your email is encrypted and never published. Please do not send confidential or inside information, allegations about individuals, promotions, or requests for personalised investment advice.
Behind the lock The private vault holds the integrated equity and credit working files, valuation model, source register and unresolved evidence gates. It remains private, release-blocked and is not investment advice.
Private boundary. The author-only record is not approved for public distribution. This public page deliberately omits any rating, valuation, scenario output and portfolio action.
9 September 2026 corrections
These bounded retrospective corrections clarify specific published facts or calculations. They retain each report's existing research cutoff and do not represent a full refresh or a finding that all possible issues are resolved.
Tiong Woon Corporation
- Verified Fact. FY2025 disclosed 54% average heavy-lifting-asset utilisation, down two percentage points, and 579 cranes and tower cranes versus 543 a year earlier. Sources: Source. Limitation: This is historical aggregate evidence, not FY2026 utilisation or fleet-class/geography detail.
Price & events
No dedicated price & events section is published on this company page.
Transcripts
Find available event transcripts in the transcript library.
Private vault
Forecasts, ratings and full initiation research are in the private research library.
News and announcements
Earlier announcements, before 31 August 2026 (8)
- · TWC Achieved Revenue of $89.7 Million and Net Profit Attributable to Equity Holders of $13.6 Million in 1HFY2026 · SGX
- · TWC Reported Revenue of $163.5 Million and Net Profit Attributable to Equity Holders of $19.2 Million in FY2025 · SGX
- · TWC Achieved Revenue of $78.8 Million and Net Profit Attributable to Equity Holders of $12.1 Million in 1HFY2025 · SGX
- · Change in Composition of the Board of Directors and Board Committees · SGX
- · TWC Recorded Revenue of $143.1 Million and Net Profit Attributable to Equity Holders of $18.2 Million in FY2024 · SGX
- · Change in Composition of the Board of Directors and Board Committees · SGX
- · Tiong Woon Records Revenue of $75.3 Million and Net Profit Attributable to Equity Holders of $10.8 Million in 1HFY2024 · SGX
- · Response to SGX-ST Query · SGX
Titles are from the linked SGX filing, with common words abbreviated. Summaries are written by AI and may contain inaccuracies; refer to the original announcement. Items after 31 August 2026 are not reflected in this page's analysis; earlier items are listed for reference, may not be discussed in it, and may have been updated by later announcements.