Uni-Asia owns and charters dry-bulk ships, develops Japanese property and earns arrangement or management fees alongside co-investors.
Latest figures
In 1H2026 profit before tax was US$5.813m and operating cash flow was US$4.360m; at 30 June cash was US$28.484m against US$82.558m of borrowings, with US$31.445m of vessel capital commitments and no definitive financing disclosed for two newbuilds.
Main risk
The central risk is that cyclical charter earnings and project realisations do not fund fleet renewal without materially more debt.
Next proof
The next test is definitive newbuild financing, charter cover and the next cash-flow statement.
No public rating. Information cutoff 28 August 2026. The latest issuer filing is the 28 August EGM minutes and written answers, and the latest financial filing is the 1H2026 unaudited condensed interim financial statements and presentation of 14 August 2026. The minutes confirm the already reported unanimous approval of the Uni Harmony acquisition and restate its 60% bareboat-financing / 40% equity structure; they do not announce completion or definitive newbuild financing. Forward utilisation and rate paths remain analyst assumptions. Nothing here is a recommendation.
28 August monitoring update. The 14 August EGM represented 18,163,921 shares and approved the Uni Harmony acquisition with 100% of votes cast in favour. Written answers explain the ten-year-old vessel, independent valuation, proposed charter and co-investment rationale. This adds governance detail but no new completion or financing event. SGX announcement and attachments. (R/D)
Evidence balance
The live questionWill charter cash from the renewed fleet fund the two ordered newbuilds, or must new borrowings and co-investor equity keep paying?In 1H2026 the renewed fleet lifted charter income and profit, yet two ordered newbuilds carry roughly US$66m of implied cost with no definitive financing arranged, against US$31.445m of vessel capital commitments at 30 June 2026, before the second order.
What improved
In 1H2026 profit before tax was US$5.813m on total income of US$25.1m, with revenue-generating hire days up 40% to 1,508.87 and the average daily charter rate 17% higher at US$12,690; first-quarter operating cash flow turned to a US$4.5m inflow from a US$2.7m outflow a year earlier.
What became more demanding
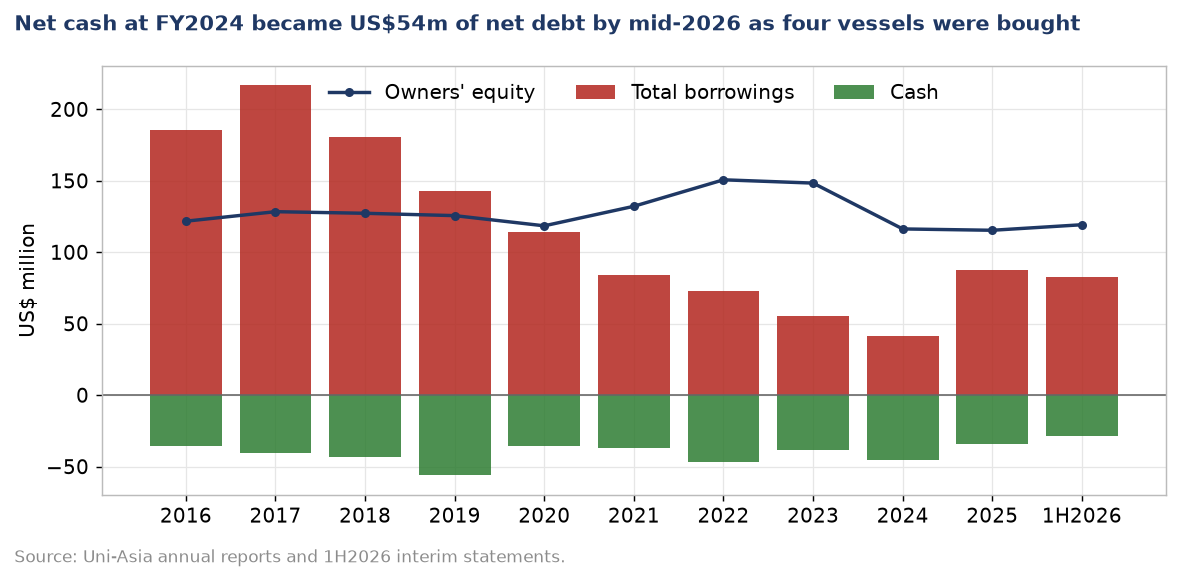
Funding the four-vessel renewal took US$68.1m of new borrowings, US$8.0m of co-investor capital and an US$11.5m draw on cash, turning a US$3.9m net cash position at FY2024 into US$54.1m of net debt by 30 June 2026; cash of US$28.484m now stands against US$82.558m of borrowings.
Strongest alternative explanation
The gearing could be the deliberate shape of a co-investment model: vessels are bought through majority-owned vehicles with 40% equity and 60% sale-and-leaseback or bareboat financing, so borrowings rise with each ship while co-investors carry part of it, which would not by itself establish parent liquidity strain.
The decisive missing fact
Decisive would be the newbuild facility terms and whether the listed parent carries recourse or guarantees on them, together with a per-vessel charter, rate and expiry ladder, neither disclosed, both listed among the questions put to the company.
Drawn from the evidence on this page: the improvement, the constraint, the benign reading and the fact that would settle it. It states no view on the shares.
About the private research record
Also on file for this company, behind the rated view 🔒 (author-only): the rating and full written view with fair value and scenarios · the complete initiation report (PDF) · the financial spread & model workbook (private research artifacts; their presence is not confirmation of current decision authority) · the presentation deck · the review artifacts. Kept private; not for distribution. The method and audit note — how the coverage was built, the review process, and every correction made — is public.
On this page
Business anatomy · operations, customers and cash
Ships and property create separate capital-and-fee lanes
Uni-Asia owns assets and also earns fees arranging or managing assets alongside third-party capital; these are not one operating chain.
Read each card by investor role: business line, operating step, customer outcome or cash conversion.
Capital allocationCapital
Fund ships and projects
What happensUni-Asia and co-investors deploy capital into vessel purchases and property projects.
Capital at riskAsset ownership puts purchase, financing and residual-value risk on the investors.
Business lineShipping lane
Own and charter capacity
What happensOwned or arranged bulk carriers provide vessel capacity to charterers and cargo interests.
How it earnsCharterers pay vessel hire for the contracted capacity.
Business lineProperty lane
Develop or realise projects
What happensProperty projects are arranged, co-invested and managed separately from the shipping fleet.
How it earnsCash can arrive through project sales and investment realisations.
Fee engineAsset management
Earn alongside third-party capital
What happensUni-Asia arranges and manages assets for projects and co-investors as well as investing its own capital.
How it earnsCo-investors and managed projects pay arrangement or management fees.
Original SMID Research comic. AI-assisted, analyst-directed monochrome artwork depicts the evidenced operating steps of Uni-Asia Group; deterministic captions and dated mix figures state the economics using issuer disclosures available to 2026-08-28. The drawings are representative—not issuer artwork, an exact product or site design, a statement of scale, or a company forecast.
Investor translation
What matters after the operating picture
Four questions connect the business model to cash and balance-sheet risk. This is a factual reading aid, not a valuation or recommendation.
Value lever
Attributable shipping cash, property realization and management fees without counting the same assets twice.
Cash bottleneck
Vessel commitments and property projects consume cash before charter receipts, sales or distributions.
Balance-sheet pressure
Parent-accessible liquidity and refinancing cannot carry vessel and project commitments.
Next proof
Charter cash, property exits, subsidiary distributions and the legal-entity maturity map.
Text version of this comic
Capital allocation · Fund ships and projects Uni-Asia and co-investors deploy capital into vessel purchases and property projects. Capital at risk: Asset ownership puts purchase, financing and residual-value risk on the investors.
Business line · Own and charter capacity Owned or arranged bulk carriers provide vessel capacity to charterers and cargo interests. How it earns: Charterers pay vessel hire for the contracted capacity.
Business line · Develop or realise projects Property projects are arranged, co-invested and managed separately from the shipping fleet. How it earns: Cash can arrive through project sales and investment realisations.
Fee engine · Earn alongside third-party capital Uni-Asia arranges and manages assets for projects and co-investors as well as investing its own capital. How it earns: Co-investors and managed projects pay arrangement or management fees.
What the company is
Uni-Asia earns money in four economically distinct ways, and the distinction is the most important thing on this page:
Ship owning and chartering. Nine handysize and supramax bulk carriers, 36,861–57,836 dwt, all Japanese-built, carried at US$145.0m at 30 June 2026. Revenue is hire days multiplied by the daily charter rate.
Maritime asset management. Originating and structuring ship investments for co-investors, arranging Japanese non-recourse and sale-and-leaseback financing, and taking administration and arrangement fees. Segment assets at 30 June 2026: US$1.9m.
Maritime services. Commercial and technical ship management and brokerage. Currently loss-making.
Japan property. The ALERO small-residential development programme in Tokyo, held through Tokumei Kumiai silent partnerships; plus a fee franchise at Uni-Asia Capital (Japan) covering five municipal PFI concessions and asset management of 20 group homes for people with disabilities under a JPY 2.975bn social project bond.
A fifth business — hotels in Japan — was the group's largest revenue line for a decade and was deconsolidated in FY2020 with a US$24.4m gain, taking about US$81m of annual revenue with it.
Registered name history matters for anyone searching the filings: Uni-Asia Finance Corporation (Cayman) to FY2013, Uni-Asia Holdings Limited to FY2016, and Uni-Asia Group Limited (Singapore, Co. Reg. 201701284Z) from the January 2017 Cayman scheme of arrangement.
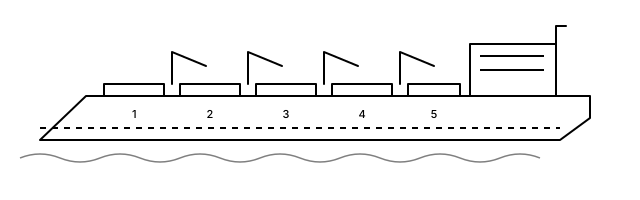
A gear-fitted handysize bulk carrier of the kind Uni-Asia owns, with numbered cargo holds. Generic representation of the vessel class, not a drawing of any Uni-Asia vessel. It establishes the vessel class only — nothing about size, age, condition, value, charter rates or utilisation. Original SMID Research illustration; no issuer artwork reproduced.
Where the profit sits, and where the capital sits
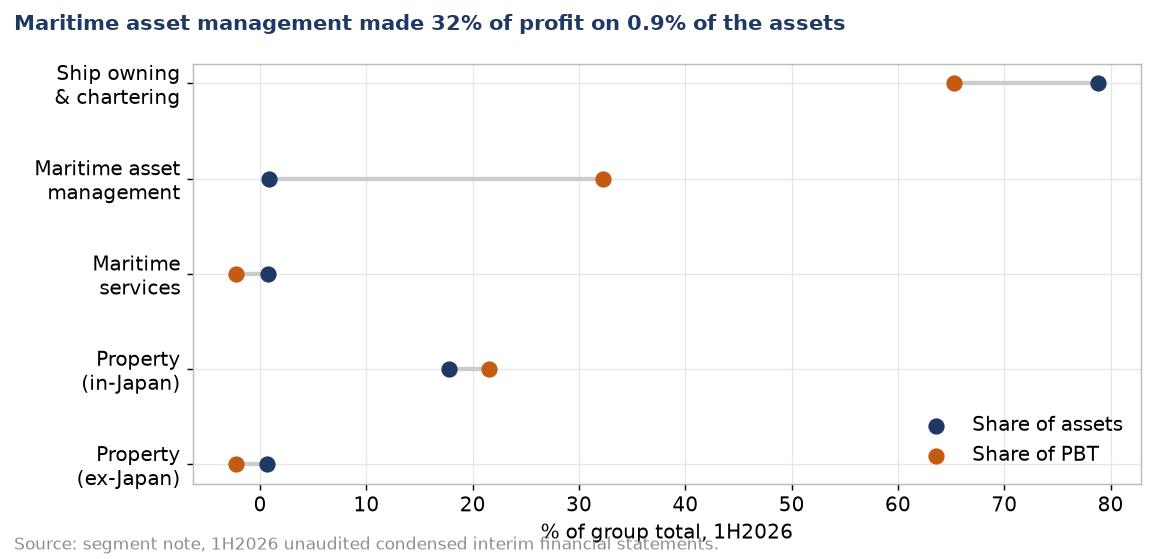
These are not the same place, and the segment note says so plainly. Segment result is struck at profit before tax — after depreciation, finance costs and the Tokumei Kumiai allocation — and the segment rows sum to group PBT in every period from FY2016 to 1H2026.
1H2026, US$'000
Total income
PBT
Segment assets
Segment liabilities
Share of group PBT
Share of group assets
Ship owning & chartering
19,469
3,794
170,341
73,687
65.3%
78.8%
Maritime asset management
2,576
1,876
1,908
102
32.3%
0.9%
Maritime services
351
(130)
1,594
141
(2.2%)
0.7%
Property investment (ex-Japan)
36
(131)
1,465
9,335
(2.3%)
0.7%
Property investment (in-Japan)
3,127
1,250
38,506
14,966
21.5%
17.8%
Unallocated
501
(860)
22,022
8,662
(14.8%)
10.2%
Eliminations
(939)
14
(19,622)
(19,413)
0.2%
(9.1%)
Group
25,121
5,813
216,214
87,480
100%
100%
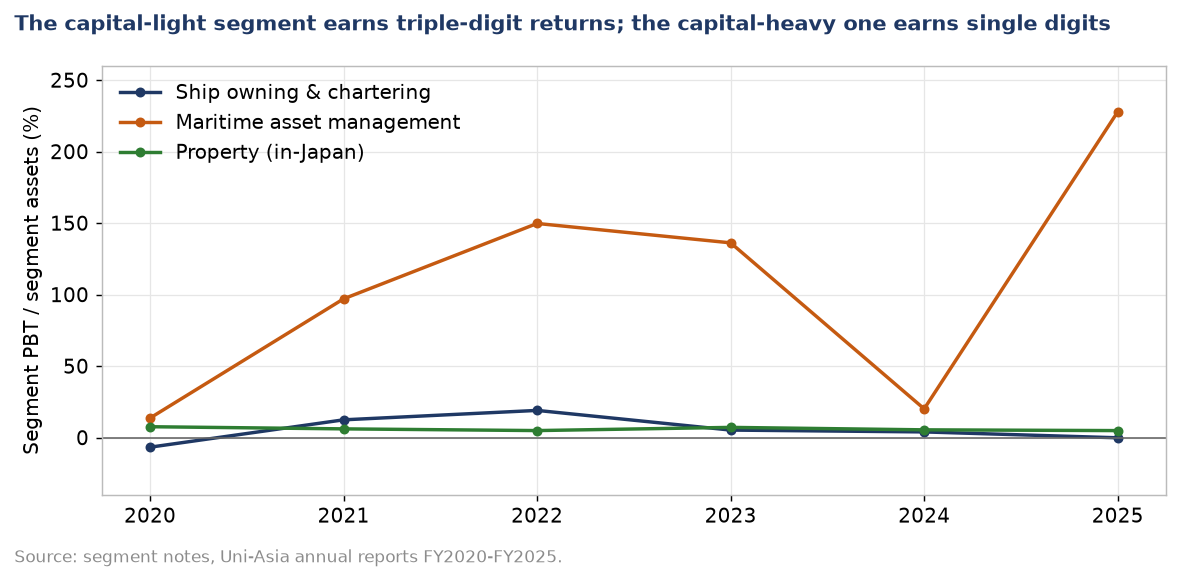
Caution on maritime asset management. Its 32%-of-profit-on-0.9%-of-assets is not a recurring fee annuity. Asked at the 30 April 2026 AGM why the segment jumped, the Executive Director attributed it to “gains from vessel disposals, including the partial disposal of jointly owned vessels classified under Maritime Asset Management” and to completed transaction fees, adding that “such income is inherently non-recurring and dependent on deal activity”. The notes agree: the recurring asset-management-and-administration fee line fell 18% in FY2025 to US$2.228m, while arrangement and agency fees quadrupled to US$2.314m and realised shipping gains were US$3.412m — of which US$3.404m came from investee companies, i.e. the related-party joint-investment pool being wound down (AR2025 pp.145, 177). Separately, part of the segment’s apparent capital-lightness is a reclassification: from 1 January 2020 three wholly-owned ship subsidiaries moved out of it into ship owning, and restated FY2019 segment assets were US$5.4m, not the US$45.3m first reported (AR2020 p.115).
Source: 1H2026 unaudited condensed interim financial statements, note 4. Caution on segment liabilities: they include intra-group funding, which is removed in the eliminations column. The ex-Japan property segment's US$9.3m against US$1.5m of assets is therefore not evidence of an external claim of that size — the composition is not disclosed at segment level, and it is one of the open questions below.
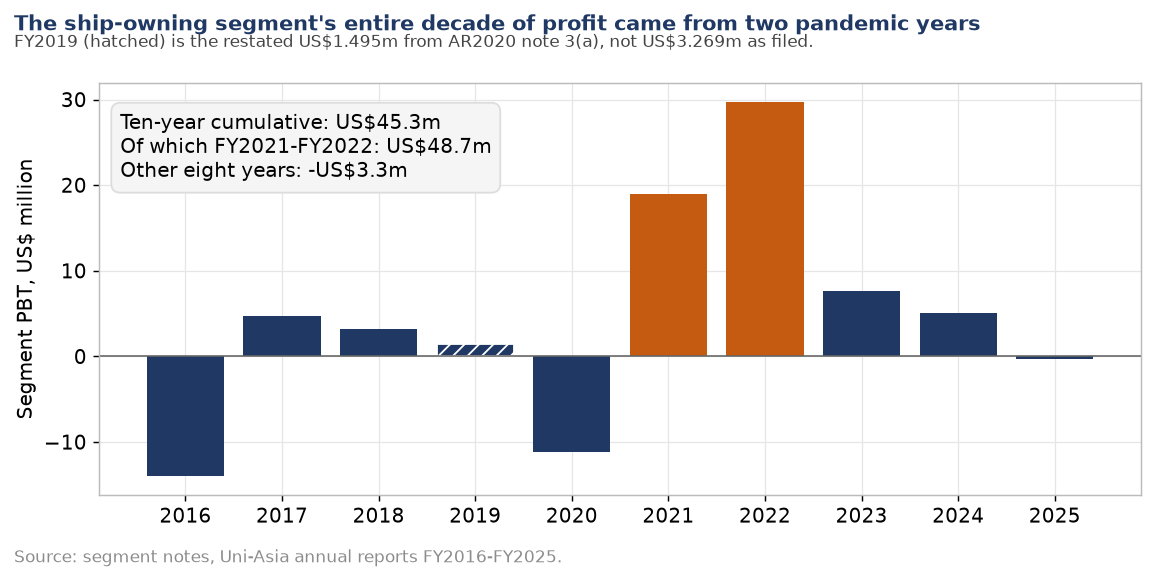
Share of group PBT against share of group assets, 1H2026. Computed from the segment note; both columns sum to 100%.Ship-owning segment PBT by year. Cumulative FY2016–FY2025: +US$45.3m, of which US$48.7m came from FY2021 and FY2022, leaving −US$3.3m across the other eight years. Definition break: from 1 January 2020 three wholly-owned ship subsidiaries moved into this segment from maritime asset management, and only FY2019 was restated (AR2020 note 3(a): FY2019 segment PBT restated from US$3.269m to US$1.495m). The figures use the restated FY2019; FY2016–FY2018 carry the same issue with no restatement published, so a fully definition-consistent ten-year series cannot be built from public disclosure. Source: segment notes, annual reports FY2016–FY2025.Segment PBT divided by segment assets. Maritime asset management became capital-light only after the group exited its directly held ship investments — it carried US$48–69m of assets in FY2016–FY2019 and lost US$9.4m in FY2018 on containership impairments.
The as-filed history since listing
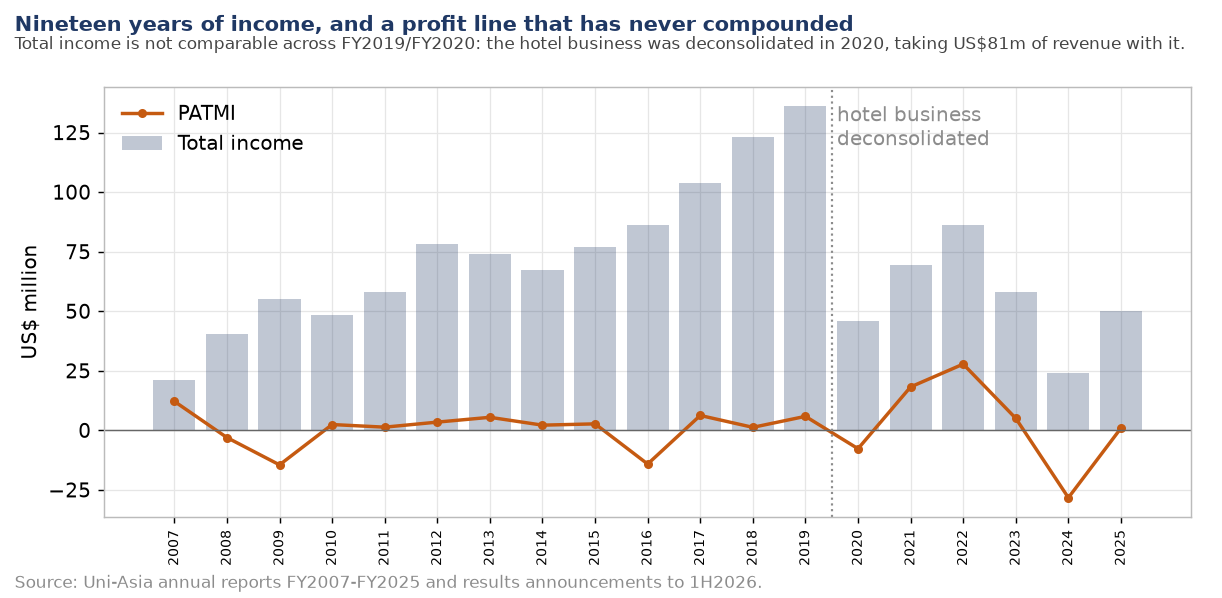
No revenue series crosses FY2019/FY2020 without a break. The hotel deconsolidation took total income from US$136.0m to US$45.9m. Reported figures, US$'000:
US$'000
FY2021
FY2022
FY2023
FY2024
FY2025
1H2026
Charter income
47,805
65,279
37,812
32,494
27,598
19,097
Fee income
5,731
6,596
4,669
3,794
5,267
2,990
Sale of properties under development
9,134
8,658
12,130
14,788
8,414
—
Investment returns
5,431
4,712
2,618
(28,610)
5,874
2,550
Total income
69,435
86,136
58,034
23,959
49,875
25,121
Operating profit
22,247
32,528
10,511
(24,016)
5,552
7,898
Profit before tax
18,996
28,928
6,224
(27,417)
1,892
5,813
Attributable to owners
18,201
27,783
5,007
(28,301)
920
5,187
EPS (US cents)
23.16
35.35
6.37
(36.01)
1.17
6.60
Operating cash flow
28,379
34,924
18,990
17,143
225
4,360
Equity attributable to owners
132,134
150,666
148,361
116,289
115,346
119,220
Total borrowings
83,841
72,712
55,604
41,635
87,427
82,558
Cash and bank balances
36,732
47,069
38,260
45,523
33,991
28,484
Sources: annual reports FY2021–FY2025 and the results announcements of 28 Feb 2025, 26 Sep 2025, 26 Feb 2026 and 14 Aug 2026. The full nineteen-year series from FY2007 is in the workbook.
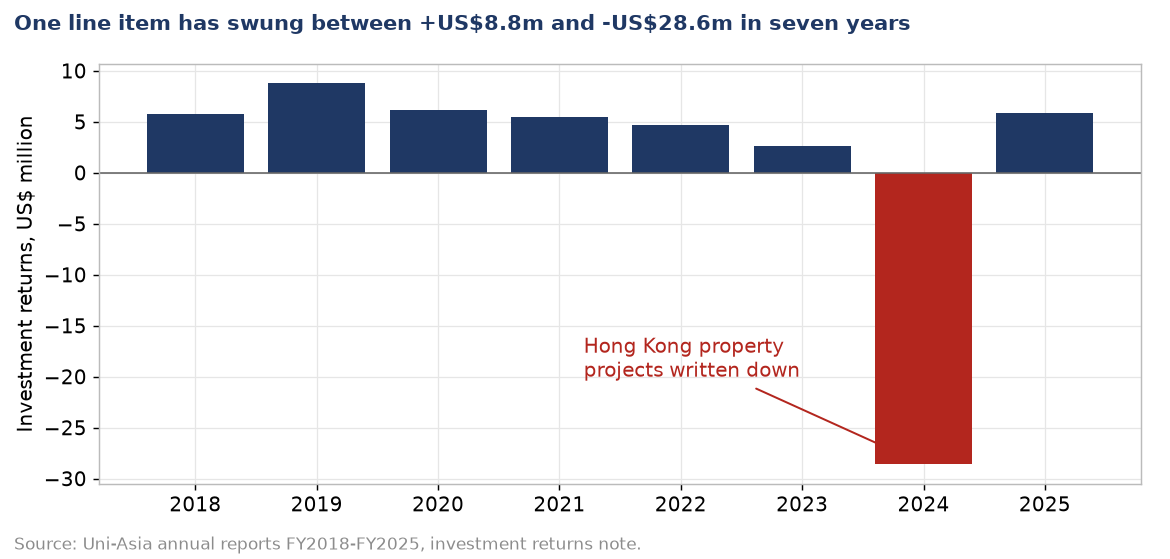
Nineteen years of total income and profit attributable to owners. Five loss years in nineteen. The dotted line marks the FY2020 hotel deconsolidation, on either side of which the revenue base is not comparable.The investment-returns line, which sits above the operating-profit line in this issuer’s income statement. In FY2024 the write-down was a fair-value loss of US$31.5m on unlisted shares in commercial office and industrial buildings, inside a net investment-returns line of −US$28.6m (AR2025 p.145). The exposure was a minority stake in a Hong Kong development consortium; the ex-Japan property segment’s assets fell from US$33.2m to US$1.3m.
The FY2024 write-down was disclosed in three escalating steps before the result: a market update on 13 February 2025 stating the group "may not be able to recover all or any of its capital", a formal profit-guidance announcement on 21 February, and the result on 28 February.
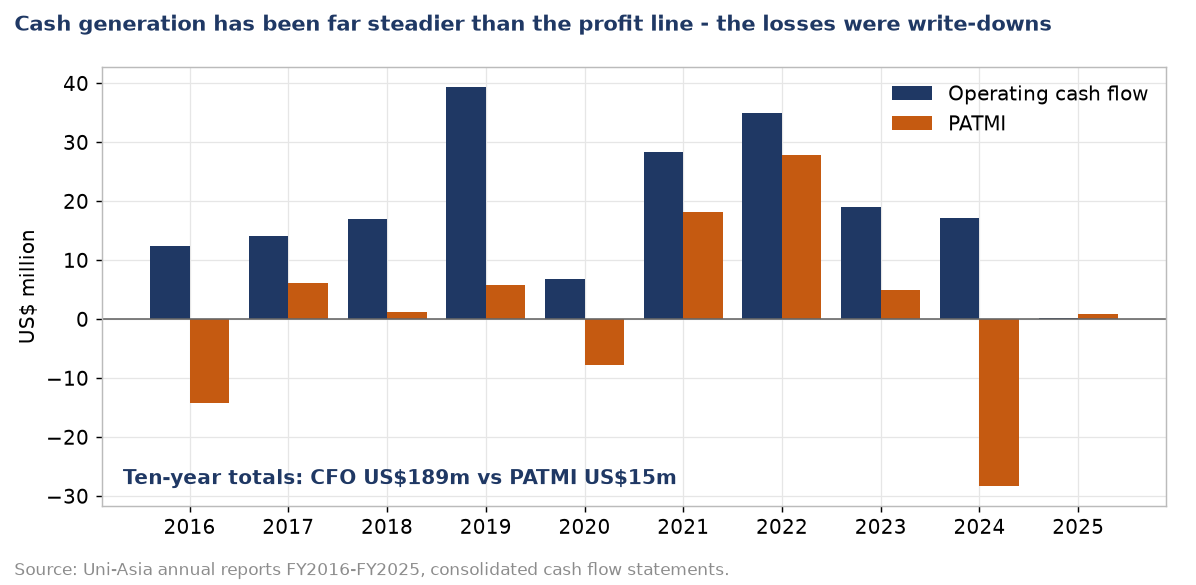
Cumulative FY2016–FY2025: operating cash flow US$189.2m against profit attributable to owners of US$15.0m. The losses were overwhelmingly non-cash write-downs. FY2025 is the exception in the other direction — cash flow collapsed to US$0.2m after the MV Glengyle collision, prepayments tied to that casualty, and a US$5.2m build in development properties.A US$3.9m net cash position at FY2024 became US$54.1m of net debt by 30 June 2026, funding the four-vessel renewal with US$68.1m of new borrowings, US$8.0m of co-investor capital and an US$11.5m draw on cash. US$78.6m of US$82.6m total borrowings, or 95.2%, was secured on vessels, investment property and related assets; US$4.0m was unsecured. There are no bonds, no MTN programme and no public credit rating.
Disclosed operating metrics and charter visibility
The issuer reports 1H2026 hire days and average daily charter rate in Appendix 7.2 of the interim statements, alongside charter income, vessel operating expenses, fleet count, selected forward fixtures and aggregate charter cover. Numerical utilisation, a complete forward rate path and a vessel-by-vessel charter ladder remain undisclosed.
Metric
1H2026
Source status
Charter income
US$19.097m
Reported
Revenue-generating hire days
1,508.87 (+40% y/y)
Reported in Appendix 7.2
Average daily charter rate
US$12,690 (+17% y/y)
Reported in Appendix 7.2
Vessel operating expenses
US$8.083m
Reported
Operating profit
US$7.898m
Reported
Vessels at 30 Jun 2026
9
Reported
Firm charter cover
4/9 at Dec-2026; 3/9 at Jun-2027; none at Dec-2027
Reported in the presentation
Numerical utilisation / full forward rate path
Not disclosed
Analyst assumptions only
Sources: 1H2026 unaudited condensed interim financial statements, Appendix 7.2 (physical PDF p.31 / internal p.29), and results presentation, 14 August 2026. Historical issuer KPIs are separated from analyst forecast assumptions.
The fleet, as at 31 March 2026
Vessel
DWT
Built
Shipyard
Group ownership
Acquired
Cost
ANSAC Pride
37,094
2013
Onomichi
100%
—
—
Island Bay
37,649
2014
Imabari
100%
—
—
Inspiration Lake
37,706
2015
Imabari
100%
—
—
Uni Phoenix (formerly Glengyle)
37,679
2015
Imabari
100%
—
—
Uni Bulker
37,700
2016
Imabari
100%
—
—
Kellett Island
57,836
2015
Tsuneishi
75.0%
Feb 2025
US$22.70m
Uni Sunshine
36,880
2018
Oshima
72.7%
Jul 2025
US$20.86m
Uni Horizon
36,861
2018
Oshima
70.2%
Aug 2025
US$20.33m
Trident Star
57,836
2015
Tsuneishi
65.1%
Dec 2025
US$18.40m
Source: Annual Report 2025, pp.19–25, and the four completion announcements. Dwt-weighted average age 10.6 years. MV Glengyle was renamed MV Uni Phoenix after the April 2025 collision and returned to service on 22 April 2026 — worth noting, because a reader comparing the FY2022 and FY2026 fleet tables without knowing that would conclude one vessel had been sold and another bought.
Three further vessels — Uni Harmony, Uni Blossom and Sider Montediprocida, each 37,700 dwt Imabari-built — are held as 18% joint investments. Five 29,000 dwt vessels were disposed of by FY2025, completing the group's exit from that size class.
Two newbuilds are on order: one 40,000 dwt eco-specification double-hull bulk carrier from Imabari's Shimanami yard for delivery in 2H2028 (announced 4 March 2026), and a second 40,000 dwt vessel for delivery between 4Q2029 and 1H2030 (announced 6 August 2026). Neither announcement disclosed a price; both state that no definitive financing had been arranged at the time of announcement. Vessel capital commitments were US$31.445m at 30 June 2026, against a US$1.655m deposit already paid.
What the fleet renewal cost, and who paid for it
US$’000, from the consolidated statements of cash flows in the FY2022, FY2024 and FY2025 annual reports. FY2023 is taken from the FY2024 report’s comparative column: the FY2023 annual report held in the research pack will not open — the file has no end-of-file marker — so the same audited figures are read from the following year’s accounts instead. The purchase line for FY2021 and FY2023 combines investments with investment property, which those years present on separate lines.
US$’000
FY2021
FY2022
FY2023
FY2024
FY2025
Operating cash flow
28,379
34,924
18,990
17,143
225
Purchase of property, plant and equipment
2,050
3,810
6,368
1,006
84,554
Proceeds from disposal of property, plant and equipment
–
–
7,522
–
8,797
Proceeds from disposal of assets held for sale
9,758
–
–
18,943
10,317
Purchase of investments and investment property
7,943
3,498
9,278
7,661
3,850
Proceeds from redemption or sale of investments
9,020
6,458
2,933
3,054
3,498
Proceeds from sale of investment properties
–
–
4,429
–
4,135
Borrowings drawn
11,828
8,275
31,756
8,544
68,093
Borrowings repaid
39,463
16,875
47,837
25,484
25,819
… net (repayment)/draw
(27,635)
(8,600)
(16,081)
(16,940)
+42,274
Interest and other finance costs paid
2,881
2,729
3,892
3,419
3,750
Lease principal paid
3,628
3,597
591
559
499
Dividends paid
1,762
6,476
5,982
1,874
1,808
Contributions from non-controlling interests
–
–
–
–
7,951
Cash and cash equivalents at year end
36,732
47,069
38,260
45,523
33,991
FY2025 spent US$84.6m on property, plant and equipment. The four preceding years together spent US$13.2m. The company’s own financial review attributes the figure mainly to the acquisition of four vessels during the year, and it landed in the one year of the five when operating cash flow was effectively nil — US$0.2m, against US$17.1m the year before and US$34.9m in FY2022. So the fleet renewal was not funded out of the fleet. It was funded by US$68.1m of new borrowings, which the review says were raised “mainly to fund ship and property investments”, and by US$8.0m of contributions from non-controlling interests — the first such contribution in the five years, and the company attributes it to new ship investments.
That single year reverses the direction of the whole period. Across FY2021 to FY2024 the group repaid US$129.7m of borrowings and drew US$60.4m, a net repayment in every one of the four years. FY2025 drew US$68.1m against US$25.8m repaid — a net draw of US$42.3m, which gave back 61% of the US$69.3m the group had paid down over the previous four years. The as-filed history above shows the consequence on the balance sheet: total borrowings fall from US$83.8m to US$41.6m over four years and then more than double back to US$87.4m in one.
The disposals partly offset it and are worth separating, because they are ships. FY2025 took in US$8.8m from the sale of MV Clearwater Bay and US$10.3m from MV Uni Challenge, both wholly-owned bulkers, against the four vessels bought. The group is not simply adding tonnage; it is turning the fleet over, and the cash cost of doing so in one year was roughly four times what it recovered from selling the old ships.
The dividend was cut before the capital programme, not because of it. US$6.5m went out in FY2022 and US$6.0m in FY2023, against FY2021’s and FY2022’s record profits. It then fell to US$1.9m and US$1.8m — a 72% cut — which follows the FY2024 loss rather than the FY2025 spending. FY2025’s US$1.8m comprised the FY2024 final and the FY2025 interim, and it was still nearly eight times that year’s operating cash flow.
Ownership, and who the group buys its ships from
Substantial shareholders, 18 March 2026
Direct
Deemed
Yamasa Co., Ltd
—
30.00%
Evergreen International S.A.
8.95%
—
Precious Shipping Public Company Limited
—
5.96%
Michio Tanamoto (former executive chairman)
4.14%
—
Public float
53.56%, across 2,617 shareholders
The register has moved since that date
Six notifications filed under the Securities and Futures Act between 20 May and 16 July 2026 show a holder that does not appear in the annual report's table at all. Asparta Pte. Ltd. held 4.999% at 18 March 2026 — just under the disclosure threshold — crossed 5% on 19 May 2026, and kept buying:
Date of change
Shares acquired
Holding after
% after
Consideration
Implied price
19 May 2026
672,900
4,602,400
5.855%
S$618,549.86
S$0.9192
22 May 2026
314,800
4,917,200
6.256%
S$292,760.85
S$0.9300
26 May 2026
133,500
5,050,700
6.426%
S$126,599.39
S$0.9483
18 Jun 2026
100,000
5,150,700
6.553%
S$93,000.00
S$0.9300
15 Jul 2026
119,300
5,270,000
6.704%
S$110,352.50
S$0.9250
Total
1,340,500
from 4.999% to 6.704%
S$1,241,262.60
S$0.926 average
Source: six SFA Form 3 notifications, 20 May to 16 Jul 2026; two filings dated 28 May 2026 replaced the 19 and 22 May notices with identical figures and are counted once. All acquisitions were on-market. The form records that Asparta is not a fund manager; the beneficial owner is not disclosed. 1,340,500 shares is roughly 34 days of the stock's average traded volume.
Over the same period Precious Shipping's deemed interest rose from 5.96% to 6.01% (26 June 2026, through Unity Ventures). Its Managing Director, Khalid Moinuddin Hashim, has sat on the board since 30 April 2025.
Recomputed float. Four holders — Yamasa 30.00%, Evergreen 8.95%, Asparta 6.70%, Precious Shipping 6.01% — now hold 51.7% between them. Excluding Asparta as a substantial shareholder takes the public float from the 53.56% disclosed at 18 March 2026 to approximately 46.8%. Listing Rule 723 requires a minimum 10% public float and is comfortably met.
Four of the nine vessels were acquired in FY2025 from special-purpose companies majority-owned by Yamasa, the 30% shareholder. The FY2025 related-party note records US$82.29m of property, plant and equipment acquired from investee companies. Each purchase was an interested-person transaction requiring shareholder approval, which is why the company held four extraordinary general meetings between January 2025 and August 2026.
The one transaction with a published valuation is instructive. For MV Uni Harmony (announced 29 July 2026), the group is paying US$20.53m against an independent open-market valuation range of US$19.95m to US$22.05m from Exeno Yamamizu Corporation dated 21 April 2026 — inside the lower half of the range. The seller, Quest Bulkship S.A., is 18% owned by the group and 82% owned by Yamasa.
The same announcement discloses something the group’s own accounts never break out: that vessel’s profit was US$0.41m in FY2023, US$0.72m in FY2024 and US$0.11m in FY2025 — on an asset valued at US$20.5m. The US$20.53m price sits 28% of the way up the US$19.95m–US$22.05m valuation range, i.e. in its lower half.
The announcement also carries a contingent exposure the balance sheet does not: the Company will be payment guarantor for up to US$12.32m of the seven-year bareboat financing if the financier requires it, with the four co-investors counter-indemnifying 44.4% (§2.7). The issuer sizes the whole transaction at US$17.33m, or 13.9% of latest audited NTA (§4.1). For comparison, the corporate guarantees on the 30 June 2026 balance sheet were US$1.7m.
How the register votes
At the annual general meeting of 30 April 2026, two routine mandates were defeated. The poll results are in the minutes filed on 28 May 2026:
Resolution
For
Against
Outcome
9 — authority to allot and issue shares
18,132,833 (39.94%)
27,265,316 (60.06%)
NOT carried
11 — share purchase (buyback) mandate
21,816,033 (48.06%)
23,582,116 (51.95%)
NOT carried
Total votes cast were 45,398,149, or 57.8% of the 78,599,987 shares in issue. The votes against Resolution 11 are exactly 23,582,116 — Yamasa’s registered holding per the AR2025 substantial-shareholder table. Resolution 10, the interested-person-transaction mandate from which Yamasa was required to abstain, drew total votes of 21,816,033, which is 45,398,149 less 23,582,116 — confirming which block sits in Resolution 11’s “against” column. The Appendix 1 Q&A records that the same buyback mandate was also not carried at the extraordinary general meeting of 30 April 2025.
Recorded here as an as-filed fact with its arithmetic, which is what an evidence library is for. Readers can draw their own conclusions about what it means for a company trading below book.
Board and auditor
Khalid Moinuddin Hashim has been a non-independent non-executive director since 30 April 2025. He is Managing Director and a board member of Precious Shipping PCL of Bangkok — one of the largest handysize, supramax and ultramax owners in the world, with 40 ships and four on order — and Precious Shipping holds 5.96% of Uni-Asia (AR2025 pp.47–48). Asked at the 2026 AGM whether substantial shareholders contribute operationally, he stated there is no direct business collaboration between the two companies and no conflict of interest, and that he contributes expertise at board level. Unity Ventures, a wholly owned Precious Shipping subsidiary, has been adding on-market in small clips: 46,000 shares in March 2025 and 19,000 in June 2026, taking the group holding to 4,725,100 shares.
The auditor has changed twice in three years. Ernst & Young audited the group from 2008; KPMG from 28 April 2023; and RSM SG Assurance was appointed at the 30 April 2026 AGM (Resolution 8, carried 99.97%). The appendix to the AGM notice states that KPMG “indicated to the Company that it was not seeking re-appointment” for FY2026, that there were no disagreements on accounting treatments for FY2025, and that the change is expected to produce audit fee savings of approximately 15% “having regard to the Group’s financial performance over the last two financial years” (AR2025 p.194).
The accounting change that lands in FY2026
With effect from 1 January 2026, the group revised the estimated useful lives of its vessels from 20 years to 25 years, applied prospectively as a change in accounting estimate. The issuer states the decrease in depreciation expense "amounts to approximately US$4.1 million", which will instead be recognised over the extended lives in future years. Cash flow is unaffected.
The stated reasons are the operational condition of the fleet after the renewal, improvements in vessel efficiency and environmental performance, prevailing industry practice among comparable listed dry-bulk companies, and the increasing economic operating lives of modern dry-bulk vessels.
Source: 1H2026 unaudited condensed interim financial statements, note 2.2, page 10. Recorded here as a fact with its magnitude, because any comparison of FY2026 earnings against FY2025 or earlier is affected by it. A separate observation: the Uni Harmony acquisition announcement of 29 July 2026 describes "the Group's depreciation method for vessels, being 20 years" — seven months after the change took effect.
Corporate-events timeline, FY2024 to date
Date
Event
29 Feb 2024
Masahiro Iwabuchi appointed CEO (the FY2024 and FY2025 statements record the sales of MV Victoria Harbour in December 2024 and MV Uni Challenge in early 2025, not on this date)
13 Feb 2025
Update on Hong Kong property project investments: the group "may not be able to recover all or any of its capital"
21 Feb 2025
Profit guidance: a net loss expected for FY2024 on fair-valuation losses
25 Feb 2025
Acquisition of MV Kellett Island completed (US$22.70m)
28 Feb 2025
FY2024 results: loss attributable to owners of US$28.3m. Board reshuffle: executive chairman steps back, new non-executive chairman, group CFO ceases and a new CFO is appointed
27 Apr 2025
MV Glengyle collision incident (a series of updates followed, to 22 April 2026)
14 Jul 2025
Cybersecurity incident
1 Aug 2025
Extension of time granted for compliance with Listing Rule 705(3)(b) — the 1H2025 announcement
24 Jul / 13 Aug 2025
Acquisitions of MV Uni Sunshine (US$20.86m) and MV Uni Horizon (US$20.33m) completed
26 Sep 2025
1H2025 results filed, about three months later than the usual cadence
9 Dec 2025
Acquisition of MV Trident Star completed (US$18.40m)
26 Feb 2026
FY2025 results: profit attributable to owners of US$0.9m
4 Mar 2026
First newbuild order in over a decade: one 40,000 dwt vessel, delivery 2H2028
30 Apr 2026
Annual general meeting
19 May 2026
1Q2026 corporate update
29 Jul 2026
Proposed acquisition of MV Uni Harmony from Quest Bulkship S.A. (US$20.53m)
6 Aug 2026
Second newbuild order: one 40,000 dwt vessel, delivery 4Q2029–1H2030
14 Aug 2026
1H2026 results: profit attributable to owners of US$5.2m. Interim dividend of SG1.0 cent. EGM approves the Uni Harmony acquisition. CEO succession announced: Shinichiro Ishizaki to succeed Masahiro Iwabuchi on 1 March 2027
20 Aug 2026
CEO Masahiro Iwabuchi disclosed an on-market purchase of 20,000 shares for S$18,675, taking his direct interest to 1,160,000 shares (1.48%)
Dividends declared, per financial year
FY
2019
2020
2021
2022
2023
2024
2025
2026 interim
SG cents per share
4.20
1.00
7.00
14.50
4.40
3.00
2.00
1.00
Source: the issuer's dividend-per-share history page. FY2021 included 2.0 cents and FY2022 5.0 cents of special dividend. The full series back to the 2007 listing, including the 2015 one-for-ten share consolidation and the 2019 bonus issue, is in the workbook. Share count has been static at 78,599,987 since 2019, with no treasury shares, options, convertibles or scrip scheme.
The share price and what came with its moves
Over the window Uni-Asia returned +13.6% on a dividend-adjusted basis; the Straits Times Index returned +80.0%.
Click a quarter — on the chart or in the return strip under it — to read its filings beside its large moves.
Key: Uni-Asia (CHJ) as a solid line; Straits Times Index rebased, dashed; the benchmark runs off scale from May 24 and is clipped there; filing ticks above the axis; ex-dividend ticks on it; numbered pins are moves with a written note; plain dots are other detected moves.
The heaviest session in the three years was 19 May 2026, when the shares rose 8.05% on 756,800 shares, about thirty-two times the median. A Form 3 notification filed the next evening records that Asparta Pte. Ltd. bought 672,900 of them — roughly 89% of the session — for S$618,549.86, crossing the 5% substantial-shareholder threshold.
Key moves
The five largest moves over a day or up to two weeks, with no day counted twice.
Each move is shown next to the market over the same days (and peers, where shown). News listed with a move was published within its dates; that does not mean the news caused the move. The quarter view has all the news.
Charter income fell 40% to US$20.6m; the average daily charter rate for the ten consolidated bulk carriers was US$11,595/day against US$19,411/day a year earlier. Operating profit was US$6.5m (down 66%) and profit attributable to owners US$4.2m. Operating cash flow was US$7.7m; cash and bank balances fell US$15.6m to US$31.5m and total borrowings were US$62.0m (computed from the balance sheet). An interim dividend of 2.2 Singapore cents was declared. The same evening the company announced that CEO Kenji Fukuyado would retire on 29 February 2024 and that executive director Masahiro Iwabuchi would succeed him.
Guidance: No forecast. The company said market players were 'generally optimistic for the mid-term prospects of dry bulk' on supply constraints and that it was using more index-linked charters on renewal.
The update is a presentation without a profit and loss statement. Total assets were US$213.8m (31 December 2022: US$236.7m). The company attributed the lower operating cash flow to the slower charter market, fewer development properties sold and the absence of ship-finance arrangement fees. The quarterly chart put the 3Q2023 average charter hire rate at US$9,237/day, the third consecutive quarterly decline, and the company said it had arranged index-linked charters for some ships. The oldest wholly-owned ship, Uni Auc One, was sold with completion on 10 November 2023, unmortgaged, with proceeds added to cash. UACJ's Japan property assets under management were JPY38.7 billion.
Charter income fell 42% to US$37.8m; the average daily charter rate fell through the first three quarters and recovered to US$10,201/day in 4Q2023. Profit attributable to owners was US$5.0m against US$27.8m, with 2H2023 contributing US$0.8m. The year carried a US$2.3m gain on the Uni Auc One sale, a US$1.2m impairment reversal on Uni Wealth (contracted for sale in January 2024) and a US$2.1m fair-valuation loss on the Hong Kong property projects. Operating cash flow was US$19.0m (FY2022: US$34.9m); borrowings fell US$17.1m to US$55.6m (computed) and cash was US$38.3m; net asset value per share US$1.89. A final dividend of 2.2 cents was proposed. Masahiro Iwabuchi became CEO the same day.
Guidance: No forecast. The company saw 'mixed signals' for 2024 dry bulk demand, expected second-hand prices for younger ships to stay strong, and said there 'might be a possibility of the Group booking further fair valuation losses' on Hong Kong property if conditions persisted.Next session (1 Mar): CHJ −3.0% · STI −0.2%
Total assets were US$207.3m. First-quarter operating cash flow was US$2.3m (1Q2023: US$3.5m), which the company attributed to no development-property sale in the quarter; the Uni Wealth sale completed with US$5.1m of net investing inflow and no significant gain expected. The 1Q2024 average charter hire rate was US$10,205/day. On Hong Kong, where the group held minority stakes in five development projects, the company said it 'may consider recognising fair valuation losses' in the six months to 30 June 2024 if conditions did not improve.
The company set the results date as 14 August 2024 after trading hours and referred back to the possibility flagged in the 1Q2024 update of 16 May 2024. No quantum was given.
Loss attributable to owners was US$11.8m against a US$4.2m profit in 1H2023. Charter income fell 22% to US$16.0m with eight wholly-owned ships against ten; the average charter rate was US$10,699/day (1H2023: US$11,595). Excluding the valuation loss, investment returns were US$0.5m. The company disclosed that the first three Hong Kong projects had returned US$42.7m on US$17.5m invested, that it 'may not be able to recover all capital' on the remaining projects if the consortium sold into the current market, and that it carried no guarantees or commitments on them. Operating cash flow was US$6.2m; Uni Wealth brought in US$8.6m; borrowings fell to US$51.0m (computed) and cash was US$36.3m; net asset value per share US$1.70 (31 December 2023: US$1.89). Interim dividend cut to 1.0 cent from 2.2.
Guidance: No forecast. The company said second-hand prices favoured selling the older 29k dwt ships but were 'a hurdle' to buying; the Hong Kong market 'continues to be subdued'.Next session (15 Aug): CHJ −1.4% · STI +0.9%
Total assets were US$189.8m. The company attributed the operating cash improvement to ship charter income and the Japan property business. The nine-month average charter hire rate for all ships was US$10,883/day (9M2023: US$10,790), with the older 29k dwt ships below the 38k dwt ships. The eight wholly-owned ships averaged about 10.5 years; the company said it might acquire some of the seven 18%-owned joint-investment ships to replace older tonnage. On Hong Kong it said it 'may consider recognising further fair valuation losses' for the six months to 31 December 2024. UACJ was appointed asset manager of 20 group homes under a JPY2.975 billion social project bond and its consortium won a third PFI project in Kawasaki City on 29 October 2024; AUM was JPY43.3 billion.
Amity Bulkship S.A. (75% group, 25% Sanei Kaiun) agreed to buy the 2015 Tsuneishi Cebu vessel from Olive Bulkship S.A., in which the group holds 18% and Yamasa Co., Ltd (the 30.0% controlling shareholder) 82%. The independent valuation was US$22.35m to US$24.65m at 22 October 2024. Funding is 40% equity (US$9.08m, of which the group's share of JVCo capital is US$7.41m) and 60% by a sale-and-leaseback of up to ten years with a financier owned by SS Line Co., Ltd; the Company is payment guarantor with a 25% counter-indemnity from the co-investor. Shareholders approved it at the EGM of 9 January 2025 (99.48% for) and completion was announced on 25 February 2025.
The company cited declining values, tightening credit, rising office vacancies and reports of developers selling at a loss, and repeated that it had no contingent liabilities or capital commitments on the projects. Shareholders were advised to exercise caution.
The third staged warning on the same item, after the 3Q2024 update of 22 November 2024 and the property update of 13 February 2025. No quantum was given.
Total income fell 59% to US$24.0m because the US$31.0m Hong Kong fair-valuation loss and a US$0.5m Guangzhou loss sit inside investment returns (US$2.9m excluding them). Charter income fell 14% to US$32.5m after the Uni Wealth and Victoria Harbour sales, while the average daily charter rate rose each quarter from US$10,205 to US$11,784. Operating loss was US$24.0m; 2H2024 loss attributable to owners US$16.5m. Operating cash flow was US$17.1m; borrowings fell US$14.0m to US$41.6m (computed), cash rose to US$45.5m and net asset value per share fell to US$1.49 from US$1.89. Final dividend 2.0 cents. The same evening: executive chairman Michio Tanamoto to hand the chair to non-executive director Philip Chan Kam Loon at the 30 April 2025 AGM, Lee Gee Aik to retire, and Group CFO Lim Kai Ching to become an executive director with Rachel Choo as CFO from 1 April 2025.
Guidance: No forecast. The dry bulk charter market for 2025 'could be volatile' on tariffs; second-hand prices had softened since mid-2024; one 29k dwt ship remained to sell and the group would look at second-hand vessels, including from its 18%-owned joint investments.Next session (3 Mar): CHJ +0.7% · STI +0.3%
Bloom Bulkship S.A. (72.7% group, 16.4% Sea Trade and Transport, 10.9% Hopeful Marine) agreed to buy the 2018 Oshima vessel from Unicorn Bulkship S.A. (18% group, 82% Yamasa). The independent valuation was US$19.95m to US$22.05m at 7 February 2025. Funding is 40% equity (JVCo capital US$9.14m, of which US$6.64m from the group) and 60% sale-and-leaseback, with the Company as payment guarantor if required. Approved at the EGM of 30 April 2025; completion announced 24 July 2025.
All crew were safe. The vessels were separated on 16 May 2025, cargo was lightered and the ship was towed to a port of refuge on 4 July 2025 with discharge completed on 31 August 2025. On 11 November 2025 the owning subsidiary signed a settlement with the People's Committee of Ho Chi Minh City for the oil spill, with compensation paid directly by the P&I insurer. The ship left Vietnam on a heavy-lift vessel on 15 January 2026 for repairs at Zhoushan; repairs were completed on 21 April 2026 and it resumed operations on 22 April 2026, the 1H2026 statements referring to it as Uni Phoenix. The FY2025 results recorded the off-hire for most of the year, US$1.8m of insurance receipts and Glengyle-related prepayments and accruals.
Charm Bulkship S.A. (70.2% group, 16.4% Sea Trade and Transport, 13.4% Junkou Tsushou) agreed to buy the 2018 Oshima vessel from Victoria Bulkship S.A. (18% group, 82% Yamasa). The independent valuation was US$19.25m to US$21.25m at 28 March 2025. Funding is 40% equity and shareholder loans and 60% sale-and-leaseback, with the Company as payment guarantor if required. Approved at the EGM of 18 July 2025; completion announced 13 August 2025.
The incident response plan was activated with the vendor. On 5 September 2025 the company said the blocked data included the group's accounting data other than its Japanese subsidiaries', that it had recovered the accounting data from an alternative source, and that the remaining blocked data was not critical to operations. The FY2025 results later said the incident had no material impact on financial position or operations.
The company applied on 24 July 2025 and the waiver was granted on 31 July 2025 subject to disclosure and a written confirmation of no undisclosed material information, both satisfied. On 5 September 2025 the company said it expected to release the statements on or before 30 September 2025.
Profit attributable to owners was US$0.9m. Charter income was US$11.9m: possible charter days fell to 1,243 from 1,521 after vessel sales and actual days to 1,093 on Glengyle's drydock and collision and other drydockings, while the average daily rate edged up to US$10,840 (1H2024: US$10,699). Investment returns were a US$2.6m gain including US$2.2m of valuation gains on 18%-owned ship joint investments being exited in 2H2025, and other income of US$1.0m included insurance recoveries. Operating profit was US$2.0m. Operating cash flow was an outflow of US$3.0m; Kellett Island and drydocks took US$24.1m; borrowings rose US$12.6m to US$54.3m (computed) and cash was US$38.4m; net asset value per share US$1.56. Hong Kong investments are carried at nil. Interim dividend 1.0 cent.
Guidance: No forecast. Charter rates 'expected to remain broadly resilient into FY2026' with volatility; insurance recoveries to partially offset Glengyle losses; minimising off-hire 'critical to profitability'.Next session (29 Sep): CHJ +0.0% · STI +0.1%
Diamond Bulkship S.A. (65.1% group; co-investors 10.0%, 9.9%, 10.0% and 5.0%) agreed to buy the October-2015 Tsuneishi Cebu vessel from Polaris Bulkship S.A. The independent valuation was US$18.25m to US$20.25m at 8 July 2025. Funding is 40% equity (JVCo capital US$8.16m, of which US$5.31m from the group) and 60% sale-and-leaseback, with the Company as payment guarantor if required. The vessel was loss-making in FY2020 and FY2023. Approved at the EGM of 27 November 2025; completion announced 9 December 2025.
Charter income fell 15% to US$27.6m, which the company attributed to the fleet transition (Victoria Harbour, Uni Challenge and Clearwater Bay sold; Kellett Island, Uni Sunshine, Uni Horizon and Trident Star delivered between February and December), Glengyle's off-hire for most of the year and a weaker small-handysize market. Fee income rose 39% to US$5.3m, property sales were US$8.4m, investment returns US$5.9m including US$3.4m realised from ship joint investments, and other income US$1.8m of insurance payouts. Operating profit was US$5.6m; 2H2025 profit attributable to owners was close to nil. Operating cash flow was US$0.2m; capex US$84.6m; non-controlling interests contributed US$8.0m; cash fell US$11.5m to US$34.0m; total assets US$222.1m; net asset value per share US$1.58. Final dividend 1.0 cent.
Guidance: No forecast. Glengyle expected back in service around April 2026, which with the younger fleet 'is expected to support operational normalisation over the next 12 months'; charter-rate volatility persists.Next session (27 Feb): CHJ −1.1% · STI +0.6%
The contract was signed on 2 March 2026 for an eco-engine, dual-fuel-ready vessel. The company said the consideration was in line with historical newbuilding prices for 38,000 to 42,000 dwt vessels between January 2022 and January 2026, that funding would combine internal cash, external debt and other arrangements, and that no definitive financing was in place. The 1H2026 statements carry US$31.4m of vessel capital commitments at 30 June 2026 and a US$1.7m deposit paid; together these imply about US$33.1m for this vessel (computed, not disclosed).
The presentation carries no profit and loss statement. Total assets were US$218.1m. The company attributed the cash improvement to 'a higher proportion of quality vessels'; investing outflow of US$2.1m included the newbuild deposit, and financing outflow of US$3.6m was scheduled repayment. Secured borrowings of US$80.8m stood against US$163.5m of collateral book value, plus US$4.0m unsecured. Glengyle's return on 22 April 2026 and the 2 March newbuild contract were restated. On the Middle East conflict the company said none of its vessels were in or bound for the Persian Gulf, that all charterparties carry the CONWARTIME 2013 clause, and that lubricant suppliers had announced surcharges of about 15%, with overall cost increases 'manageable at this stage'.
The Form 3 records a Singapore-incorporated holder that is not a fund manager, buying on market. Further filings took the deemed interest to 5,270,000 shares, about 6.70% (computed), by 15 July 2026. The 19 May 2026 session was the heaviest-turnover session in the window; the 1Q2026 update was broadcast that evening after the close.
Emerald Bulkship Ltd. (55.6% group; Nippo Shipping, Sea Trade and Transport, Hakuyo Shipping and Pan Asian Marine 11.1% each) agreed to buy the 2016 Shimanami vessel from Quest Bulkship S.A. (18% group, 82% Yamasa). The independent valuation was US$19.95m to US$22.05m at 21 April 2026; the vessel earned US$0.11m in FY2025, US$0.72m in FY2024 and US$0.41m in FY2023 and cost US$24.18m new. Funding is 40% equity (US$8.21m; group share US$5.01m) and 60% (US$12.32m) by a bareboat charter of up to seven years with a Nippo subsidiary, the Company as payment guarantor if required. The announcement describes the group's depreciation method as 20 years; the 1H2026 statements record a change to 25 years from 1 January 2026. Shareholders approved the purchase at the EGM of 14 August 2026.
Same eco-engine, dual-fuel-ready specification as the March order. The company said the consideration was in line with newbuilding prices for 38,000 to 42,000 dwt vessels between January and July 2026, that funding would combine internal cash, external debt and other arrangements, and that no definitive financing had been entered into.
Total income rose 38% to US$25.1m. Revenue-generating hire days rose 40% to 1,508.87 and the average daily charter rate 17% to US$12,690 (1H2025: US$10,881), which the company attributed to the renewed fleet and a stronger Handysize and Supramax market. Fee income rose 47% to US$3.0m on US$1.9m of arrangement fees; investment returns were US$2.6m. Operating profit was US$7.9m and interest expense rose 60% to US$2.0m. The useful-life change, applied from 1 January 2026, reduces the year's depreciation by approximately US$4.1m. Operating cash inflow was US$4.4m; borrowings fell US$4.9m to US$82.6m (computed); cash was US$28.5m; net asset value per share, including non-controlling interests, US$1.64. Vessel capital commitments were US$31.4m. Interim dividend 1.0 cent, ex-date 15 September 2026. Shareholders approved the Uni Harmony purchase at an EGM the same day.
Guidance: No forecast. The market 'entered 2H2026 on a relatively firm footing'; 2026 fleet growth of about 4% expected to be broadly balanced by tonne-mile demand growth of 3.5% to 4%; for 2027 'some risk of market softening' as fleet growth of about 4% may exceed demand growth of about 2%.Next session (17 Aug): CHJ +0.0% · STI +0.4%
Iwabuchi, with the group since 1997 and CEO since 29 February 2024, retires as CEO and executive director when his service agreement expires on 28 February 2027. Ishizaki joined in 2016 and, the board said, led the fleet renewal programme and the two newbuilding contracts.
Next session (17 Aug): CHJ +0.0% · STI +0.4%
Notes and sources
Share price record
How this section was built
The detector flagged 18 large moves in the window — 12 single sessions and 6 weekly windows — before any news was read. 1 market move; 17 are left over after the control, unexplained by them. Of those, 5 coincided with one in the same session or week and 12 have nothing filed against them beyond routine notices and are recorded as unexplained rather than explained away.
Detection ran before any news was read, on the dividend-adjusted close, against the Straits Times Index as a market control. A session qualifies when the move clears both an absolute floor and a multiple of its own trailing volatility; the largest moves are added regardless so none is quietly dropped. Only then was the announcement tape read.
The tape is enumerated, not sampled: every one of the 125 announcements the listed parent published between 2023-08-22 and 2026-08-21, with each item's SGX Date and Time of Broadcast read from its own announcement page. That timestamp matters here. The SGX securities market closes at 17:00, and every quarterly corporate update in the record was broadcast after the close — 17:05, 17:21, 17:03 and 17:16 — as were the FY2024 results at 19:11 and the delayed 1H2025 results at 17:02. A release stamped after 17:00 cannot have moved that session's close, so same-day attribution would be wrong on every one of them.
Scope: this is the listed parent's announcement tape. Uni-Asia Shipping, Uni-Asia Capital (Japan) and the historical Uni-Asia Holdings streams file separately, those windows are not closed here, and no whole-group completeness is claimed. A move called unexplained means nothing in the parent's tape explains it.
How to read the tags.Market-wide and Sector-wide mean the index or the peer median moved with the share over the same session or week; Residual means the move is still large after both are subtracted. A residual is what is left over, not a cause: it does not establish that the company’s own news moved the price, and an unchanged or thinly traded price is not proof that no information arrived. Returns use the dividend-adjusted close; a filing released after the open is read against the next session.
Closing prices from a market-data vendor for CHJ.SI (755 sessions, 22 Aug 2023 to 21 Aug 2026); returns on the dividend-adjusted close; the Straits Times Index is the market control and no listed peer set is used. The announcement tape is every item the listed parent published on its investor-relations mirror in that window, 125 items, each with its SGX date and time of broadcast read from its own announcement page. A filing after 09:00 is read against the next session.
Returns are computed on the dividend-adjusted close; the price column in the chart is the unadjusted close. “Coincides with” is not “caused by”: where a release was broadcast after the close it is recorded as coinciding, and no causal wording is used. Moves left unexplained are reported rather than dropped.
The heaviest session in the three years was 19 May 2026, when the shares rose 8.05% on 756,800 shares, about thirty-two times the median. A Form 3 notification filed the next evening records that Asparta Pte. Ltd. bought 672,900 of them — roughly 89% of the session — for S$618,549.86, crossing the 5% substantial-shareholder threshold. It kept buying: 5,270,000 shares, or 6.70%, by 15 July 2026, 1,340,500 shares in total for about S$1.24m. The 1Q2026 corporate update was broadcast that same evening at 17:16, after the close.
A quarter shows only the columns it has. An empty developments column means: No filings beyond routine disclosures this quarter. An empty moves column means: No session cleared the large-move threshold this quarter.
The full move register — every large move and its market and sector controls
#
Session
CHJ
STI
Peers
Left over
Control result
What the evidence supports
1
22 Nov 2023
+4.5%
+0.6%
n/a
+3.9%
Residual
The session coincided with the 3Q2023 corporate update, which SGX broadcast at 17:05 SGT, after the 17:00 close. Turnover was about nine times the median.
2
28 Nov 2023
+4.4%
−0.7%
n/a
+5.1%
Residual
No announcement anywhere in the enumerated tape covers this session, and turnover was below the median.
3
1 Feb 2024
−4.3%
−0.3%
n/a
−4.0%
Residual
No announcement anywhere in the enumerated tape covers this session.
4
week to 23 Feb 2024
−6.7%
−1.1%
n/a
−5.5%
Residual
No announcement anywhere in the enumerated tape covers this week.
5
21 Mar 2024
+4.2%
+1.4%
n/a
+2.8%
Residual
No announcement anywhere in the enumerated tape covers this session; turnover was about a third of the median.
6
22 Aug 2024
+13.3%
−0.0%
n/a
+13.3%
Residual
The largest single-session move in the window has no announcement in the enumerated tape. The nearest issuer release, the 1H2024 results, was six sessions earlier.
7
23 Aug 2024
−4.3%
+0.4%
n/a
−4.8%
Residual
The partial reversal of the preceding session also has no announcement in the enumerated tape.
8
week to 23 Aug 2024
+12.3%
+1.1%
n/a
+11.3%
Residual
The week's move has no announcement inside it; the 1H2024 results fell before the window opened.
9
14 Nov 2024
+4.6%
+0.5%
n/a
+4.2%
Residual
No announcement covers this session. Turnover was about fifteen times the median, and the 3Q2024 corporate update did not reach the tape until eight days later.
10
week to 7 Mar 2025
+6.9%
+0.5%
n/a
+6.5%
Residual
The week contained the FY2024 results and a slate of board, chairman and chief-financial-officer changes, all broadcast after the close on 28 February 2025.
11
7 Apr 2025
−5.0%
−7.5%
n/a
+2.5%
Market-wide
The Straits Times Index fell 7.46% in the same session while the stock fell 5.00%, so the stock outperformed the market that day.
12
week to 3 Oct 2025
+6.9%
+3.4%
n/a
+3.5%
Residual
The week contained the 1H2025 results and the dividend book-closure notice, both broadcast after the close on 26 September 2025. These were the accounts delayed by the July 2025 cybersecurity incident.
13
6 Oct 2025
+5.3%
+0.2%
n/a
+5.1%
Residual
No announcement covers this session, which fell in the week after the delayed 1H2025 results. Turnover was about fourteen times the median.
14
21 Oct 2025
+9.0%
+1.2%
n/a
+7.8%
Residual
No announcement covers this session. Turnover was about eleven times the median.
15
week to 24 Oct 2025
+9.0%
+2.1%
n/a
+6.9%
Residual
The week's move has no announcement in the enumerated tape.
16
7 Jan 2026
+6.4%
+0.2%
n/a
+6.2%
Residual
Against an index move of +0.2%, about 6 points are left over; 5.2× median volume. No filing beyond routine notices in the window.
17
19 May 2026
+8.1%
+1.5%
n/a
+6.5%
Residual
The heaviest turnover session in the window, about thirty-two times the median. Asparta Pte. Ltd. bought 672,900 shares that day, roughly 89% of the session's 756,800 shares, crossing the 5% substantial-shareholder threshold; the Form 3 reached the tape the following evening. The 1Q2026 corporate update was broadcast at 17:16 SGT, after the 17:00 close.
18
week to 22 May 2026
+6.9%
+1.6%
n/a
+5.3%
Residual
The week contained two disclosed Asparta Pte. Ltd. purchases totalling 987,700 shares and the 1Q2026 corporate update, which was broadcast after the close on 19 May 2026.
Key developments: sources, timing and notes
14 Aug 2023 · 1H2023 results: total income down 39% to US$29.7m and net profit after tax down 74% to US$4.3m as charter rates normalised from 2022.ResultsFiled before the price window opens on 22 Aug 2023; no reaction session is computed.Source: SGX announcement, 14 Aug 2023
22 Nov 2023 · 3Q2023 corporate update: nine-month operating cash flow of US$9.8m against US$28.0m a year earlier; cash US$27.9m and borrowings US$60.6m at 30 September 2023.Corporate updateReaction (next session, 23 Nov): CHJ +1.6% · STI −0.1% · 4.9× median volumeSource: SGX announcement, 22 Nov 2023 (released 17:05, after the close)
29 Feb 2024 · FY2023 results: total income down 33% to US$58.0m and net profit after tax down 82% to US$5.1m; dividend cut to 4.4 Singapore cents from 14.5.ResultsReaction (next session, 1 Mar): CHJ −3.0% · STI −0.2% · 16.0× median volumeSource: SGX announcement, 29 Feb 2024 (released 17:50, after the close)
16 May 2024 · 1Q2024 corporate update: cash US$38.4m against borrowings US$53.0m, and a first warning that Hong Kong property fair-valuation losses may be booked in 1H2024.Corporate updateReaction (next session, 17 May): CHJ −1.6% · STI +0.3% · 1.3× median volumeSource: SGX announcement, 16 May 2024 (released 17:21, after the close)
31 Jul 2024 · Profit guidance: a net loss expected for 1H2024, against a profit a year earlier, on fair-valuation losses for the Hong Kong property project investments.Corporate updateReaction (next session, 1 Aug): CHJ −1.3% · STI −1.0% · 6.3× median volumeSource: SGX announcement, 31 Jul 2024 (released 20:55, after the close)
14 Aug 2024 · 1H2024 results: net loss of US$11.7m after a US$12.8m Hong Kong fair-valuation loss; total income down 62% to US$11.2m.ResultsReaction (next session, 15 Aug): CHJ −1.4% · STI +0.9% · 5.7× median volumeSource: SGX announcement, 14 Aug 2024 (released 17:16, after the close)
22 Nov 2024 · 3Q2024 corporate update: nine-month operating cash inflow of US$16.8m against US$9.8m; cash US$41.6m against borrowings US$47.7m; further Hong Kong valuation losses flagged for 2H2024.Corporate updateReaction (next session, 25 Nov): CHJ +0.0% · STI −0.4% · 0.8× median volumeSource: SGX announcement, 22 Nov 2024 (released 17:03, after the close)
17 Dec 2024 · Proposed acquisition of the 57,836 dwt Supramax Kellett Island for US$22.70m through a 75%-owned vehicle, an interested-person transaction with the controlling shareholder's 82%-owned SPV.Corporate actionReaction (same session): CHJ +0.0% · STI −0.6% · 2.6× median volumeSource: SGX announcement, 17 Dec 2024 (released 00:11, before the open) · Completion, 25 Feb 2025
13 Feb 2025 · Update on Hong Kong property investments: the group 'may not be able to recover all or any of its capital' and may book further fair-valuation losses in 2H2024.Corporate updateReaction (next session, 14 Feb): CHJ −1.3% · STI −0.1% · 2.9× median volumeSource: SGX announcement, 13 Feb 2025 (released 17:27, after the close)
21 Feb 2025 · Profit guidance: a net loss expected for FY2024, against a profit in FY2023, on the Hong Kong fair-valuation losses; results set for 28 February 2025 after trading hours.Corporate updateReaction (next session, 24 Feb): CHJ −0.7% · STI −0.1% · 3.6× median volumeSource: SGX announcement, 21 Feb 2025 (released 17:12, after the close)
3 Apr 2025 · Proposed acquisition of the 36,880 dwt Handysize Uni Sunshine for US$20.86m through a 72.7%-owned vehicle, the second purchase from a Yamasa-controlled SPV.Corporate actionReaction (next session, 4 Apr): CHJ +0.6% · STI −3.0% · 15.5× median volumeSource: SGX announcement, 3 Apr 2025 (released 21:11, after the close) · Completion, 24 Jul 2025
27 Apr 2025 · Glengyle incident: the wholly-owned 37,679 dwt bulker collided with the container ship KMTC Surabaya approaching Ho Chi Minh Port on 25 April 2025, with hull damage to two holds and fuel oil lost overboard.AnnouncementReaction (next session, 28 Apr): CHJ +0.0% · STI −0.3%Source: SGX announcement, 27 Apr 2025 (Sunday) · Settlement update, 12 Nov 2025 · Final update, 22 Apr 2026
23 Jun 2025 · Proposed acquisition of the 36,861 dwt Handysize Uni Horizon for US$20.33m through a 70.2%-owned vehicle, the third purchase from a Yamasa-controlled SPV.Corporate actionReaction (same session): CHJ −0.6% · STI −0.1% · 0.9× median volumeSource: SGX announcement, 23 Jun 2025 (released 08:42, before the open) · Completion, 13 Aug 2025
14 Jul 2025 · Cybersecurity incident: an outsourced server of a group member was hacked and its data made inaccessible; the company could not yet assess the business impact.AnnouncementReaction (next session, 15 Jul): CHJ −1.2% · STI +0.3% · 1.0× median volumeSource: SGX announcement, 14 Jul 2025 (released 19:36, after the close) · Update, 5 Sep 2025
1 Aug 2025 · SGX RegCo granted an extension to 12 November 2025 for the 1H2025 financial statements, due by 14 August 2025, because accounting data was locked by the cyber incident.AnnouncementReaction (next session, 4 Aug): CHJ −0.6% · STI +1.0% · 1.0× median volumeSource: SGX announcement, 1 Aug 2025 (released 18:08, after the close)
26 Sep 2025 · 1H2025 results, six weeks late: net profit of US$0.6m against a US$11.7m loss, on total income up 63% to US$18.2m; charter income down 25% with 12% off-hire.ResultsReaction (next session, 29 Sep): CHJ +0.0% · STI +0.1% · 3.2× median volumeSource: SGX announcement, 26 Sep 2025 (released 17:02, after the close)
7 Nov 2025 · Proposed acquisition of the 57,836 dwt Supramax Trident Star for US$18.40m through a 65.1%-owned vehicle with four co-investors, the fourth purchase from a Yamasa-controlled SPV.Corporate actionReaction (next session, 10 Nov): CHJ +0.0% · STI −0.1% · 4.9× median volumeSource: SGX announcement, 7 Nov 2025 (released 17:51, after the close) · Completion, 9 Dec 2025
26 Feb 2026 · FY2025 results: profit attributable to owners of US$0.9m after the US$28.3m FY2024 loss; total income up 108% to US$49.9m; borrowings up US$45.8m to US$87.4m for four vessel purchases; dividend 2.0 Singapore cents.ResultsReaction (next session, 27 Feb): CHJ −1.1% · STI +0.6% · 10.7× median volumeSource: SGX announcement, 26 Feb 2026 (released 17:09, after the close)
4 Mar 2026 · First newbuild order in over a decade: one 40,000 dwt double-hull bulk carrier from Nihon Shipyard, built by Imabari at Shimanami, for delivery in 2H2028; price undisclosed.Fleet / capacityReaction (next session, 5 Mar): CHJ +0.6% · STI +0.7% · 0.1× median volumeSource: SGX announcement, 4 Mar 2026 (released 17:13, after the close)
19 May 2026 · 1Q2026 corporate update: first-quarter operating cash inflow of US$4.5m against an outflow of US$2.7m a year earlier; cash US$32.6m against borrowings US$84.8m; all nine vessels earning from 22 April 2026.Corporate updateReaction (next session, 20 May): CHJ −1.6% · STI −0.5% · 0.5× median volumeSource: SGX announcement, 19 May 2026 (released 17:16, after the close)
20 May 2026 · Substantial shareholder filing: Asparta Pte. Ltd. bought 672,900 shares on 19 May 2026 for S$618,549.86, taking it from 4.999% to about 5.86% (computed).AnnouncementSource: Form 3, 20 May 2026 · Form 3, 16 Jul 2026
29 Jul 2026 · Proposed acquisition of the 37,655 dwt Handysize Uni Harmony for US$20.53m through a 55.6%-owned vehicle with four co-investors, the fifth purchase from a Yamasa-controlled SPV.Corporate actionReaction (next session, 30 Jul): CHJ −0.6% · STI −0.7% · 0.8× median volumeSource: SGX announcement, 29 Jul 2026 (released 18:01, after the close) · Results of EGM, 14 Aug 2026
6 Aug 2026 · Second newbuild order: another 40,000 dwt double-hull bulk carrier from Nihon Shipyard, built at Imabari, for delivery between 4Q2029 and 1H2030; price undisclosed.Fleet / capacityReaction (next session, 7 Aug): CHJ +1.1% · STI +1.1% · 2.2× median volumeSource: SGX announcement, 6 Aug 2026 (released 18:12, after the close)
14 Aug 2026 · 1H2026 results: profit attributable to owners of US$5.2m against US$0.9m, on charter income up 60% to US$19.1m; vessel useful lives extended from 20 to 25 years, worth about US$4.1m of depreciation a year.ResultsReaction (next session, 17 Aug): CHJ +0.0% · STI +0.4% · 8.6× median volumeSource: SGX announcement, 14 Aug 2026 (released 17:59, after the close)
Neutral questions arising from gaps in the public filings. Each is answerable from disclosure the company already prepares. None implies a view on value.
Uni-Asia has ordered two newbuilds with roughly US$66m of implied cost, and both announcements state that no definitive financing has been arranged. What are the facility terms, and does the listed parent carry recourse or guarantees on them?
The group discloses fleet-wide hire days and an average daily rate each half, but not the charter type, rate or expiry of any individual vessel, and only one vessel appraisal is public. Will the fleet table carry a per-vessel charter and valuation ladder?
The ex-Japan property segment reports about US$1.5m of assets against about US$9.3m of liabilities. How much of that liability is owed outside the group?
Vessel useful lives were extended from 20 to 25 years with effect from 1 January 2026, worth about US$4.1m a year of pre-tax profit. Were residual values reassessed at the same time, and on what evidence?
The group publishes voluntary quarterly corporate updates carrying revenue-generating hire days and the average daily charter rate, alongside half-yearly statutory reporting. Is the quarterly update a continuing commitment, and will those two operating metrics remain in it?
What you can watch yourself
Every other test on this page waits for the company to file. These do not. Each row is a series you can look up yourself, free, today — with the level this reading was built against, the levels that would put it in question, and what the series cannot tell you.
The daily Baltic report; read the handysize line, both the index points and the average daily earnings figure. Baltic Exchange, reported daily by HandyBulk
Last recorded
17,876 US$/day, 2026-09-21
What the reading assumes
11,010 US$/day (market handysize time-charter-equivalent average for the half, 1H2025)
Watch / alert
11,010 and 9,000 US$/day, on a move below — currently at or better than the level the reading assumed
How often to look
monthly (the series prints daily)
What it points to. Vessels coming off charter are refixed into this market, so it points to the rate on the next fixture, not the current one.
Direction only — this pack does not carry a coefficient from this series to reported earnings.
What it cannot tell you. This is a spot assessment for prompt fixtures, and the fleet is not on spot. The index leads realised revenue by roughly the remaining charter cover, which the company discloses only periodically — so a move here describes future fixtures, never the current half's revenue. It also says nothing about the property and fee lane, which carries a large share of the group's capital.
Settled by the next results and charter-coverage disclosure, due 2027-02-28. Lead time: the length of the remaining charter cover on each vessel.
Hong Kong and Japan property — nothing public to watch
Searched the Hong Kong Rating and Valuation Department's indices, the Japanese land ministry's series and the listed developer peers for a series at this segment's perimeter. The exposure is a handful of named small residential projects held through joint ventures, and a territory-wide index does not describe a portfolio that small; the first honest observable is the project-by-project disclosure at results.
Watchlist reviewed on 2026-09-23; each observation has its own date above. This watchlist date does not change the company research cutoff. A series moving past a level is a reason to re-read the case, not a recommendation. The same series across every company covered: what you can watch.
Notes and sources
What the filings do not answer
Which vessels are on period charters, to whom, at what rate, and until when? The group discloses an average daily rate and aggregate charter coverage, but no complete vessel-by-vessel counterparty, rate and expiry ladder. The 1H2026 presentation shows four of nine charters extending beyond December 2026, three beyond June 2027 and none beyond December 2027. In 1H2026, US$10.1m of income — 40% of the total — came from customers each representing 10% or more of income, and none is named.
What are the two newbuilds costing, and how will they be financed? Neither announcement disclosed a price, and both state that no definitive financing had been arranged. Vessel capital commitments of US$31.445m at 30 June 2026 plus the US$1.655m deposit paid imply roughly US$33.1m for the first — but that is a computation from the commitments note, not a disclosure.
What does the ex-Japan property segment's remaining US$9.3m of segment liabilities consist of? It stands against US$1.5m of segment assets after the FY2024 write-down. Segment liabilities include intra-group funding, so this is probably internal — but the composition is not disclosed at segment level.
Why did the useful-life revision take effect in FY2026 rather than earlier or later? The stated reasons are all verifiable and defensible. The question is one of timing, and no public document addresses it.
Who is behind Asparta Pte. Ltd.? The Form 3 notifications record a Singapore-incorporated holder that is not a fund manager, and nothing further. A holder that has bought 1.7% of the company on-market in two months, at prices around the current level, is the most consequential unknown on the register.
Download
A print-ready PDF of this page, for reading away from the screen: Uni-Asia Group evidence library (PDF). It carries the same content as this page — as-filed history, segment economics, fleet, governance and open questions — and the same omissions: no rating, no fair value, no forecast.
From primary documents only: all nineteen annual reports since the 2007 listing, the IPO prospectus, the results announcements for FY2024, 1H2025, FY2025 and 1H2026, the four vessel-acquisition announcements and the Uni Harmony announcement with its independent valuation certificate, its 28 August 2026 EGM minutes and written answers, both newbuild announcements, the Hong Kong property update and FY2024 profit guidance, the CEO succession announcement, the issuer's dividend history, and the Statistics of Shareholdings in the FY2025 annual report. The CHJ listed-parent announcement index — 813 items from 2007 to 2026 — was indexed from the issuer's investor-relations mirror. Uni-Asia Shipping, Uni-Asia Capital (Japan) and the historical Uni-Asia Holdings issuer have separate disclosure routes; this page does not claim whole-group tape completeness.
Every figure was keyed by hand from the filing and then reconciled: the balance sheet balances in each year shown, segment rows sum to group totals in every period, the halves sum to the full years, and every reported balance, segment total and half-year/full-year bridge used on this page was independently re-keyed. Where a figure is computed rather than reported, the computation is stated next to it.
What this page deliberately omits: any rating, fair value, target price, price-to-book comparison, forecast, scenario or view on the share price. Those exist in the private working files and are not published.
Corrections log
21 August 2026 — price-driver history added. The page gains a three-year record of what has actually moved the shares, built by detecting the moves before reading any news and then reading every announcement the listed parent published in that window, with each item's SGX broadcast timestamp. That enumeration covers the listed parent's own tape; the separate UAS, UACJ and historical UAHL disclosure streams remain gapped and are not claimed. 12 of 18 detected moves have no announcement behind them. Two figures used earlier in this project were corrected in the same pass: an internal count of unexplained moves said 13 where the register says 12 plus one index move, and an internal question asked whether the group would consider quarterly operating updates when it already publishes them voluntarily. An original illustration of the vessel class was also added, drawn from a written brief rather than from issuer artwork.
20 August 2026 — KPI provenance correction. Appendix 7.2 of the 1H2026 statements reports 1,508.87 revenue-generating hire days and an average daily charter rate of US$12,690. An interim revision incorrectly said those historical KPIs were not numerically disclosed. The page now distinguishes the reported historical values from undisclosed utilisation and analyst forward assumptions.
17 August 2026 — revision after an independent blind audit. The research behind this page was audited by an independent reviewer working from the primary filings, which returned 32 findings, 8 at severity 1. Six of those bear on this page and are now corrected here: the cumulative ship-owning segment figure was restated from +US$47.1m/−US$1.6m to +US$45.3m/−US$3.3m once the FY2020 segment redefinition is respected; the maritime-asset-management framing now carries management’s own statement that the income is largely non-recurring; the FY2024 write-down is quoted gross at US$31.5m on commercial office and industrial buildings rather than only net; the Uni Harmony US$12.32m payment guarantee is added; the two defeated AGM mandates and the auditor change are added; and the Uni Harmony price is described as sitting in the lower half of its valuation range rather than “near the midpoint”. A statement that the group reports only semi-annually was also wrong — it publishes voluntary quarterly corporate updates.
17 August 2026 — first publication. Two definitional points worth flagging, because both are easy to get wrong from the filings alone. (1) Net asset value per share: the issuer's stated US$1.64 at 30 June 2026 is total equity including non-controlling interests divided by shares. NAV attributable to owners is US$1.517. The gap is 7.9% and widening as co-investor minorities grow. (2) Total income is not revenue: the top line aggregates charter income, fees, property sales, investment returns (including unrealised fair-value movements), interest and other income. Revenue from contracts with customers was US$11.0m of the US$25.1m of 1H2026 total income.
Uni-Asia Group Limited is covered here as a factual evidence library. Figures are as filed by the issuer or computed from filings, with the computation shown. This page is not investment advice, not a recommendation, and carries no view on the value of the shares. Information through 28 August 2026.
Reader questions & corrections
Ask about this company, challenge a source or suggest a factual correction. Only selected questions that SMID Research has reviewed and answered are published.
Submissions are private by default. Your email is encrypted and never published. Please do not send confidential or inside information, allegations about individuals, promotions, or requests for personalised investment advice.
Behind the lock
A complete private working view of this company exists beyond this page: the full initiation note as a PDF, the financial model workbook with live formulas, the presentation deck, scenario and valuation work, and the independent-review artifacts. It is maintained in the author's vault for the author's own records — not published, and not available for sharing. This page carries everything that is public.
These bounded retrospective corrections clarify specific published facts or calculations. They retain each report's existing research cutoff and do not represent a full refresh or a finding that all possible issues are resolved.
Uni-Asia Group
Internal Inconsistency. The stated Uni Harmony purchase price is inside the lower half of the disclosed range. Follow-up, 10 September 2026: the recovered 17 August register accounts for all 32 findings as 23 marked fixed, eight acknowledged and one explicitly unresolved; the earlier total of 31 omitted the unresolved entry. Source basis: existing published purchase-price inputs and the recovered 17 August disposition register. Limitation: This reconciles the historical count only. F2-09 remained unresolved in that record, and its severity-3 prose conflicts with its individual entries; no complete verification or current certification is claimed.
Transcripts
Find available event transcripts in the transcript library.