Well Chip lends against gold through 27 Malaysian pawnshops and sells forfeited pledges, so growth expands the loan book before interest and recoveries return cash.
Latest figures
FY2025 profit after tax was RM86.1m, but operating cash flow was negative RM165.1m as receivables increased by about RM262m, making external funding central to expansion.
Main risk
The central risk is that pledge-book growth and funding needs outrun collateral liquidity or recovery values.
Next proof
The next test is the next filing's receivable ageing, funding proceeds, cash conversion and realised collateral recovery.
Information cut-off 25 August 2026. The latest reported period is the six months to 30 June 2026 (2Q2026 interim), announced 14 August 2026. Every figure below is reported in a primary filing or transparently computed from filed inputs and is marked as such.
Evidence balance
The live questionAs the pledge book grows, does interest collected on redemption and auction recovery return cash fast enough to fund lending now carried on revolving credit?In the six months to 30 June 2026, the latest reported period, the lending side carried the result while the borrowing that funds the pledge book rose almost entirely in revolving credit.
What improved
Growth came from the lending side: in 1H FY2026 pawnbroking external revenue rose 49.4% and pawnbroking segment gross profit rose 44.8%, lifting group revenue 17.3% and group gross profit 34.0% against the same half of the prior year.
What became more demanding
Funding the book got heavier: trade and other receivables rose RM130.1m over the same six months, and at 30 June 2026 bank borrowings stood at RM481.7m, of which 97.5% was revolving credit secured by a debenture over fixed and floating assets.
Strongest alternative explanation
Book growth can consume cash without proving deteriorating earnings. FY2025 CFO was negative RM165.1m versus RM86.1m profit. Receivables used RM262.0m of cash; other items also explain the RM251.2m profit-to-CFO difference. These figures do not establish whether accrued interest and collateral recoveries will convert into cash.
The decisive missing fact
The 2024 prospectus disclosed RM225.00m of total facilities, RM31.72m unutilised and lender-specific dividend restrictions. Those historical disclosures do not establish the limits, tenor, review dates or committed portion of the enlarged 2026 revolving-credit position; the realised average advance rate against appraised value and default rate on pawn loans remain undisclosed.
Drawn from the evidence on this page: the improvement, the constraint, the benign reading and the fact that would settle it. It states no view on the shares.
About the private research record
Also on file behind the Rated view 🔒 (author-only): the private equity call, valuation outputs, the initiation note, the source register, model outputs, the credit rating register and evidence-request pack, and the equity and credit verification reports. No rating, valuation or forecast is reproduced on this public page.
Well Chip advances against gold borrowers intend to reclaim, then sells gold that is not reclaimed or that the group buys into inventory.
Follow the operating chain from demand or inputs to customer outcome and cash.
Customer needPawn counter
Appraise the gold
What happensA borrower pledges gold; Well Chip tests and values it before advancing cash against the collateral.
Commercial triggerBank revolving credit helps fund the pawn advances.
Revenue engineLoan period
Hold it in the vault
What happensThe pledged gold remains secured while monthly interest accrues and the borrower chooses to redeem or renew.
How it earnsInterest is collected on redemption or renewal.
Capital recoveryIf unredeemed
Recover through the gold flow
What happensAn unredeemed pledge follows the auction process; eligible bought-in gold then enters the trading inventory.
Recovery driverRecovery depends on auction and realised gold value.
Route to marketGold trading
Test, sort and resell
What happensGold is reconditioned for the retail counter or sold by weight to a trading house.
Revenue triggerJewellery buyers and gold counterparties pay for the recovered or purchased stock.
Original SMID Research comic. AI-assisted, analyst-directed monochrome artwork depicts the evidenced operating steps of Well Chip Group; deterministic captions and dated mix figures state the economics using issuer disclosures available to 2026-08-25. The drawings are representative—not issuer artwork, an exact product or site design, a statement of scale, or a company forecast.
Investor translation
What matters after the operating picture
Four questions connect the business model to cash and balance-sheet risk. This is a factual reading aid, not a valuation or recommendation.
Value lever
Pawn-book yield, collateral turnover and return on equity after funding and credit losses.
Cash bottleneck
New pawn advances absorb cash before redemption, auction or collateral sale.
Balance-sheet pressure
Borrowing-base capacity and collections no longer cover secured facilities and operating cash needs.
Next proof
Loan-cohort collections, collateral haircuts, credit losses and committed-facility headroom.
Text version of this comic
Customer need · Appraise the gold A borrower pledges gold; Well Chip tests and values it before advancing cash against the collateral. Commercial trigger: Bank revolving credit helps fund the pawn advances.
Revenue engine · Hold it in the vault The pledged gold remains secured while monthly interest accrues and the borrower chooses to redeem or renew. How it earns: Interest is collected on redemption or renewal.
Capital recovery · Recover through the gold flow An unredeemed pledge follows the auction process; eligible bought-in gold then enters the trading inventory. Recovery driver: Recovery depends on auction and realised gold value.
Route to market · Test, sort and resell Gold is reconditioned for the retail counter or sold by weight to a trading house. Revenue trigger: Jewellery buyers and gold counterparties pay for the recovered or purchased stock.
What the company does
Well Chip lends cash against gold. A customer brings gold jewellery to one of 27 pawnshops in Johor and Perak and receives an advance of up to 95% of its appraised market value, priced off net gold weight and the spot gold price. Interest of 1% to 2% a month accrues on the outstanding loan, which runs for six months with a grace period of up to three further months. A customer who redeems takes the gold back. A customer who does not forfeits it: the pledge goes to a licensed monthly auction, the group generally bids for it, and it is then sorted and sold — mostly as scrap gold, by weight, to gold trading houses.
Pawnbroking in Malaysia is licensed by the Ministry of Housing and Local Government under the Pawnbrokers Act 1972. Each outlet needs its own licence, and each licence-holding subsidiary needs RM4.0m of paid-up capital.
The number that reframes the accounts
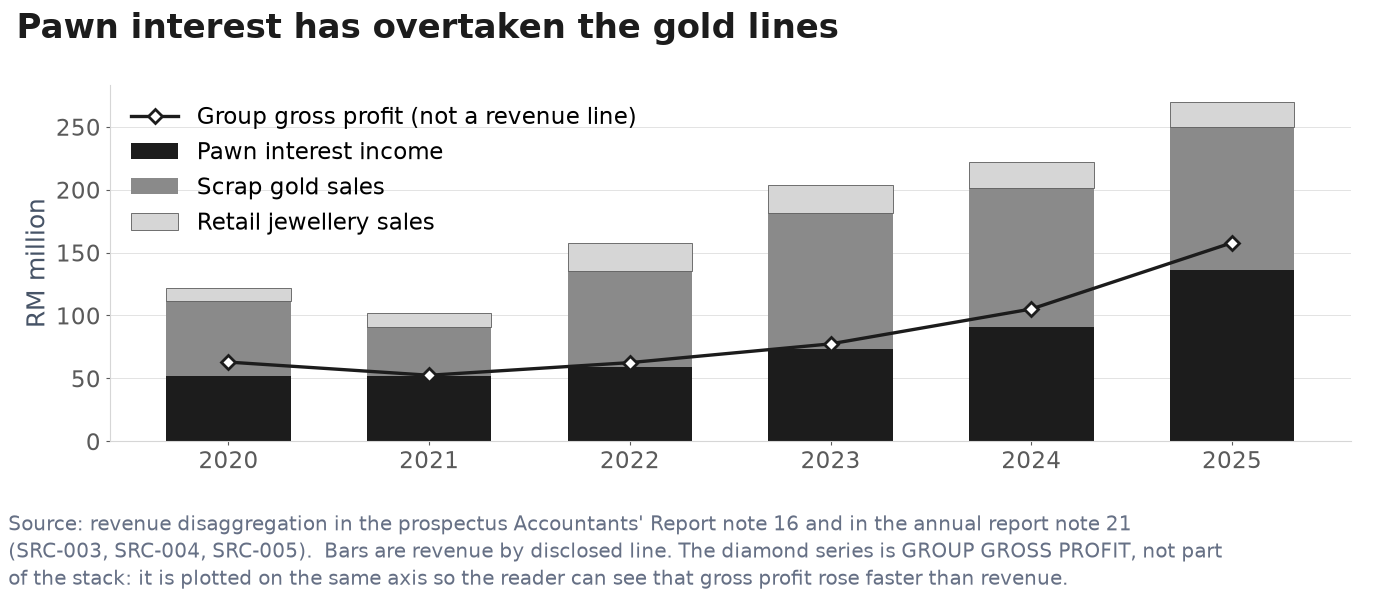
The group reports two segments of similar size. In FY2025, pawnbroking produced RM136.4m of external revenue and the “retail and trading of jewellery and gold” segment produced RM133.8m.
The disaggregation note shows what the second segment is made of. RM113.9m of it — 85.1% — was scrap gold sold by weight to traders. Retail sales of jewellery were RM19.9m, and they were RM20.4m in FY2024 and RM21.5m in FY2023. The gross profit split is starker still: pawnbroking RM119.5m, jewellery and gold RM38.3m.
Where the “pledge book” figure comes from: the RM798.0m at FY2025 year end is the audited gross pledged receivables (SRC-005 note 12). The RM961.209m at 30 June 2026 quoted throughout this page is the reported trade-and-other-receivables line (SRC-030 statement of financial position p2); the interim report does not disaggregate that line. The page’s estimate of pledged receivables plus accrued interest at 30 June 2026 is approximately RM957.364m (RM961.209m × 99.6%), using the rounded FY2025 pledged-vs-other composition (99.6%/0.4%). This is a composition-based estimate, not a disclosed June pledged-loan balance; the rounded historical proportion does not establish the actual interim mix.
How much of the segment is recovered collateral is only partly disclosed. The segment note reports an inter-segment transfer of unredeemed and bid pledges from pawnbroking of RM85.3m in FY2025, 63.8% of the segment’s external revenue, against RM90.0m in FY2024 and RM37.1m in the first half of 2026. The business description also says the segment buys gold from walk-in sellers and new stock from wholesalers. The split of its external sales between those sources is not disclosed.
Pawn interest has overtaken the gold lines — RM million. The three stacked columns are the material revenue lines; group gross profit is plotted as a separate line on the same axis and is not part of the stack. Source: revenue disaggregation in the prospectus Accountants’ Report note 16 and in the annual report note 21 (SRC-003, SRC-004, SRC-005).
FY2025 segment and revenue-line economics, RM million
Line
External revenue
Gross profit
Gross margin
Reading
Pawnbroking
136.4
119.5
87.6%
Margin is after bank interest charged to segment cost of sales
Jewellery and gold
133.8
38.3
28.7%
Includes scrap-gold and retail-jewellery sales
— scrap gold
113.9
Not separately reported
Not separately reported
85.1% of segment external revenue
— retail jewellery
19.9
Not separately reported
Not separately reported
7.4% of group revenue
Inter-segment pledge transfer
85.3
Eliminated on consolidation
—
Unredeemed and bid pledges moved into the gold segment
The pawnbroking margin looks unusually high because its funding expense sits inside cost of sales. The gold segment is the recovery and resale channel: its reported revenue is substantial, but a large part recycles collateral that originated in the lending book. Reading segment revenue without the inter-segment transfer can make the group look more diversified than its economics are.
As filed
Reported financial history and pledge-book aggregates, RM million except percentages
Period
FY2021
FY2022
FY2023
FY2024
FY2025
Revenue
101.9
158.1
203.7
222.1
270.2
— of which pawn interest
51.6
59.3
73.0
90.5
136.0
— of which scrap gold
39.0
75.9
108.9
111.0
113.9
— of which retail jewellery
11.1
22.7
21.5
20.4
19.9
Gross profit
52.5
62.5
77.4
105.2
157.9
Profit before tax
32.7
36.8
50.0
71.1
120.3
Net profit
24.0
26.4
36.4
50.0
86.1
Pledged receivables
249.4
325.9
399.3
506.9
798.0
Pawn loans disbursed
532
710
991
1,362
2,309
Pawnshops
17
19
22
23
27
Book yield (%)
20.10
19.76
19.31
19.20
20.09
Cost of debt (%)
n.a.
n.a.
n.a.
5.56
4.85
Bank borrowings
89.1
146.9
192.5
182.0
395.9
Related-party debt
85.7
95.7
75.7
51.7
47.8
Gearing, issuer definition (x)
1.16
1.41
1.32
0.56
0.92
Gearing, bank debt only (x)
0.59
0.86
0.95
0.43
0.82
Return on equity (%)
17.0
16.4
19.4
16.0
19.0
Operating cash flow
n.a.
n.a.
n.a.
(47.4)
(165.1)
Dividend payout (%)
22.7
19.3
13.3
48.0
35.5
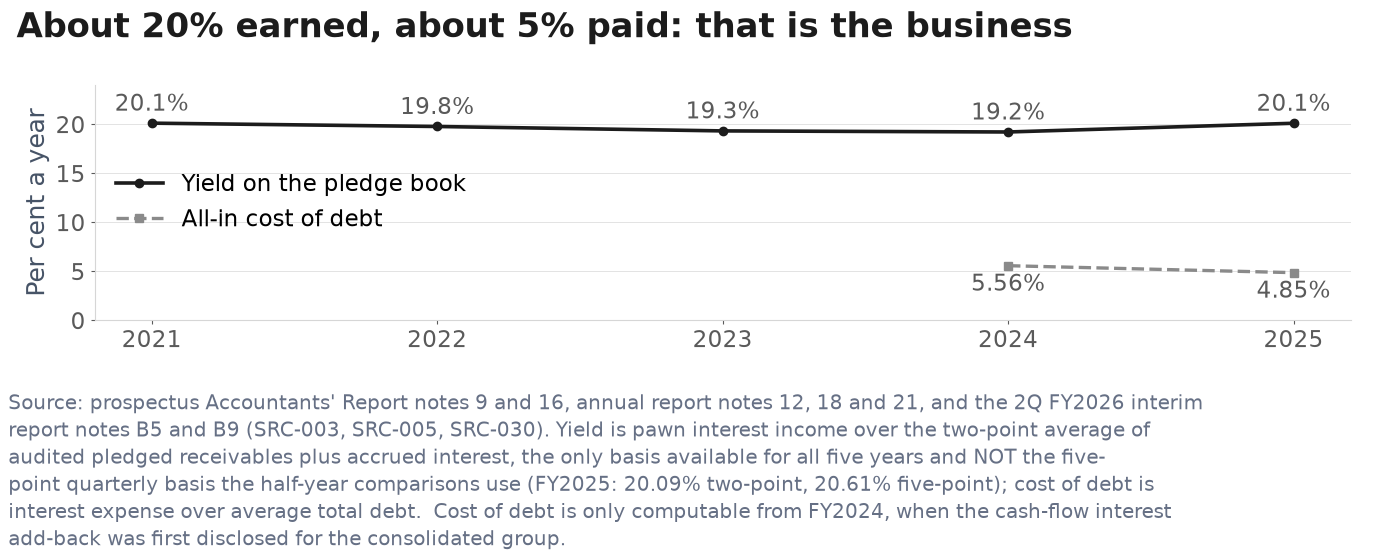
FY2021–FY2023 are the combined pre-IPO statements from the listing document; FY2024 onward are the consolidated statutory group. Book yield is interest income on pawnbroking divided by a two-point average of the audited pledged-receivables-plus-accrued-interest balance, which is the only basis available for all five years because quarterly balances exist only from the FY2024 year end. On a five-point quarterly average the FY2024 and FY2025 figures are 19.40% and 20.61%. Cost of debt is interest expense divided by average total debt and is only computable from FY2024, when the cash-flow interest add-back was first disclosed for the consolidated group.
First-half and second-quarter FY2026 result bridge, RM million
Line
1H FY2026
1H FY2025
Change
2Q FY2026
2Q FY2025
Revenue
147.655
125.854
+17.3%
71.613
65.888
Gross profit
93.417
69.694
+34.0%
43.495
37.240
Profit before tax
71.798
52.861
+35.8%
33.250
28.337
Profit for the period
51.824
38.183
+35.7%
23.930
20.295
Pawnbroking external revenue
84.313
56.426
+49.4%
41.926
28.951
Gold and jewellery external revenue
63.342
69.428
−8.8%
29.687
36.937
Pawnbroking segment gross profit
71.800
49.570
+44.8%
35.439
25.315
Gold and jewellery segment gross profit
21.617
20.124
+7.4%
8.056
11.925
Inter-segment pledge transfers
37.081
52.414
−29.3%
Not separately stated
Not separately stated
The half-year result was driven by the lending side rather than by more gold turnover. Pawnbroking external revenue rose 49.4% and segment gross profit rose 44.8%, while gold and jewellery revenue declined 8.8%. The same split is visible in the standalone second quarter. That distinction matters because the gold segment can move with auction timing and realised gold value even when the interest-bearing pledge book is still expanding.
Source: 2Q FY2026 interim report, consolidated income statement, segment note B6 and comparative quarter columns (SRC-030).
The spread and the cash-flow bridge
About 20% earned on the book, about 5% paid on the debt — that is the business. Book yield is pawn interest income over a two-point average of audited pledged receivables plus accrued interest. Cost of debt is interest expense over average total debt and is only computable from FY2024, when the cash-flow interest add-back was first disclosed for the consolidated group. Source: prospectus Accountants’ Report notes 9 and 16, annual report notes 12, 18 and 21, and the 2Q FY2026 interim report notes B5 and B9 (SRC-003, SRC-005, SRC-030).
For a lender, operating cash flow includes cash deployed into receivables alongside earnings. FY2025 operating cash flow was negative RM165.1m against net profit of RM86.1m. The cash-flow statement’s RM262.0m increase in trade and other receivables was a major cash use; other reconciling items also affect the RM251.2m difference between profit and CFO. Interest paid of RM16.913m was 2.3% below the RM17.315m expense, while tax paid of RM31.116m was 8.8% below the RM34.120m charge. Those comparisons do not establish that all earnings were cash-backed. Negative CFO can reflect productive book growth; whether accrued interest and collateral recoveries convert to cash remains a separate question.
FY2025 earnings and cash deployment, RM million. The receivables cash use is shown below zero. These are separate observations, not an additive waterfall or a closed profit-to-cash reconciliation. The cash-flow movement excludes RM37.845m of receivables acquired through the Perak acquisition. Source: FY2025 annual report cash-flow statement and note 12 Trade and Other Receivables (SRC-005).
Seven things a reader should check in the filings themselves
1. Interest expense is in cost of sales. FY2025 interest expense was RM17.315m; the printed finance-costs line was RM0.402m, which is lease and term-loan interest only. The RM16.913m difference is exactly the pawnbroking segment’s cost of sales and exactly the cash-flow statement’s “interest paid”. An interest-cover ratio built on the printed finance-costs line understates the group’s funding cost roughly forty-fold.
2. The five-year table uses two definitions of debt. Total Borrowings for FY2025 is RM395.9m, which over equity of RM483.3m is 0.82x. The Net Gearing Ratio printed two rows below is 0.92x. The wider definition is disclosed, in note 33 Capital Management: loans and borrowings RM395,858,324 plus loans from related parties RM23,879,141, directors RM11,839,937 and shareholders RM12,036,966 plus a RM104,149 lease-liability component, giving total debts of RM443,718,517 and 0.92x. The rights-issue circular prints the same figure rounded. The point is not that the definition is hidden — it is in note 33 — but that the Financial Highlights table prints a ratio two rows beneath a Total Borrowings row from which it cannot be reproduced. No cash is deducted in either, so “net” gearing is a gross ratio.
3. The provision on the pledge book is 0.083% of principal. RM664,015 against pledged principal of RM798.0m, or 0.080% against the RM828.0m of principal plus accrued interest. This follows largely from the mechanics: under the Pawnbrokers Act 1972 the auction reserve price for an unredeemed pledge is set at a 10% premium to the loan. That is a floor on the auction price, not a guarantee of full contractual recovery: at the disclosed 2% per month the accrued interest passes the 10% premium after five months, before fees, so a sale at reserve protects principal but need not return all the interest. On a sale at or above reserve the loan is recovered and the group’s own exposure arises when it bids for and buys in the pledge itself. Two P&L lines carry the consequences — the gold segment’s cost of sales and inventory write-down (RM434,286 in FY2025) and the receivables allowance (RM155,010 charged in FY2025), whose measurement the significant-estimates note says must consider a significant decline in the value of pledged articles.
4. Receivables growth is a major use of operating cash. FY2025 operating cash flow was negative RM165.1m against net profit of RM86.1m. The RM262.0m receivables cash use is one reconciling item; other items also affect the RM251.2m difference. In the same year interest expense of RM17.315m was paid RM16.913m in cash and tax of RM34.120m was paid RM31.116m.
5. One customer took a third of revenue. The major-customer note discloses a scrap-gold counterparty at RM89,410,990 of FY2025 revenue, 33.1% of the group total. A second took RM22.8m, down from RM52.3m the year before.
6. RM23.6m of the 2024 listing proceeds was still unspent on 10 August 2026. The board extended its deadline by twelve months on 16 April 2026, to 22 July 2027, citing delays in obtaining the initial Ministry approval and the requirement that premises be secured only afterwards. Of the RM31.5m revised expansion allocation, RM7.9m had been spent: RM4.0m capitalising one licensed outlet and RM3.9m of renovation for six more. RM8.5m had earlier been reallocated from expansion to cash capital for existing shops.
7. The funding is short and secured over everything. At 30 June 2026 the group carried RM481.7m of bank borrowings, of which 97.5% was revolving credit. At the FY2025 year end, RM471.9m of RM494.7m of undiscounted contractual financial liabilities — 95.4% — fell due on demand or within one year. The facilities are secured by a debenture over the group’s fixed and floating assets plus corporate guarantees. No current facility limit, tenor or review date has been restated for the enlarged 2026 lines: the 2024 prospectus disclosed RM225.00m of total facilities with RM31.72m unutilised and dividend covenants lender by lender (UOB, OCBC and AmBank consent above 50% of a subsidiary’s PAT; CIMB for any dividend), and revolving credit alone stood at RM469.8m at 30 June 2026 — more than double the last total the group disclosed — but no filing since has restated the limit for the enlarged position.
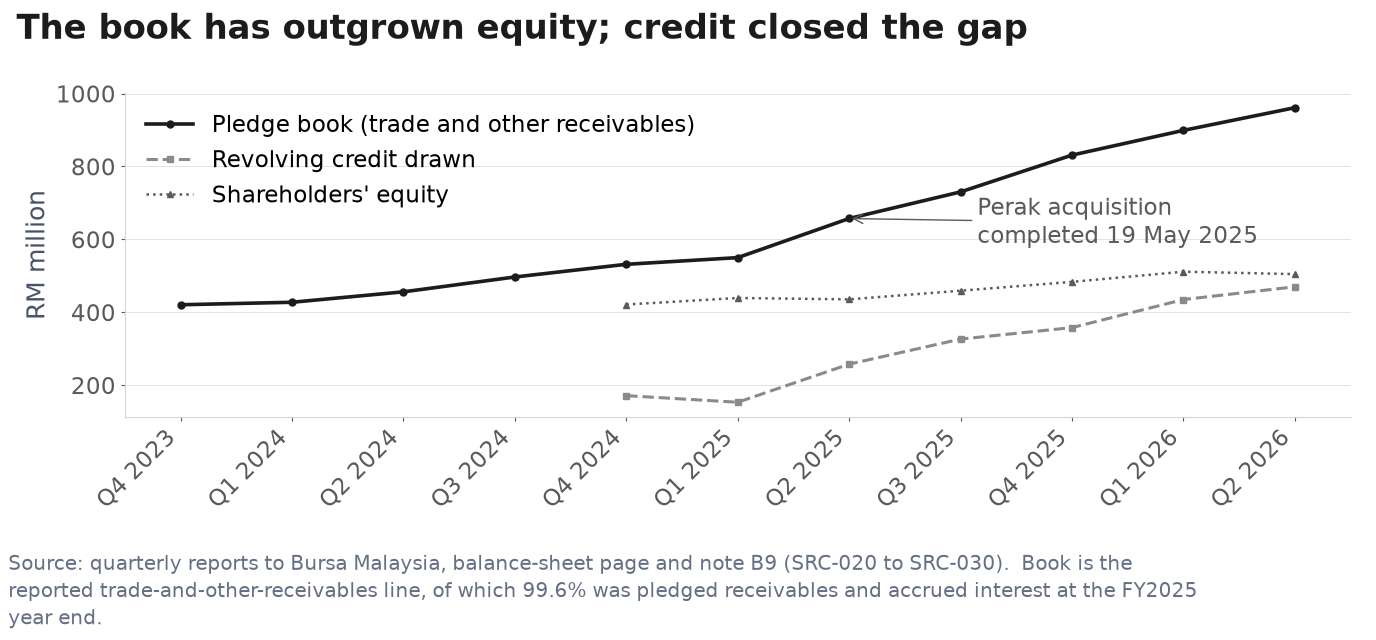
The book has outgrown equity; credit closed the gap — RM million. The pledge book is the reported trade-and-other-receivables line, of which 99.6% was pledged receivables and accrued interest at the FY2025 year end. Equity is the reported total-equity line and is only available from the FY2024 year end, when the consolidated group began reporting quarterly. Source: quarterly reports to Bursa Malaysia, balance-sheet page and note B9 (SRC-020 to SRC-030).
What sits underneath the book, concentration and funding figures
FY2025 collateral-book and inventory risk markers, RM million
Line at 31 December 2025
Amount
What it measures
Gross pledged receivables
798.006
Principal advanced against pledged articles
Accrued pawn interest
29.973
Interest earned but not yet collected
Receivables allowance
(0.664)
0.083% of gross principal
Net pledged principal plus interest
827.315
99.6% of total trade and other receivables
Gold and jewellery inventory
28.606
Bought-in pledges and purchased stock held for sale
Inventory write-down charged in FY2025
0.434
Slow-moving or impaired inventory route
Receivables allowance charged in FY2025
0.155
Pledged-receivable impairment route
A pledge that does not redeem can surface through two accounting paths. Before recovery, the group assesses the receivable against the pledged article; after it buys the article at auction, the asset becomes inventory and can be written down there. The very small receivables allowance should not be read as the whole economic loss history without also following inventory write-downs and gold-segment margins.
Source: FY2025 annual report notes 12, 13 and 22 and the significant-estimates disclosure (SRC-005).
Major-customer revenue in the gold segment, RM million
Counterparty
FY2025
FY2024
FY2025 share of group revenue
Customer A
22.781
52.323
8.4%
Customer B
89.411
58.666
33.1%
Customer C
1.616
—
0.6%
Three disclosed customers
113.808
110.989
42.1%
The concentration is in the recovery and trading channel, not among pawn borrowers. Customer B alone took one third of consolidated FY2025 revenue; the three named-by-threshold customers together took 42.1%. The mix also changed sharply between A and B, so aggregate concentration can look stable while counterparty dependence moves underneath it.
Source: FY2025 annual report note 21, major-customer information (SRC-005).
Remaining 2024 IPO expansion proceeds at 10 August 2026, RM million
Use
Revised allocation
Used
Unutilised
Timing
New-pawnshop expansion
31.5
7.9
23.6
Deadline extended to 22 July 2027
— capitalise one licensed outlet
Included above
4.0
—
Completed component
— renovate six outlets
Included above
3.9
—
Completed component
The RM31.5m is the revised expansion allocation after RM8.5m was moved to working capital for pawn loans at existing shops. It is separate from the proposed 2026 rights issue below.
Bank borrowing stack, RM million
Facility drawn
30 Jun 2026
31 Dec 2025
Change
Revolving credit
469.800
357.800
+112.000
Bank overdrafts
7.587
33.547
−25.960
Current term loans
0.327
0.317
+0.010
Non-current term loans
4.029
4.194
−0.165
Total bank borrowings
481.743
395.858
+85.885
All of these borrowings are denominated in ringgit and secured. The interim note says the overdrafts and revolving credit are backed by a debenture over the group’s fixed and floating assets and corporate guarantees. The half-year increase is almost entirely revolving credit, which is consistent with the RM130.1m rise in trade and other receivables over the same six months.
Source: 2Q FY2026 interim report note B9 and statement of financial position (SRC-030).
The corporate action now in front of shareholders
An extraordinary general meeting on 3 September 2026 will consider a renounceable rights issue of up to 120,000,000 new shares, one for every five held, at an issue price to be fixed at not less than RM1.00. VYN Holdings Sdn Bhd, which holds 50.70%, gave an irrevocable undertaking dated 8 July 2026 to subscribe for its full entitlement, RM60,834,377, which alone meets the minimum subscription level. The issue is not underwritten. Under the minimum scenario, RM44.6m is earmarked as cash capital for pawn loans at existing outlets within twelve months and RM15.0m for six new outlets within twenty-four months.
The circular discloses that the group’s public shareholding spread was 27.88% at 31 July 2026 and is expected to be 25.32% after the issue under the minimum scenario, against a 25% listing-requirement minimum, and that the illustrative RM1.00 price is a 6.18% discount to the theoretical ex-rights price computed on the five-day volume weighted average price to that date. The shares last traded at RM1.06 on 31 July 2026. The proposal was announced to the market at 17:56 on Friday 5 June 2026, after that session’s close — so 5 June closed at RM1.31 as the last pre-announcement price and 8 June, the next trading session, closed at RM1.15, a −12.21% first-session reaction (RM1.15 / RM1.31 − 1). The RM1.32 close on 4 June was a pre-announcement level.
Source: SRC-006 sections 2, 3, 7 and 8.
Illustrative rights-issue proceeds and intended use at RM1.00 per share, RM million
Use
Minimum scenario
Share
Maximum scenario
Share
Expected use
Cash capital for existing pawnshops
44.6
73.3%
88.8
74.0%
Within 12 months
New-pawnshop expansion
15.0
24.7%
30.0
25.0%
Within 24 months
Estimated expenses
1.2
2.0%
1.2
1.0%
Immediately
Total gross proceeds
60.8
100.0%
120.0
100.0%
—
The expansion allocation assumes six new outlets in the minimum scenario and twelve in the maximum scenario. The circular says conditional approvals had already been obtained for twelve proposed pawnshops in Melaka and Johor. Those approvals do not remove the separate premises, licence and execution steps, as the slower use of the 2024 IPO allocation demonstrates.
Source: rights-issue circular dated 14 August 2026, sections 2 and 3 (SRC-006).
On the credit side of this
This page discusses the group’s gearing, its funding structure and the covenants that were disclosed at listing, because those are facts a reader of the accounts needs. It carries no public letter rating, and none exists: no agency rates this issuer and no instrument of its own is rated. An internal credit opinion produced alongside this evidence brief is a private, non-solicited, letter-scale-equivalent view. It is not published here and nothing on this page implies it.
What this page does say, and what a reader can check, is where the current disclosure stops. The 2024 prospectus put total bank facilities at RM225.00m with RM31.72m unutilised, and listed dividend-restriction covenants lender by lender — UOB, OCBC and AmBank require consent above 50% of a subsidiary’s PAT, CIMB for any dividend. Revolving credit alone stood at RM469.8m at 30 June 2026, more than double the last total the group disclosed, and no filing since has restated the limit, the tenor or the review date for the enlarged position.
Ownership
Substantial shareholder chain, per the FY2025 register
Holder
Direct
Deemed
Basis
VYN Holdings Sdn Bhd
50.70%
—
Register of substantial shareholders
VMM Holdings Sdn Bhd
14.81%
50.70%
Through its holding in VYN
ValueMax Group Limited
—
65.51%
Through its wholly owned subsidiary VMM
Yeah Holdings Pte Ltd, Yeah Hiang Nam, Tan Hong Yee
—
65.51%
Up the chain, under section 8 of the Companies Act 2016
ValueMax Group Limited’s economic interest, computed from the disclosed chain, is 37.03%: 14.81% directly through VMM plus 43.83% of VYN’s 50.70%. The 65.51% figure is a statutory deemed interest, not an economic one.
ValueMax announced on 10 November 2023 a policy of not carrying on pawnbroking or gold retail in Malaysia for as long as it remains a substantial shareholder of Well Chip. The group’s pawnbroking system, which is also where the spot gold price used to size each advance is maintained, is licensed from VMM Holdings at RM350 per outlet per month under the recurrent related-party mandate.
Corrections and notes on the source documents
The FY2024 comparative “Net cash used in investing activities” is printed in the FY2025 annual report as 13,067,178 without brackets. Its four components sum to negative RM13,067,178, and the statement’s own totalling identity closes only with the negative sign.
The unaudited 4Q2024 balance sheet reported cash of RM93.620m and total assets of RM685.748m; the audited figures are RM69.844m and RM685.540m, after RM23.775m of money-market funds were reclassified out of cash into short-term investments. A cash series built from the quarterly prints has a break at that year end.
The 4Q2024 results announcement was amended the following day. The issuer states the amendment was to the proposed dividend per share only, from 0.04 to 4.00 sen; a field-by-field comparison of the two summary tables confirms that no other figure changed.
How this page was made
107 announcements were enumerated from the Bursa Malaysia company-announcements interface for stock code 5325, covering 26 June 2024 to 14 August 2026. 106 of the 107 announcement records were retrieved and hashed; one, a change in a director’s interest dated 23 December 2025, returned an HTTP 403 on every attempt across three passes and is recorded as a retrieval gap. Its same-day companion filing, the dealing notice for the same trade, was retrieved. Fifty-nine PDF documents were retrieved and opened, including the listing document, both annual reports, all eleven quarterly reports and both 2026 circulars.
Every figure on this page traces to a filed document. The calculations shown — the book yield, the gearing reconciliation, the provision rate, the customer concentration — are computed here from filed inputs and are marked as calculations rather than as reported figures. 113 arithmetic identity checks were run across the spread; 112 pass and one residual of RM14,503 on a RM474m debt roll-forward is recorded rather than plugged.
Cross-company read-throughs
These comparisons reuse evidence from other covered companies when a specific economic mechanism connects the source to this company; sector labels and apparent relatedness are not the test. Period, definition, geography, business mix and reporting perimeter are checked, and the external evidence remains a lead until this company's own disclosure confirms it.
Every other test on this page waits for the company to file. These do not. Each row is a series you can look up yourself, free, today — with the level this reading was built against, the levels that would put it in question, and what the series cannot tell you.
The headline yield at the top of the Malaysia government bond yield page, with the one-month and one-year changes printed beside it. Trading Economics, from Malaysian government bond market data
Last recorded
3.93 %, 2026-09-22
What the reading assumes
3.37 % (the level twelve months before the 24 August 2026 observation, taken from that capture's year-on-year change of +0.43 percentage points, August 2025)
Watch / alert
3.8 and 4.23 %, on a move above — currently past the watch level
How often to look
monthly (the series prints daily)
What it points to. The asset side reprices only when a pledge is rewritten, at six-month tickets, while essentially the whole bank stack turns over inside twelve months, so a benchmark move reaches the funding cost first and the book yield second.
Direction only — this pack does not carry a coefficient from this series to reported earnings.
What it cannot tell you. It is a sovereign benchmark, not the group's borrowing rate. The spread over it is unobservable because no facility limit, tenor, review date or margin has been restated for the enlarged 2026 lines, so a move here bounds the direction of the funding cost but not its size.
Settled by FY2026 annual report, the interest expense inside cost of sales rather than the printed finance-costs line, due 2027-04-30. Lead time: one revolving-credit rollover.
The headline gold price, in US dollars per troy ounce. It is an OTC/CFD market reference, not an official benchmark. Trading Economics (OTC/CFD market reference; LBMA benchmark averages used as the anchors)
3,432 and 2,386 US$/oz, on a move below — currently between the assumed level and the watch level
How often to look
weekly (the series prints daily)
What it points to. Gold sets the appraised value each advance is sized against, at up to the disclosed 95 per cent maximum, so it moves ticket size, book growth and the resale value of the forfeited stock the group buys in at auction and sells on by weight.
Direction only — this pack does not carry a coefficient from this series to reported earnings.
What it cannot tell you. Gold sets the size of the loan advanced against a pledge and the value of metal inventory; it does not set the number of pledges or the footfall through the shops. A rally alongside falling volumes can leave interest income flat. The level here is an OTC/CFD market reference, while the anchors are LBMA benchmark annual averages, so read the gap between them as approximate at the margin, never to the dollar.
Settled by FY2026 annual report, note 12 pledged receivables and the inventory write-down line, due 2027-04-30. Lead time: one pledge or stock cycle, roughly one to six months.
Watchlist reviewed on 2026-09-24; each observation has its own date above. This watchlist date does not change the company research cutoff. A series moving past a level is a reason to re-read the case, not a recommendation. The same series across every company covered: what you can watch.
Notes and sources
Questions the filings do not answer
These are open questions about disclosure, not allegations. Each was searched in the filed record first; what was searched and what came back is recorded beneath it.
1. What are the limits, tenors, review dates and covenants of the revolving credit facilities, and how much of the total is committed? Searched: prospectus note 13; AR2024 note 18; AR2025 note 18 and note 32(b)(iii); all eleven quarterly reports, note B9; rights-issue circular s7.2; RRPT circular. Found: The 2024 prospectus disclosed RM225.00m of total facilities, RM31.72m unutilised and lender-specific dividend restrictions. Those historical disclosures do not establish the limits, tenor, review dates or committed portion of the enlarged 2026 revolving-credit position. The inspected subsequent disclosures have not restated those current terms; the historical covenants should not be described as absent.
2. What weighted-average advance rate against appraised value has the group actually achieved, against the disclosed maximum of 95% for gold? Searched: prospectus s7.2 and s7.3; both annual reports; all quarterly reports; both 2026 circulars. Found: Only the ‘up to 95%’ maximum is disclosed. No realised average, no distribution, and no loan-to-value stratification appears anywhere.
3. What was the default rate on pawn loans disbursed in FY2024 and FY2025? Searched: AR2024; AR2025; all quarterly reports; both circulars; both AGM minutes. Found: Not disclosed in any post-listing document. The inter-segment transfer line is the only visible proxy, and it measures the bid value of forfeited pledges rather than the defaulted loan amount.
4. How does the 30 June 2026 receivables balance of RM961.2m split between pledged receivables, accrued interest and non-trade items? Searched: 1Q2026 and 2Q2026 quarterly reports. Found: Interim reports do not disaggregate the receivables line; only the annual reports do. The page’s figure is derived and labelled as such.
5. Why does the recurrent related-party circular state ValueMax’s indirect interest in VYN Holdings as 43.8% in one note and 49% in another? Searched: RRPT circular appendix notes (1) and (5); rights-issue circular s2.5.1 share register. Found: The rights-issue circular’s share register gives VMM 133,356,260 of VYN’s 304,271,887 shares, which is 43.83%. The 49% figure is unsupported by any disclosed share count.
6. What did the third-party forensic review of the 15 October 2024 malware incident conclude? Searched: the full 107-row announcement register; AR2024 and AR2025 sustainability statements; AR2024 and AR2025 risk sections; both AGM minutes. Found: No follow-up announcement exists. The FY2025 sustainability statement reports nil substantiated customer-privacy complaints for FY2023 to FY2025, which is a different question.
7. Is there any contract, exclusivity or pricing formula with the scrap-gold counterparty that took 33.1% of FY2025 revenue? Searched: AR2024 and AR2025 note 31(c); the related-party notes; both RRPT circulars; prospectus s7.2.2 and s10. Found: The customer is identified only as ‘Customer B’ and is not a related party. No contractual terms are disclosed.
Download
A print-ready PDF of this page, for reading away from the screen: Well Chip Group evidence library (PDF). It carries the same content as this page — what the company does, the number that reframes the accounts, the as-filed record, the spread and cash-flow bridge, seven checks for the filings, the corporate action before shareholders, the credit side, ownership, open questions, source-document notes and cross-company read-throughs — and the same omissions: no rating, no fair value, no forecast.
This page is built from the 2024 prospectus, the FY2024 and FY2025 annual reports, all eleven quarterly reports to 2Q2026, the 2026 rights-issue circular and the 2026 recurrent related-party circular, together with the group’s AGM minutes and the Bursa announcement register at stock code 5325.
Public/private boundary. A private rated view sits behind authenticated author access. Its call, valuation outputs, return calculations, forecast scenarios and internal credit grade are deliberately absent from this public evidence library.
This page is an evidence library. It contains no rating, fair value, expected return, forecast scenario or recommendation. Derived figures show the calculation basis in the surrounding text. It is not personalised financial advice.
Reader questions & corrections
Ask about this company, challenge a source or suggest a factual correction. Only selected questions that SMID Research has reviewed and answered are published.
Submissions are private by default. Your email is encrypted and never published. Please do not send confidential or inside information, allegations about individuals, promotions, or requests for personalised investment advice.
Behind the lock The private vault holds a current equity rated view, valuation outputs, the initiation note, the source register, the credit rating register and evidence-request pack, and the equity and credit verification reports. Instrument and issuer credit remain NR because contractual, obligor-mapping and near-term liquidity evidence is incomplete. The rating direction, valuation and expected return are intentionally not reproduced on this public evidence page.
These bounded retrospective corrections clarify specific published facts or calculations. They retain each report's existing research cutoff and do not represent a full refresh or a finding that all possible issues are resolved.
Well Chip Group
Internal Inconsistency. FY2025 receivables were a major RM262.0m cash use, while other reconciling items affect the RM251.2m profit-to-CFO difference. The 2024 prospectus disclosed RM225.00m total facilities, RM31.72m unutilised and lender-specific dividend restrictions. Source basis: FY2025 annual-report and 2024 prospectus inputs. Limitation: Historical terms do not establish the enlarged 2026 revolving-credit limits, tenor or committed amount.
Internal Inconsistency. Applying the stated rounded 99.6% proportion to RM961.209m produces an estimated RM957.364m, not RM958.289m. Cash interest was 2.3% below the expense, while cash tax was 8.8% below the charge; only the interest comparison was within 3%. Source basis: existing published balance and expense-payment inputs. Limitation: The composition estimate is not a disclosed June pledged-loan balance, and payment comparisons do not establish that all earnings are cash-backed.
Price & events
No dedicated price & events section is published on this company page.
Transcripts
Find available event transcripts in the transcript library.