Listed in Singapore and London · Game-services outsourcing
SGX: WKS · AIM: WKS · Information cut-off 28 August 2026
Investor snapshot
Business model
Winking Studios supplies outsourced game art and co-development services, earning as publishers accept milestones and completed work.
Latest figures
In 1H2026 revenue rose 21.1% to US$23.47m, but adjusted EBITDA was US$1.24m, net loss was US$2.50m and operating cash flow was negative US$5.34m; cash of US$23.2m still exceeded borrowings of about US$4m.
Main risk
The central risk is that rapid delivery growth does not convert into customer acceptance, margin or cash.
Next proof
The next test is the next results' receivable collection, gross margin and bookings-to-cash conversion.
Information cutoff 28 August 2026, 07:30 SGT. The latest reported period is the six months to 30 June 2026. The official SGX tape was swept through the cutoff marker; AIM cross-listing reconciliation remains a separate open control. All figures below are reported in primary filings or transparently computed from them.
Evidence balance
The live questionDoes accepted milestone work convert into invoiced, collected cash from publishers fast enough to fund payroll and studio costs?In 1H2026 delivery grew while cash went out, so whether accepted work becomes invoices and collected cash now matters more than the revenue line.
What improved
Revenue rose 21.1% to US$23.47m in 1H2026, and management reported US$51.6m of bookings over 24 months, evidence that publishers kept commissioning outsourced art and co-development work.
What became more demanding
In the same half reported gross margin fell to 24.0% from 30.2%, adjusted EBITDA was US$1.24m, the net loss was US$2.50m and operating cash flow was negative US$5.34m, with receivables and contract assets together US$18.38m awaiting billing or collection.
Strongest alternative explanation
The outflow could be timing rather than deterioration: contract assets US$9.1m represent work recognised before the next billing step, the issuer presented a 30.1% underlying gross margin after specified adjustments, and cash of US$23.2m still exceeded short-term unsecured borrowings US$4.0m. That does not by itself establish collectability.
The decisive missing fact
Decisive would be disclosure of how much of the June contract assets converted through acceptance, invoicing and cash collection, alongside the non-cancellable, price-fixed portion of the US$51.6m bookings figure and the terms of the US$4.0m borrowing.
Drawn from the evidence on this page: the improvement, the constraint, the benign reading and the fact that would settle it. It states no view on the shares.
About the private research record
Author-only research notes are available through Rated view 🔒. They remain private and are not approved for public distribution.
On this page
Business anatomy · operations, customers and cash
Creative briefs become accepted art or co-development milestones
Game publishers and developers commission external production; Winking’s art and co-development lanes share the same acceptance-to-invoice mechanism.
Read each card by investor role: business line, operating step, customer outcome or cash conversion.
Customer needClient brief
Define the game work
What happensA publisher or developer provides an art brief, game specification, code context and production milestones.
Commercial triggerThe customer funds the outsourced production scope.
Business lineArt outsourcing
Create and revise assets
What happensWinking artists produce characters, environments and other game-ready assets, then revise them against feedback.
How it earnsAccepted art milestones earn outsourcing revenue.
Business lineCo-development
Build and test with the client
What happensSeparate teams contribute development and testing work inside the customer’s wider game programme.
How it earnsAccepted builds and development milestones earn co-development revenue.
Cash triggerMilestone to cash
Acknowledge, invoice, collect
What happensCustomer acknowledgement supports revenue recognition; invoicing and collection then turn the milestone into cash.
Cash triggerPublishers and developers are the direct payers in both lanes.
Original SMID Research comic. AI-assisted, analyst-directed monochrome artwork depicts the evidenced operating steps of Winking Studios; deterministic captions and dated mix figures state the economics using issuer disclosures available to 2026-08-28. The drawings are representative—not issuer artwork, an exact product or site design, a statement of scale, or a company forecast.
Investor translation
What matters after the operating picture
Four questions connect the business model to cash and balance-sheet risk. This is a factual reading aid, not a valuation or recommendation.
Value lever
Delivery margin, staff utilization and cash conversion on outsourced game-art and development work.
Cash bottleneck
Staff cost and project work are funded before client acceptance and milestone payment.
Balance-sheet pressure
Accessible cash after acquisitions cannot cover payroll, earn-outs and project working capital.
Next proof
Client acceptance, utilization, receivable collection and free cash after acquisition commitments.
Text version of this comic
Customer need · Define the game work A publisher or developer provides an art brief, game specification, code context and production milestones. Commercial trigger: The customer funds the outsourced production scope.
Business line · Create and revise assets Winking artists produce characters, environments and other game-ready assets, then revise them against feedback. How it earns: Accepted art milestones earn outsourcing revenue.
Business line · Build and test with the client Separate teams contribute development and testing work inside the customer’s wider game programme. How it earns: Accepted builds and development milestones earn co-development revenue.
Cash trigger · Acknowledge, invoice, collect Customer acknowledgement supports revenue recognition; invoicing and collection then turn the milestone into cash. Cash trigger: Publishers and developers are the direct payers in both lanes.
Business and customer concentration
FY2025 revenue was US$45.5m. Art outsourcing contributed US$37.5m, or about 82%; game development contributed US$7.9m, or about 17%; publishing was less than 1%. Two customers represented 29% of FY2025 revenue. The revenue-recognition audit work highlights customer acknowledgement of hours or milestones, which makes acceptance, invoicing and collection central to the operating cash cycle.
FY2025 business and concentration evidence
Item
Filed amount
Share / reading
Art outsourcing revenue
US$37.5m
About 82% of group revenue
Game-development revenue
US$7.9m
About 17%
Publishing revenue
Below US$0.1m
Less than 1%
Largest two customers
29% of revenue
Loss or deferral can move group utilisation
Delivery network
14 studios; 1,400+ employees
Asia, North America and Europe
The operating model is people- and utilisation-intensive. Revenue can grow when acquired teams widen capacity or when existing teams win more accepted work, but payroll and studio costs do not fall in step with a short project delay. That makes customer concentration and utilisation linked risks: a large award helps both revenue and absorption, while a delayed milestone can hurt both at once.
* Derived: operating cash flow less purchases of property, plant and equipment and lease payments. The half-year is not comparable with full years without seasonal context.
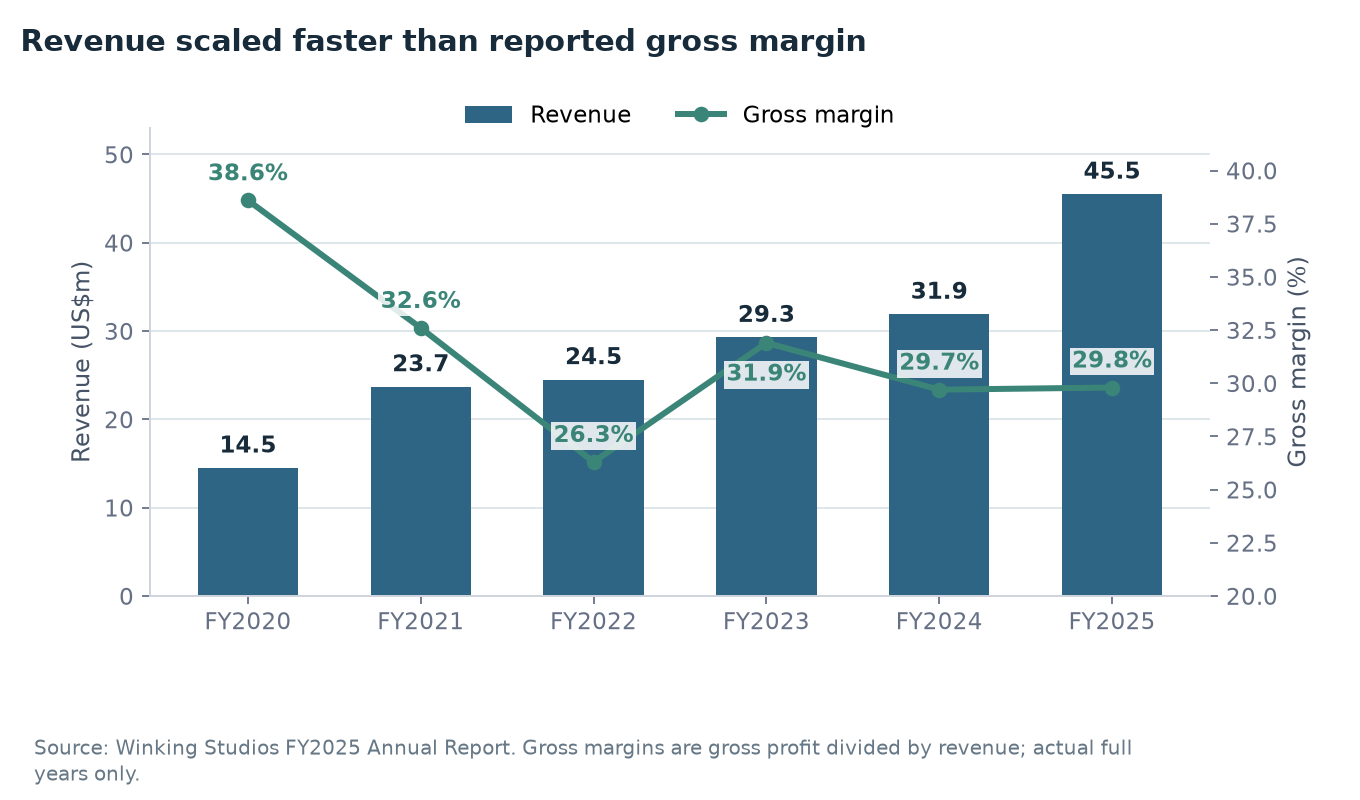
Revenue more than tripled between FY2020 and FY2025, while reported gross margin ended below its FY2020 level. Source: FY2025 Annual Report; margins are gross profit divided by revenue.
Full-year revenue compounded at about 25.7% from FY2020 to FY2025, but the quality of that growth varied. Gross margin fell from 38.6% in FY2020 to 26.3% in FY2022, recovered to 31.9% in FY2023 and then stayed around 30% in FY2024 and FY2025. Profit before tax did not follow revenue: it fell from US$3.00m in FY2021 to US$0.58m in FY2025. That divergence is why revenue growth by itself is an incomplete scorecard.
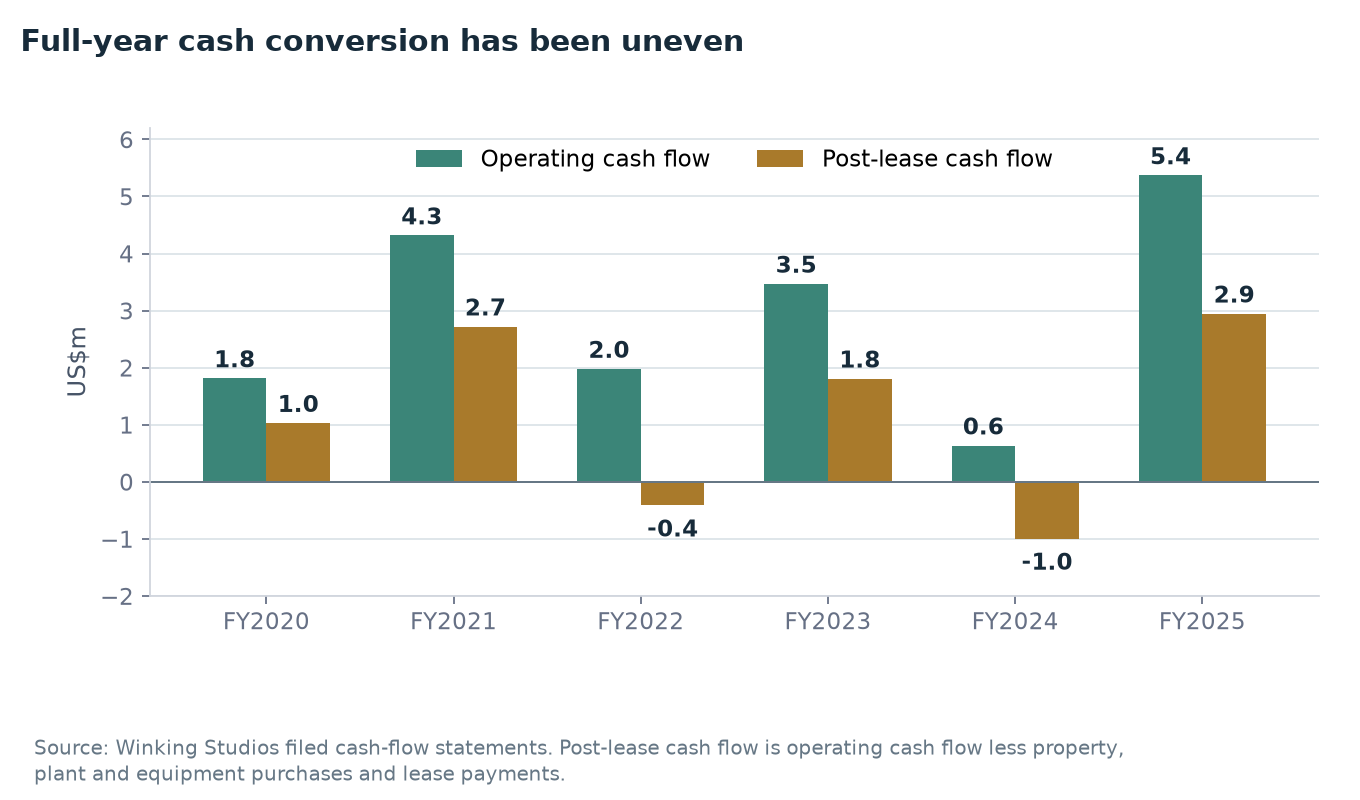
Cash conversion was positive in four of six full years but negative after property, plant and equipment purchases and lease payments in FY2022 and FY2024. Source: filed cash-flow statements; derived post-lease measure.
Operating cash flow ranged from US$0.64m to US$5.37m over the six full years. After purchases of property, plant and equipment and lease payments, the derived measure was negative in FY2022 and FY2024, then recovered to US$2.95m in FY2025. This is not a company-defined free-cash-flow metric and it does not deduct acquisition consideration; it is a consistent way to show how much operating cash remained after two recurring operating-capacity cash uses.
First-half 2026: growth, lower reported margin and cash outflow
Revenue rose 21.1% year on year to US$23.47m. Reported gross margin fell to 24.0% from 30.2%; the issuer also presented a 30.1% underlying gross margin after specified adjustments. Adjusted EBITDA was US$1.24m, the reported net loss was US$2.50m and operating cash flow was negative US$5.34m. The two margin measures answer different questions and should not be substituted for each other.
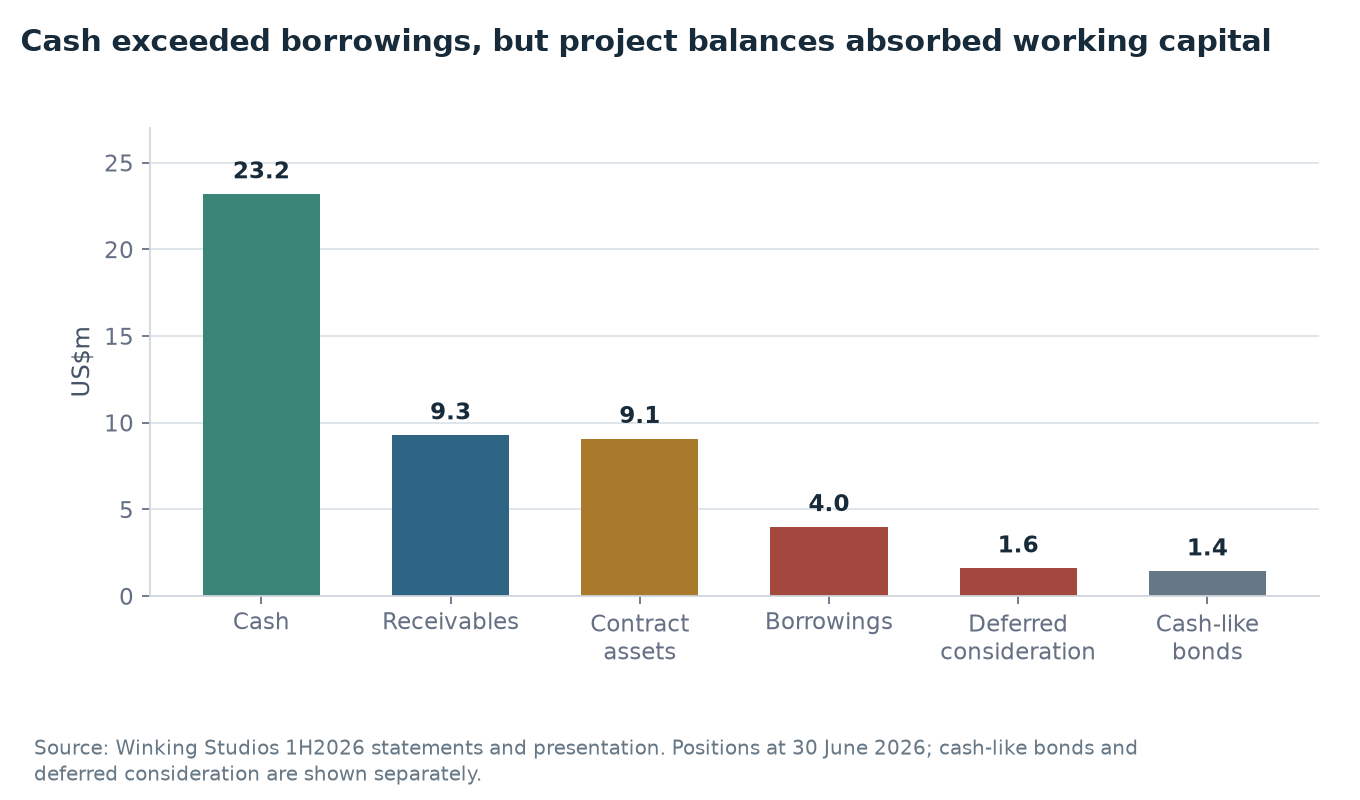
At 30 June 2026, cash was US$23.2m, short-term unsecured borrowings US$4.0m, receivables US$9.3m and contract assets US$9.1m. The combination of receivables and contract assets was about US$18.4m, making conversion from accepted work to invoices and cash a more useful next-period test than bookings alone.
1H2026 reported and issuer-adjusted evidence
Measure
1H2026
Comparison / definition
Revenue
US$23.466m
Up 21.1%; issuer said organic growth was 8.9%
Reported gross profit
US$5.623m
Reported gross margin 24.0%, versus 30.2%
Issuer-underlying gross margin
30.1%
After specified Mineloader, Ampera and AI effects; not IFRS
Reported EBITDA
(US$0.66m)
Before issuer adjustments
Adjusted EBITDA
US$1.24m
Down from US$2.44m
Net loss
(US$2.498m)
Reported attributable result
Operating cash flow
(US$5.339m)
Before property, plant and equipment purchases and lease payments
Post-lease cash flow*
(US$7.123m)
Derived on the same basis as the historical table
The adjusted margin bridge is useful for locating costs, but it does not erase the reported result. Share-based compensation, acquisition and integration expense, foreign exchange and acquired-intangible amortisation sit between reported EBITDA and the adjusted measure. A durable recovery therefore needs both higher project-level margin and evidence that the excluded or investment costs actually roll off in cash.
Acquisitions widened the platform; the organic bridge is incomplete
FY2025 reported revenue grew 42.6%, but Mineloader contributed US$11.78m from April through December. Subtracting that disclosed acquired contribution leaves about US$33.72m, 5.7% above FY2024 revenue. This is transparent arithmetic, not a complete organic-growth measure: Vertic, acquired Pixelline assets, cross-selling and other perimeter effects are not separately disclosed.
Growth-perimeter evidence
Item
Filed / derived evidence
What it establishes
FY2024 group revenue
US$31.899m
Pre-Mineloader comparison base
FY2025 group revenue
US$45.500m
42.6% reported growth
Mineloader contribution, Apr-Dec 2025
US$11.780m
Most of the absolute reported increase
FY2025 less disclosed Mineloader contribution
US$33.720m
Derived; 5.7% above FY2024, but not a full organic bridge
Goodwill at June 2026
US$9.95m
Integration and impairment evidence remain material
The company now operates the Winkingworks, Mineloader, Vertic and Ampera platforms. The strategic claim is that a wider studio network brings Western customer access, specialised skills and more cross-selling. The filing evidence needed to judge that claim is narrower: acquired contribution, organic growth, utilisation, customer retention, margin after integration costs and cash conversion by acquired business. Several of those measures are not yet disclosed separately, so group revenue is ahead of the integration scorecard.
Bookings are a workload indicator, not recognised revenue
Management reported US$51.6m of bookings over 24 months, including US$22.4m expected in 2H2026 subject to confirmation. The Board expected 2H revenue above 1H and a modest adjusted EBITDA loss for FY2026. The filings do not provide a complete bridge from bookings to non-cancellable, price-fixed contracted revenue, so this page keeps bookings separate from the audited financial statements.
How to read the disclosed bookings
Disclosed item
Amount
Evidence boundary
Total bookings over 24 months
US$51.6m
Workload visibility; timing and confirmation still matter
Expected 2H2026 portion
US$22.4m
Subject to confirmation and execution
1H2026 reported revenue
US$23.47m
Accepted and recognised in the period
June receivables plus contract assets
US$18.38m
Recognised/in-process balances still awaiting collection or billing progression
The conversion chain has four separate gates: an award or booking, delivery of labour or milestones, customer acknowledgement supporting revenue recognition, and finally invoicing and cash collection. The FY2025 audit treated acknowledgement of labour hours as a key matter. Investors therefore need the booking figure, contract-asset roll-forward, receivable ageing and operating cash flow together; none of the four can substitute for the others.
The buyback supports the tape and may pre-fund awards
The latest notice records 15,000 shares bought on 27 August 2026 at S$0.210, for S$3,176.26. Across 15 purchase days from 23 June through 27 August, Winking bought 2.099m shares for S$445,448.20, or S$0.2123 all-in consideration per share including fees. After the latest purchase, shares excluding treasury were 439,839,518 and treasury shares were 2,098,600.
Current mandate and cumulative execution through the 27 August purchase
Cumulative shares bought
2,098,600
Cumulative consideration
S$445,448.20
All-in consideration per share
S$0.2123 (derived, including fees)
Legal mandate ceiling
44,193,811 shares
Announced initial programme
About S$857,000 / GBP500,000 / US$665,000
Initial programme cash used
52.0% (derived)
Estimated programme cash remaining
S$411,551.80 (derived)
Execution came in two clear clusters: six consecutive trading days from 23-30 June, followed by nine of the ten trading days from 14-27 August. June all-in consideration averaged about S$0.2189 per share; August purchases totalled 1.434m shares and accounted for 68.3% of cumulative shares. The intervening gap overlaps the company’s 27 July profit guidance and the one-month blackout before its 14 August half-year results. The mandate bars purchases while price-sensitive information is under consideration and during that results blackout, so compliance constraints are a plausible explanation for part of the pause; that is a calendar-based inference, not a company statement.
Through the first 13 purchase days, the company supplied 66.5% of aggregate SGX volume; median daily participation was 73.2%, and nine of those 13 sessions exceeded 50%. This is evidence of meaningful liquidity and price support, but it also means the observed purchase price is partly company-created rather than an independent market signal. Cumulative spend is S$445,448.20, about 52.0% of the announced S$857,000 programme, leaving about S$411,552 before any currency or mandate adjustment.
Every purchased share is held in treasury rather than cancelled. The mandate expressly permits treasury shares to be used for the Winking Studios Performance Share Plan. FY2025 disclosures showed 33.48m unissued zero-price awards. The first 25.6% tranche of the 2024 PSP implies 5.327m shares vesting in 2027. At the observed all-in cost, the full initial programme could acquire about 4.039m shares—75.8% of that first total tranche and about 106.4% of the estimated founder/CFO portion if awards vest pro rata. This unusually close match is consistent with building treasury inventory ahead of award vesting, but it is an analyst hypothesis, not a company statement.
25.6% of the 2024 awards; scheduled for 2027 subject to terms
Treasury shares after 27 Aug purchase
2.099m
6.3% of the disclosed pool and 39.4% of the first tranche
Estimated capacity of S$857k programme
4.039m
At executed all-in cost; arithmetic illustration, not a purchase forecast
The board said at launch that the prevailing value did not appropriately reflect the company and cited SGX/AIM disparities. That disparity was visible on 22 June, when the AIM close converted at same-date FX was about 22% above SGX. By 26 August it had reversed to an approximately 9.5% AIM discount, largely through an AIM decline. The lines are not frictionless substitutes: the issuer says transfers may take up to 20 working days from SGX to AIM and 10 working days in the other direction.
The useful scorecard is therefore net dilution after awards, treasury-share use and buybacks, plus programme cash remaining and purchase-day participation—not gross purchases or mechanical EPS accretion alone.
Balance sheet and credit evidence
Reported cash of US$23.2m exceeded short-term unsecured borrowings of US$4.0m at June 2026. The latest buyback used about 0.14% of that cash; cumulative buyback spend translated at the working S$/US$ rate was about US$0.342m, or 1.47% of June cash. Those figures do not establish accessible liquidity or instrument recovery. Public documents do not yet provide complete facility commitment, maturity, covenant, guarantee, security, ranking, minimum operating cash or legal-entity cash-access evidence. The private credit file is therefore NR — not rateable from public contractual evidence, not a weak credit grade.
30 June 2026 liquidity and operating-balance evidence, US$m
Balance
Amount
Reading
Cash
23.200
Reported group balance; entity access and minimum operating need not disclosed
Cash-like bonds
1.446
Separate from reported cash
Short-term unsecured borrowings
(4.000)
Commitment, maturity and covenant evidence incomplete
Deferred consideration
(1.617)
Other non-current liability linked to acquired perimeter
Receivables
9.293
Invoiced amounts awaiting collection
Contract assets
9.086
Work recognised ahead of the next billing/acceptance step
Current lease liabilities
1.749
Recurring lease principal is already deducted in the post-lease cash measure
Total liabilities / equity
16.321 / 53.433
Accounting perimeter, not an instrument recovery waterfall
Cash exceeded borrowings, while receivables and contract assets together represented US$18.38m of project balances awaiting further billing or collection progression. Source: 1H2026 statements and presentation.
Headline net cash is therefore only the first liquidity question. The group reported cash, but not the legal-entity and jurisdiction schedule needed to show which balances can be moved, the minimum cash each studio needs, or the terms of the US$4.0m borrowing. No public evidence suggests the audited cash balance is false; the limitation is whether all of it is excess, accessible and available to the same creditor or shareholder claim.
Control and the two trading lines
Acer controls about 63.9% of Winking. The AIM relationship agreement supplies governance protections, but control does not create a contractual guarantee of financial support. Concentrated ownership also means the buyback mechanically increases the controller's percentage without Acer purchasing shares, while the award plans can move the diluted denominator in the opposite direction.
Governance and dual-listing facts
Item
Filed evidence
Investor implication
Acer control
About 63.9%
Strategic control, not guaranteed liquidity support
Trading lines
SGX and AIM
Prices can diverge across currencies and thin sessions
Published SGX-to-AIM transfer time
Up to 20 working days
Not frictionless arbitrage
Published AIM-to-SGX transfer time
Up to 10 working days
Settlement time and FX can preserve price gaps
Announcement control
SGX tape swept to cutoff
Complete item-by-item AIM reconciliation remains open
The company cited SGX/AIM disparities when launching the buyback. On 22 June, the converted AIM close was about 22% above SGX; by 26 August it was about 9.5% below, largely because AIM declined. These observations describe two dated closes, not a valuation signal. Thin volume, stale prices, foreign exchange and the transfer timetable mean the two lines should be reconciled transaction by transaction before treating a gap as executable.
Questions to keep live
What is the annual net dilution schedule? Reconcile award grants, vesting, forfeitures and cancellations with buybacks and treasury-share use.
How firm are bookings? Identify the non-cancellable and price-fixed portion of the US$51.6m figure.
How much of June contract assets converted? Follow acceptance, invoices and cash collection rather than revenue alone.
What cash is truly available? Establish minimum operating cash and the commitment, maturity and covenant terms of the US$4.0m borrowing.
What you can watch yourself
Every other test on this page waits for the company to file. These do not. Each row is a series you can look up yourself, free, today — with the level this reading was built against, the levels that would put it in question, and what the series cannot tell you.
game art outsourcing and co-development — nothing public to watch
Searched the platform concurrent-user dashboards, the industry release calendars and the listed publisher-customers' own guidance. Platform activity measures players, not development spend, and the two move on different cycles — studios cut outsourcing budgets while player numbers are still rising. The customers are contractually unnamed, so their guidance cannot be aggregated to this company's perimeter. Bookings and milestone conversion, disclosed at results, remain the first honest observable.
Watchlist reviewed on 2026-08-27; each observation has its own date above. This watchlist date does not change the company research cutoff. A series moving past a level is a reason to re-read the case, not a recommendation. The same series across every company covered: what you can watch.
Download
A print-ready PDF of this page, for reading away from the screen: Winking Studios evidence library (PDF). It carries the same content as this page — business and customer concentration, the as-filed record, the first half of 2026, acquisitions and the organic bridge, bookings, the buyback, the balance sheet and credit evidence, control and the two trading lines, and the questions to keep live — and the same omissions: no rating, no fair value, no forecast.
This page is built from the FY2025 Annual Report, 1H2026 Results Statements and Presentation, the 2023 SGX offer document, the 2024 AIM admission document, and 15 official daily share-buyback notices. The latest retained record is the official 28 August 2026 SGX notice. A 26 August board filing also records the retirement of non-executive director Kao Shu-Kuo with effect from 8 September; the company said there were no unresolved disagreements and independent directors remain at least one-third of the board. Director-cessation notice. Complete SGX/AIM cross-listing reconciliation remains open.
Correction, 16 September 2026 — FY2025 operating cash flow. The as-filed record gave FY2025 net cash from operating activities as US$5.132m, which is the figure in the FY2025 results announcement. The FY2025 annual report — the stated source for that table — reports US$5.370m, cash generated from operations having been finalised at US$4.954m against US$4.716m in the announcement. The table, the cash-conversion chart and the sentence on the range of operating cash flow now carry the annual-report figure. The derived post-lease measure is unchanged at US$2.947m, because it was already computed on the annual-report basis (5.370 less 0.722 of property, plant and equipment and 1.701 of lease principal); that is what identified the error. FY2020 to FY2024 were re-derived on the same basis and are unchanged.
Public/private boundary. A current private rated view is filed behind authenticated author access. Its call, valuation outputs, return calculations, forecasts and scenarios are deliberately absent from this public evidence library.
This page is an evidence library. It contains no rating, fair value, expected return, forecast scenario or recommendation. Derived figures show the calculation basis in the surrounding text. It is not personalised financial advice.
Reader questions & corrections
Ask about this company, challenge a source or suggest a factual correction. Only selected questions that SMID Research has reviewed and answered are published.
Submissions are private by default. Your email is encrypted and never published. Please do not send confidential or inside information, allegations about individuals, promotions, or requests for personalised investment advice.
Behind the lock The private vault contains the author's research notes and source register. It remains private and is not approved for public distribution.
Price & events
No dedicated price & events section is published on this company page.
Transcripts
Find available event transcripts in the transcript library.