Listed in Singapore · Pawnbroking, jewellery retail & secured lending
SGX: 5UF · Information cut-off 24 August 2026
Investor snapshot
Business model
Aspial Lifestyle combines pawn interest, jewellery retail margins and property-backed lending, so growth requires cash for both collateral loans and inventory.
Latest figures
For the twelve months to June 2026, profit before tax was about S$136.7m, while gross debt including leases was S$935.5m and current loans were S$567.1m at 30 June 2026; combined gross proceeds of S$84.8m from a placement and preferential offering added equity funding.
Main risk
The central risk is that short-dated refinancing and collateral values move against a balance sheet built for growth.
Next proof
The next test is whether the next results show operating cash conversion, lower current debt and stable collateral performance.
Share price
S$0.370 (17 Aug 2026 close, dated weekly series)
Market cap
~S$763m · 2,062.2m shares (D)
Exchange
SGX Main Board (transfer completed; offering shares listed 17 Jun 2026)
This page carries no rating, no fair value and no recommendation. Information cut-off: 24 August 2026 (post-1H2026 results and subsequent director-interest notice). Evidence tags: R = primary source · D = derived · G = guidance · E = external/unverified · O = opinion. See methodology.
Evidence balance
The live questionHow long can pawn interest, retail stock turns and secured-lending fees fund a book that absorbs more cash than it generates?In 1H2026 a S$131.8m cash outflow from operations landed six weeks after combined gross proceeds of S$84.8m from a placement and preferential offering, so how the book is funded, rather than how fast profit grows, is the live question.
What improved
1H2026 revenue rose 26.4% to S$464.2m and PATMI 88% to S$52.4m; retail profit before tax rose 151% year on year against pawnbroking's +30.7%, so the retail arm, not the pawn counter, carried the half's profit growth.
What became more demanding
Operations absorbed S$131.8m of cash in the same half; consolidated cash was S$82.6m at 30 June 2026 against parent-company cash of only S$4.5m, group current loans stood at S$567.1m at 30 June 2026, and no committed undrawn facility was disclosed.
Strongest alternative explanation
The absorption could be the growth bill rather than vanished profit: for a lender, book growth is charged against cash from operations, and receivables, pledge lending and inventory building ahead of redemption would be consistent with this pattern without the outflow itself implying weaker profits.
The decisive missing fact
A dated maturity-and-liquidity ladder alongside segment returns, credit losses and stock turns would settle it, together with the first expected-credit-loss charge, deferral or maturity-extension language on the secured-lending notes receivable and the executed trust and loss-allocation documents behind them.
Drawn from the evidence on this page: the improvement, the constraint, the benign reading and the fact that would settle it. It states no view on the shares.
About the private research record
Also on file for this company, behind the rated view 🔒 (author-only): the private credit initiation with indicative grade, outlook, scenarios and structural waterfall · the equity rating and full written view with fair value · the expanded financial spread & model workbook (Excel, live formulas) · the presentation deck · the independent-review artifacts. Kept private; not for distribution.
On this page
Business anatomy · where revenue and profit come from
Three secured-asset businesses turn collateral and stock into cash
Pawn lending, jewellery retail and property-backed credit share funding links, but each has a different customer and cash engine.
Compare the business lines; dated mix appears only where reported segments map cleanly to a card.
What happensProperty security supports a separate book of secured notes or loans rather than a jewellery sale.
How it earnsBorrowers pay interest and fees; principal returns when the credit is repaid.
Capital loopCash loop
Recycle the capital
What happensRedemptions, retail receipts and loan repayments return cash that can fund the next pledge, stock purchase or secured advance.
Return driverCash conversion depends on collateral exits, stock turns and borrower repayment.
Original SMID Research comic. AI-assisted, analyst-directed monochrome artwork depicts the evidenced operating steps of Aspial Lifestyle; deterministic captions and dated mix figures state the economics using issuer disclosures available to 2026-08-24. The drawings are representative—not issuer artwork, an exact product or site design, a statement of scale, or a company forecast.
Investor translation
What matters after the operating picture
Four questions connect the business model to cash and balance-sheet risk. This is a factual reading aid, not a valuation or recommendation.
Value lever
Sustainable return on equity after funding costs and credit losses across pawn, retail and secured lending.
Cash bottleneck
Pawn receivables, jewellery stock and property-backed loans absorb cash before redemption, sale or repayment.
Balance-sheet pressure
Realizable pledged assets and committed funding no longer cover debt due within a year.
Next proof
Segment returns, credit losses, stock turns and a dated maturity-and-liquidity ladder.
Text version of this comic
Business line · Value the pledge A customer brings gold, jewellery or another valuable. Aspial appraises it and advances a pawn loan. Reported mix: FY2025 revenue 11.1%; segment PBT 41.5% (D).How it earns: Pawn interest when the customer redeems or renews.
Business line · Put stock in the case The group sources or holds jewellery inventory and sells finished pieces through its retail network. Reported mix: FY2025 revenue 87.5%; segment PBT 57.1% (D).How it earns: The retail buyer pays the ticket price; Aspial keeps the product margin.
Business line · Lend against property Property security supports a separate book of secured notes or loans rather than a jewellery sale. Reported mix: FY2025 revenue 1.4%; segment PBT 1.4% (D).How it earns: Borrowers pay interest and fees; principal returns when the credit is repaid.
Capital loop · Recycle the capital Redemptions, retail receipts and loan repayments return cash that can fund the next pledge, stock purchase or secured advance. Return driver: Cash conversion depends on collateral exits, stock turns and borrower repayment.
Credit evidence update · 19 August 2026
LTM June 2026 PBT was approximately S$136.7m and EBITDA proxy approximately S$206.6m. Gross debt including leases was S$935.5m, producing gross debt/EBITDA of 4.53x, net debt/EBITDA of 4.13x and EBITDA/finance-cost coverage of 6.46x. (D)
Cash conversion moved the other way. LTM operating cash before working capital was S$210.9m, but working-capital and earning-asset absorption was approximately S$273.5m, leaving reported LTM CFO at approximately negative S$104.8m. (D) This partly represents growth in receivables, secured lending and inventory, but it still increases dependence on funding rollover. (O)
Consolidated cash is not issuer cash
Consolidated cash was S$82.6m at 30 June 2026, while parent-company cash was only S$4.5m. The parent has S$53.5m of Series 004 notes due 24 September 2027 and S$128.0m of Series 005 notes due 29 October 2029. Current interest-bearing loans were S$567.1m; no committed undrawn facility was disclosed. At FY2025, S$867.2m of receivables, inventory and cash was pledged. (R/D)
At 30 June 2026, BigFundr showed S$367.9m of notes receivable against S$361.9m of investor loan payables. These balances are not netted here for liquidity or recovery because executed trust, beneficial-ownership, loss-allocation and servicing documents have not been established from the public record. (R/O) This page publishes the evidence and calculations only; the private vault holds the separate personal credit opinion and scenarios.
24 August monitoring update. Executive chairman Koh Wee Seng disclosed an on-market disposal at par of S$1.0m principal amount of the 5.10% notes due 2029. His direct holding fell from S$8.5m to S$7.5m; deemed holdings were unchanged at S$3.25m, taking total disclosed interest from S$11.75m to S$10.75m. The transaction changes insider alignment at the margin but creates no issuer proceeds, repayment or refinancing event. SGX Form 1. (R/D)
1 · What the company is — one machine wearing three segment names
Pawnbroking lends against gold and luxury collateral at regulated rates; forfeited pledges flow into retail, which sells new and pre-owned jewellery through Lee Hwa, Goldheart, Maxi-Cash, Niessing and Dr. Pajak — 118 stores across six brands. Secured lending (BigFundr) originates Australian real-estate-backed notes and places them with third-party retail investors, holding the paper as agent/nominee for a spread and fees. (R)
The linkage is disclosed, and quantified
Retail is 87.5% of FY2025 revenue, but pawnbroking books S$56.6m of inter-segment revenue — 61.6% of its own external revenue — selling forfeited pledges into the retail arm; the company states plainly that written-off pledge interest is recovered when forfeited pledges are sold through retail (R, AR2025 notes 29/31c). The two segments are one system: pawnbroking sources cheap gold and de-risks its own credit through retail's disposal channel; retail gets supply and footfall. Judging either on its own margin is the error to avoid.
The 2022 perimeter change is the break in every series. Aspial Corp sold its jewellery businesses into the listco for up to S$99.8m in 2022, lifting its stake from 62.56% to 70.77% on completion (the widely-quoted 71.78% is the expected figure from the July 2022 media release, not the realised one — see the corrections log). Comparatives were not restated (verified against AR2021/AR2022), so FY2023 is the first clean full year of the enlarged group, and pre-2022 data describes a materially different company. Related-party dealing here is structural, not incidental: the chairman of this company is the CEO of its controlling parent. (R)
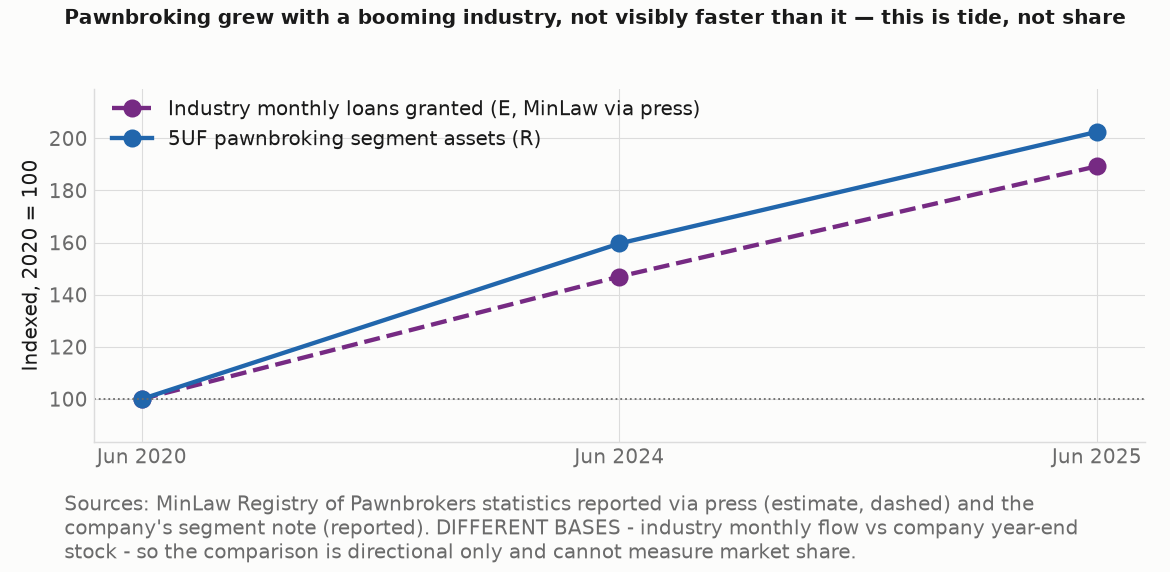
Industry: licence-capped, price-capped. Singapore pawnbroking operates under the Pawnbrokers Act 2015 with interest capped at a flat 1.5% per month — pricing is not a lever; growth comes from volume, ticket size (i.e. gold) and share. Industry monthly loans granted ran S$467m (Jun-2020) → S$884m (Jun-2025), with average loan per pledge up 19.5% in the last year — a gold-driven tide. Indexed against that tide, the company's pledge book has grown roughly with the industry, not visibly faster: overwhelmingly a rising tide, not share gain (O) — which matters, because tide-driven growth is rented from the gold cycle. (R/E/D)
Pledge book vs industry loans granted, indexed — tide, not share.
2 · Segment economics — the capital picture inverts the revenue picture
FY2025 (S$'000)
Pawnbroking
Secured lending
Retail
External revenue
92,009
11,504
726,570
Inter-segment revenue
56,640
–
10
Segment PBT
42,324
1,427
58,190
PBT margin
46.0%
12.4%
8.0%
Segment assets
738,767
381,293
397,240
Net capital employed
118,641
(2,370)
123,035
Return on net capital
35.7%
n.m.
47.3%
Profit share / asset share
41.5% / 48.7%
1.4% / 25.1%
57.1% / 26.2%
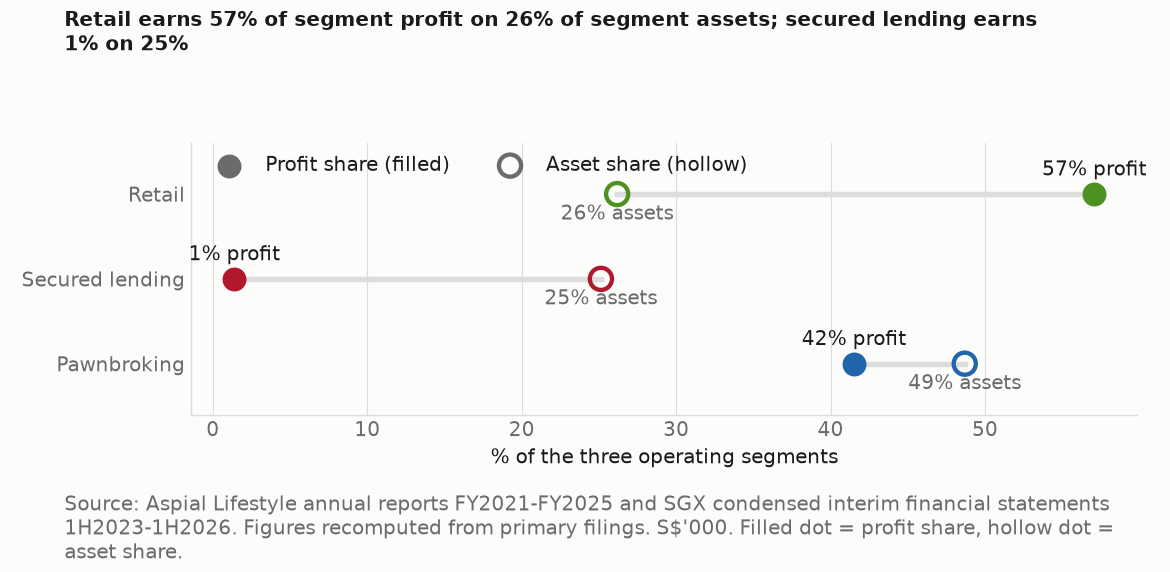
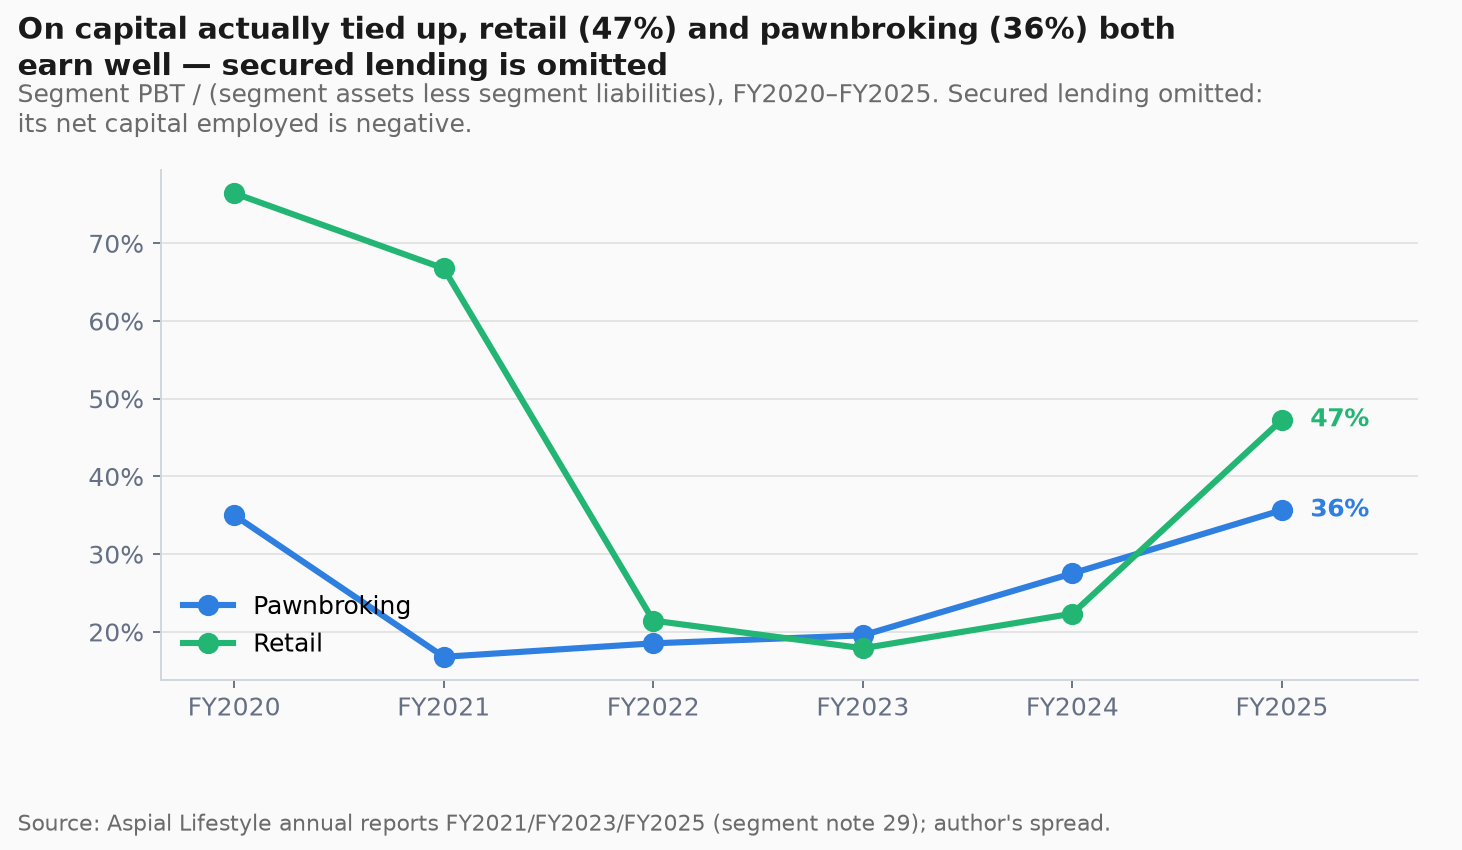
R (AR2025 note 29), returns recomputed (D). The naive read — "low-margin retail dilutes a high-margin pawnbroker" — is exactly backwards on capital: retail's 8.0% margin is a turns business earning 47.3% on the capital actually tied up.
Profit share vs asset share: the inversion.Return on net capital employed — the lens that reorders the segments.
The BigFundr gross-up — a fifth of the balance sheet is other people's money
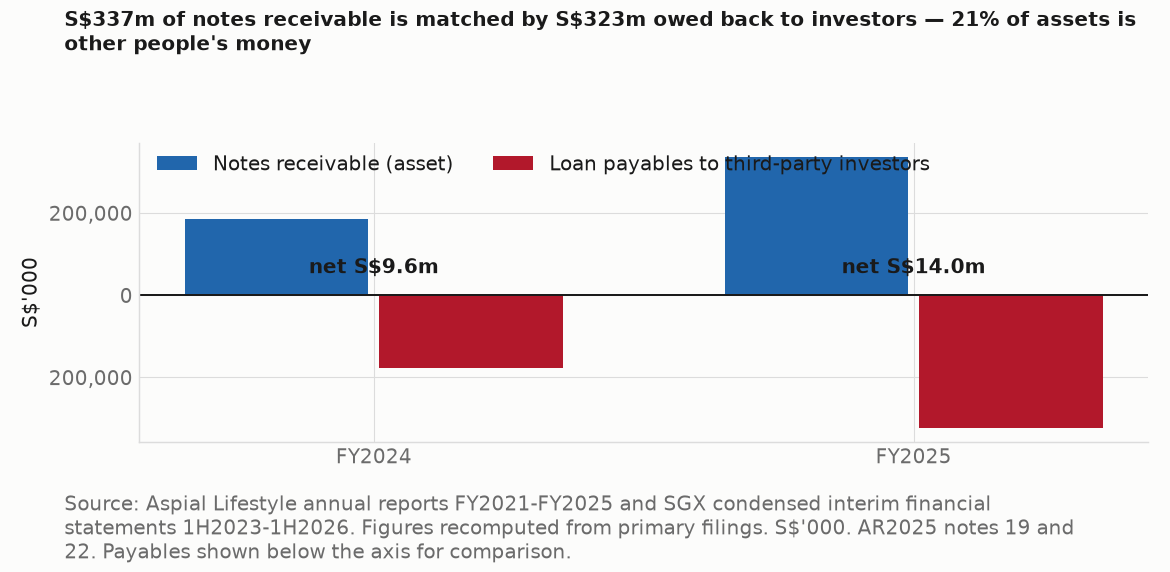
Secured lending holds S$337.4m of notes receivable against S$323.4m owed back to third-party investors — held "as agent/nominee" (R, notes 19/22). Its net capital employed is negative-to-negligible; economically it is a fee/agency business dressed as a lender, and the only segment that grows without consuming the group's balance sheet. Any leverage or ROA calculation that ignores this gross-up misdescribes the company — in both directions. (R/D)
The stress point is the same segment. AUD receivables went S$5.3m → S$309.7m in one year; segment assets S$169.8m (Jun-25) → S$499.8m (Jun-26) — near-tripling — at 6.0–20.0% coupons on Australian property, with the ECL assessment resting on the absence of any default history to date. On a book that barely existed twelve months ago, an absent default history is a statement about the book's age, not its risk (O). Contractual losses would sit with investors; the reputational and franchise loss would sit with a company marketing BigFundr to Singapore retail investors. (R/O)
The gross-up: notes receivable vs the matching investor payables.
3 · The 1H2026 update — and the signal the headline hides
1H2026 (S$'000)
Pawnbroking
Secured lending
Retail
External revenue
55,332
9,203
399,626
Segment PBT
29,009
2,354
47,132
Segment assets
794,109
499,810
402,998
Return on net capital (ann.)
37.3%
34.4%
53.8%
Profit share / asset share
37.0% / 46.8%
3.0% / 29.5%
60.0% / 23.7%
R, interim filing segment note; returns annualised (D). Retail PBT rose 151% year on year against pawnbroking's +30.7% — retail, not pawnbroking, is the swing factor in this cycle.
The inter-segment line nobody reads
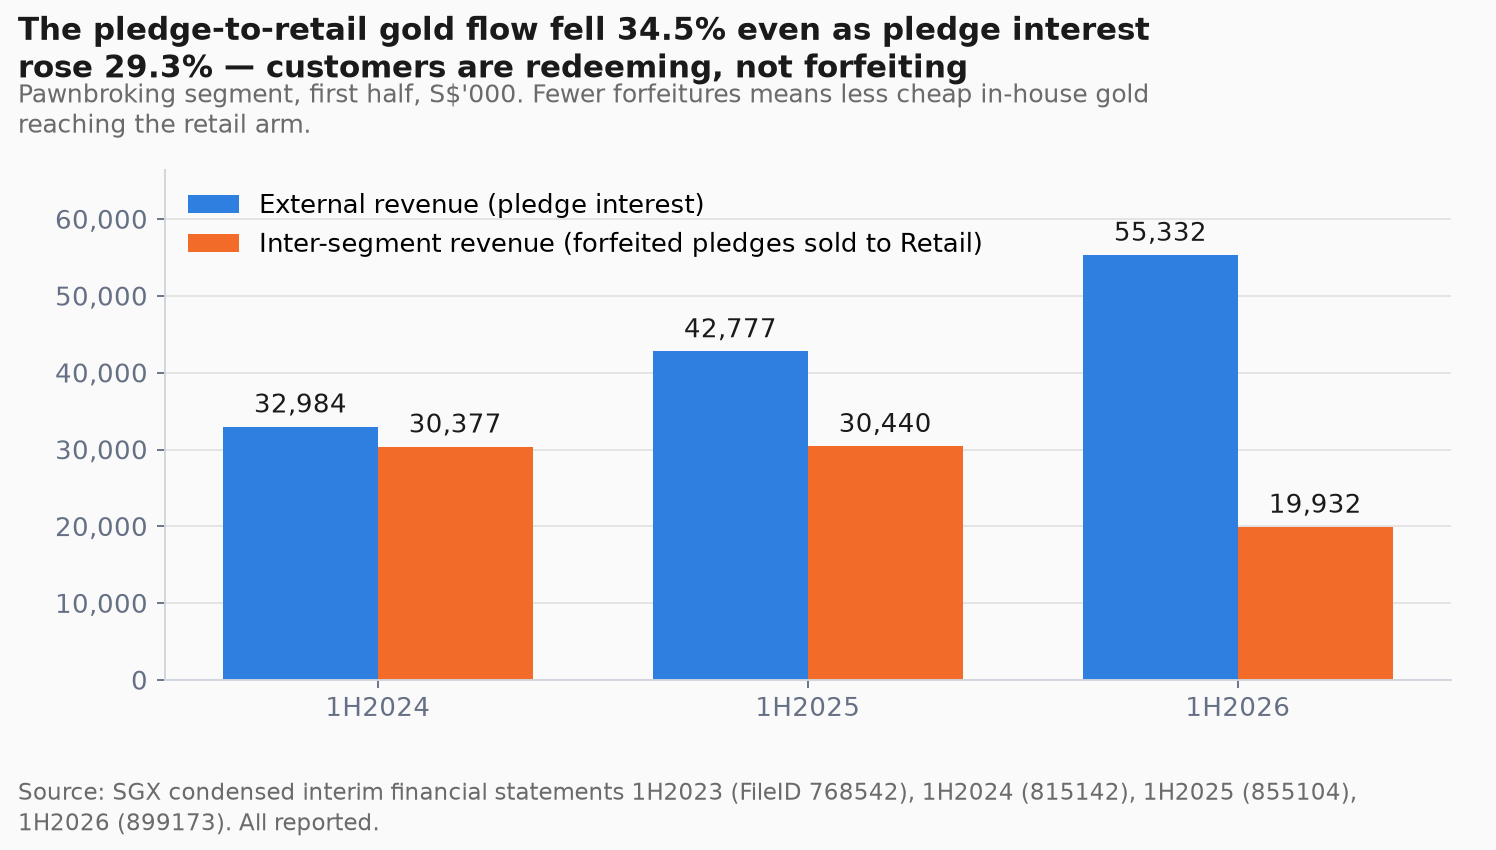
Pawnbroking's sales of forfeited pledges into retail fell 34.5% year on year (S$30.4m → S$19.9m) while its external pledge interest rose 29.3%. More lending, less forfeiting: a rising gold price makes borrowers redeem rather than forfeit — so retail's supply of cheap in-house gold is shrinking at precisely the moment retail carries the group's profit growth. If gold keeps rising, retail increasingly buys inventory at market; if gold falls, forfeitures return but retail demand and inventory value fall with them. That is the tightest expression of the group's single-factor exposure, and it is visible only in this line. (R/D/O)
External pledge interest vs inter-segment forfeited-pledge sales: the flywheel slipping.
4 · Track record — two eras, one master variable
S$m
FY2020
FY2021
FY2022
FY2023
FY2024
FY2025
1H2026
Revenue
262.8
225.7
319.0
471.6
587.6
830.1
464.2
PATMI
29.3
14.4
16.0
19.2
34.3
80.7
52.4
Net margin
11.2%
6.4%
5.0%
4.2%
5.9%
10.2%
11.9%
Operating cash flow
+72.8
(21.7)
(17.2)
+16.3
(46.2)
(7.8)
(131.8)
Net debt
287.0
361.8
477.0
507.6
588.4
678.0
768.3
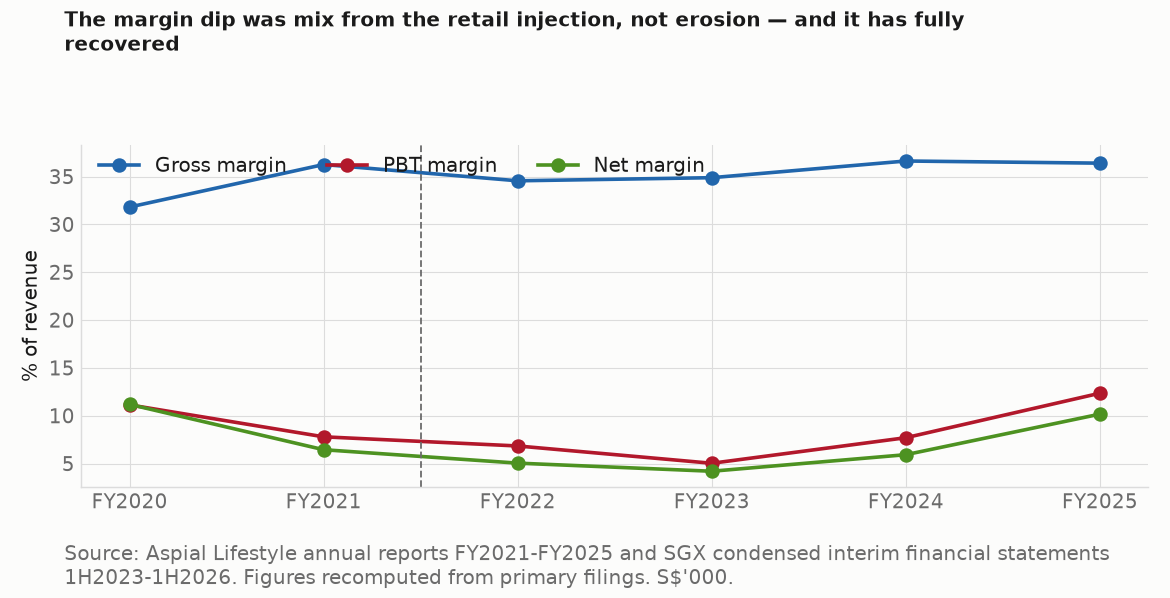
R, re-keyed; net debt recomputed (D). FY2020–23: a pawnbroker absorbing a retail acquisition (margin fall = mix, not erosion). FY2024 onward: gold inflects and both engines fire. The perimeter break sits at Q4 2022.
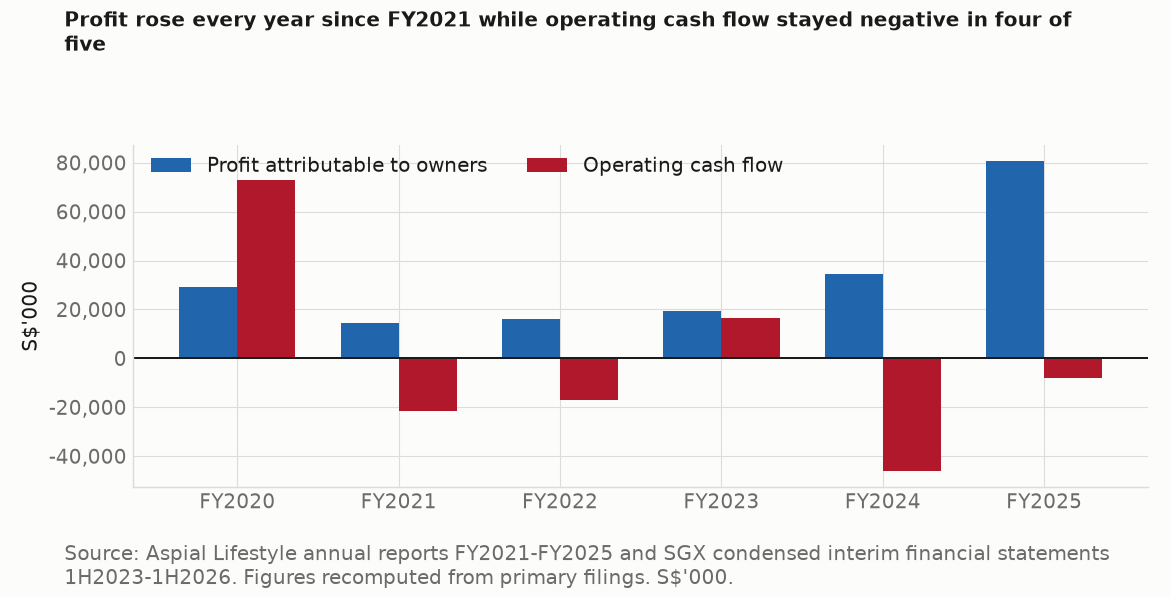
Cash quality, stated honestly. Cumulative FY2021–1H2026 operating cash flow is −S$208.3m against S$224.6m of cumulative profit; 1H2026 alone burned S$131.8m while reporting S$55.0m of profit (OCF/PAT −2.4x). For a lender, book growth belongs in operating outflow — this is largely the growth bill, not vanished profit — but the scale matters in its own right, because every dollar must be funded before it earns. Two further caveats belong in any base line: roughly a fifth of FY2025's PBT increase was non-operating (S$9.1m unrealised FX, S$2.0m disposal gain), and ECL on pawn interest receivables is rising with the book (S$5.3m vs S$4.3m). The auditor's single Key Audit Matter is pawn interest receivables — pointing at the same line a skeptic would. (R/D)
Profit and operating cash flow: the growth bill, charted.Net margin: the 2022 mix-dilution and the gold-cycle recovery.
5 · Funding — who pays for the growth
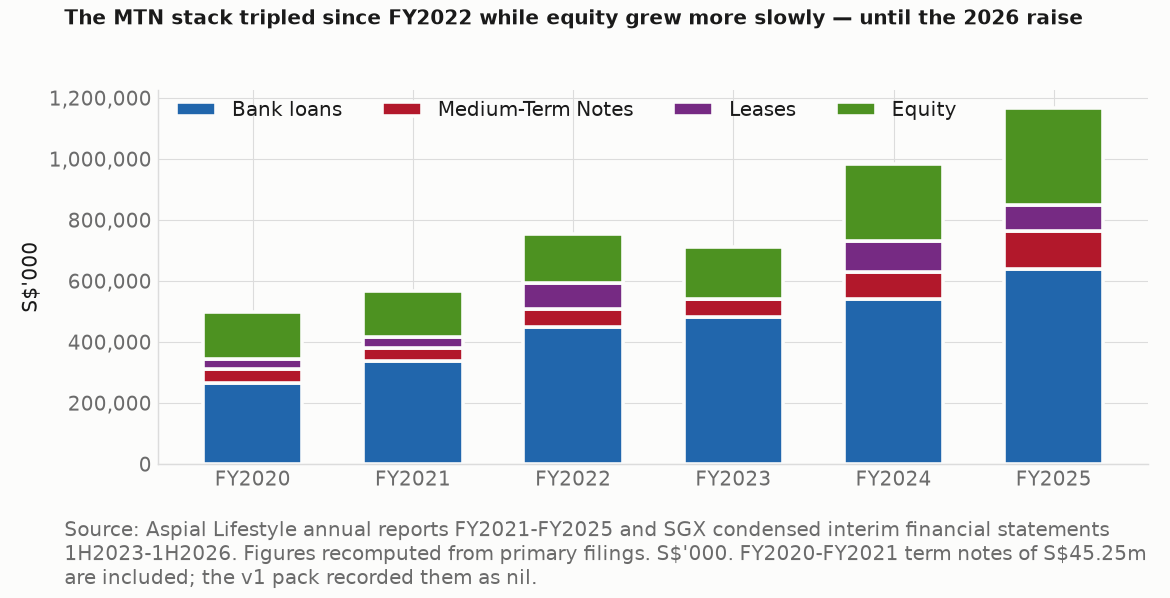
Net debt/equity was 2.14x at Dec-2025, falling to 1.73x at Jun-2026 after the May-2026 combined S$84.8m placement and preferential offering at S$0.402 (D, matching the company's stated figures). S$567.1m of interest-bearing loans are current at 30 June 2026, against a revolving pledge book and S$245.5m of retail inventory; a floating charge over S$634.8m of receivables and S$213.4m of inventories secures the bank lines. Maturity management is active: S$75.0m of 5.10% notes due 2029 issued, 2027 notes exchanged in, a further S$28m tapped. Blended funding cost 4.68%; interest cover 4.14x. (R/D)
Dilution is a recurring feature, not an event
A 1-for-5 rights issue at S$0.12 plus other issuance in FY2024 (S$53.3m), then the May-2026 combined placement and preferential offering (S$84.8m gross) — three equity raises in three years, against one modest 5.37m-share buyback. A book that grows faster than internal cash generation must be fed, and shareholders have fed it. The 1H2026 sequence sharpens the point: a S$131.8m operating outflow landed six weeks after combined gross proceeds of S$84.8m from a placement and preferential offering. (R/D/O)
The funding stack and its growth.
6 · Five years of cash — what fed the book, and what it cost
S$’000, from the consolidated statements of cash flows in the FY2021, FY2023 and FY2025 annual reports. FY2021 was filed under the company’s former name, Maxi-Cash Financial Services Corporation. The three net debt rows are each year’s drawings less its repayments, from the separate lines the statements report; FY2021 reports short-term bank borrowings on a net basis already.
S$’000
FY2021
FY2022
FY2023
FY2024
FY2025
Operating cash flow before working capital
46,009
57,685
89,729
118,158
178,647
Increase in trade and other receivables
(38,331)
(58,722)
(88,644)
(215,957)
(291,194)
Interest paid, in operating
8,908
15,564
27,418
31,260
28,844
Net operating cash flow, as filed
(21,669)
(17,220)
16,331
(46,173)
(7,835)
Purchase of property, plant and equipment
25,255
2,431
4,506
10,707
33,611
Short-term bank borrowings, net
+47,520
+54,082
+40,694
+53,517
+87,067
Term loans, net
+23,269
(12,207)
(9,818)
(4,836)
+8,326
Medium-term notes, net
–
+14,750
–
+31,000
+37,500
… total net new debt
+70,789
+56,625
+30,876
+79,681
+132,893
Equity issued for cash
5,184
–
–
35,637
–
Dividends paid on ordinary shares
21,737
13,337
10,787
12,815
14,469
Lease principal paid
10,803
13,761
22,468
24,101
26,124
Interest paid on lease liabilities
1,002
1,475
2,290
3,259
3,812
Cash and cash equivalents at year end
19,735
30,813
32,641
42,742
86,475
Operating cash flow before working capital rose 3.9 times in five years, and the net operating line was negative in four of them. S$46.0m, S$57.7m, S$89.7m, S$118.2m, S$178.6m — up every single year, with no exception, which is a business earning more cash each year before the book is fed. What sits between that row and the net line is the receivable: it absorbed S$38.3m, S$58.7m, S$88.6m, S$216.0m and S$291.2m, S$692.8m over the five years, against S$490.2m generated before working capital across the same period — the book absorbed 1.4 times everything the operations produced. This is the pawnbroking and secured-lending book growing, and it is the whole difference between a business that generates cash and a statement that reports it consuming cash.
The dividend was paid in every one of those years. S$21.7m, S$13.3m, S$10.8m, S$12.8m, S$14.5m — S$73.1m in total, in five years whose combined net operating cash flow was negative S$76.6m. Four of the five years paid a dividend out of a period that consumed cash. That is not a criticism of the payout in itself, because a lending book funded on a spread is supposed to be funded on borrowings; it is a statement of where the cash came from. Total net new debt over the five years was S$370.9m, and the FY2024 rights issue raised a further S$35.6m of cash, S$35.5m of it after expenses. A second FY2024 share issuance of S$17.7m is deliberately not in this table: it was consideration for an acquisition rather than cash raised, so it never passed through the cash flow statement these rows come from.
The funding mix shifted to short-term bank lines and notes, and away from term loans. Short-term bank borrowings added S$40m to S$87m net in every year of the five — S$282.9m in total — while term loans were net repaid in three of the five. Medium-term notes contributed nothing in FY2021 and FY2023 and S$37.5m net in FY2025, the largest year. Against that, interest paid inside operating went from S$8.9m to S$28.8m, peaking at S$31.3m in FY2024, with lease interest a further S$3.8m on top by FY2025. The cost of carrying the book has risen roughly in line with the book.
Two things at the edges. Capital spending was S$25.3m in FY2021, fell to S$2.4m, and returned to S$33.6m in FY2025 — the largest of the five years, and it tripled from FY2024. And lease principal repaid rose from S$10.8m to S$26.1m, which more than doubled while the outlet network grew; the two together, principal and lease interest, cost S$29.9m in FY2025 against S$14.5m of dividends.
7 · What drives the earnings
Gold — the master variable. It sets pledge ticket size (industry average loan per pledge +19.5% y/y), retail demand, retail inventory value, and redemption behaviour — four exposures, one factor. Rough upper-bound sensitivity: a 10% inventory write-down on the S$245.5m retail book is ~S$24.6m pre-tax, ~24% of FY2025 PBT (D — assumes all inventory is gold-linked, which it is not). FY2025 also carried an S$8.0m gold-hedging loss that management asks readers to look through — a candid disclosure, but a new adjusted-earnings frame arriving in a record year; watch whether it persists when hedging gains. (R/D)
Funding cost against a capped asset yield. Pawn pricing sits at the regulatory cap, so margin moves with the funding side: 100bp on ~S$700m average gross debt ≈ S$7.0m pre-tax, ~6.8% of FY2025 PBT. (D)
Retail velocity. Asset turnover 1.83x and rising; the metric to track is retail PBT per dollar of segment assets, disclosed annually. (D)
BigFundr book quality. The trackable marker is the first appearance of an ECL charge, deferral, or maturity-extension language against notes receivable — observable each results cycle. (R)
8 · Peer context — market facts, decomposed
Aspial Lifestyle
ValueMax
MoneyMax
TTM P/E (E/D)
~7.2x
~7.9x
~12x fwd (E)
P/B (R/D, 17 Aug 2026 close ÷ 30 Jun 2026 book)
1.79x
1.40x
2.27x
FY2025 ROE (D)
29.8%
~18.3%
n.a.
Net debt/equity (D)
2.14x → 1.73x
~1.46x borrowings/equity
higher (see T6I note §7)
Multiples are market data (E) at mid-Aug 2026, except the price-to-book row, which is recomputed (R/D) from the 17 August 2026 close over each company’s filed 30 June 2026 net asset value per share — 20.66, 68.13 and 36.27 cents — so that all three columns stand on one book date. Other ratios recomputed (D). Read with the leverage decomposition from the ValueMax note §7: across this peer set, ROE and book-multiple rankings largely track leverage rankings — and 5UF's balance sheet carries the BigFundr gross-up, which overstates its apparent leverage and understates its ROA. Decompose before comparing.
9 · Red-flags scorecard
Item
Verdict
Evidence
Frequent equity raising
Flag
Rights + issuance FY2024 (S$53.3m); placement May 2026 (S$84.8m) — three raises in three years
Receivables vs revenue growth
Watch
+43.0% vs +41.3% in FY2025 — driven by the BigFundr gross-up
Related-party transactions
Watch
Parent-controlled; the defining 2022 transaction was itself an IPT; chairman is the parent's CEO
Unretrievable filings
Watch
Two interim filings initially unretrievable from SGX — recovered via the FileID sweep; series now complete
Data quality
Watch
AR2025's highlights page misprints FY2022 PAT (S$16,007k vs audited S$16,077k); audited figure used throughout
Auditor
Clear
EY, unmodified; KAM = pawn interest receivables
Segment/KPI redefinition
Clear
One rename ("money lending" → "secured lending"); boundaries stable since FY2020
Cash-rich yet borrowing
Clear
Genuine funding need; no anomaly
10 · The watch-list — dated and falsifiable
Is 1H2026 a new base or a peak? The signature to watch: retail PBT falling while revenue holds — margin compression, not volume loss. (FY2026 results, late Feb 2027 — decisive)
First ECL provision, deferral or extension on BigFundr notes receivable. (Each results cycle)
Retail gross margin against 1H2026's 38.7%. (FY2026 results)
MSCI Global Micro Cap inclusion takes effect after the close on 31 August 2026. (Market-structure catalyst; no earnings effect assumed)
Another equity raise within 18 months despite record profits. (Announcement tape)
The inter-segment pledge flow — does the internal gold pipeline keep shrinking? (Segment note, half-yearly)
Whether the "ex-hedging PBT" adjusted frame persists when hedging gains rather than loses. (FY2026 AR)
10 · The share price and what came with its moves
Over the window Aspial Lifestyle returned +210.9% on a dividend-adjusted basis; the Straits Times Index returned +80.0% and the median of the 3 listed comparisons +260.9%.
Click a quarter — on the chart or in the return strip under it — to read its filings beside its large moves.
Key: Aspial Lifestyle (5UF) as a solid line; Straits Times Index rebased, dashed; peer median rebased, dotted; the peer median runs off scale from Oct 23 and is clipped there; filing ticks above the axis; ex-dividend ticks on it; numbered pins are moves with a written note; plain dots are other detected moves.
Key moves
The five largest moves over a day or up to two weeks, with no day counted twice.
Each move is shown next to the market over the same days (and peers, where shown). News listed with a move was published within its dates; that does not mean the news caused the move. The quarter view has all the news.
Index: Straits Times Index. Peers: the median of three listed companies used as a sector check; the notes name them and their limits.
Q3 2023
22 Aug 2023 – 29 Sep 2023 (part quarter)
5UF −5.0%STI +1.8%Peer median −3.2%Range S$0.13–S$0.14Close S$0.13
Retail and trading of jewellery and branded merchandise rose 71.1%, which the company attributed to the Lee Hwa and Goldheart business acquired in 2H2022; pawnbroking revenue rose 28.7% to S$31.4m on a growing pledge book and a newly acquired subsidiary; secured lending revenue fell 81.4%. Operating expenses rose S$26.2m, including a S$1.5m foreign-exchange loss on Malaysian ringgit exposure, and finance costs rose on higher borrowings and interest rates. PATMI was S$9.4m against S$9.3m and EPS 0.66 cents against 0.87 on the enlarged share count. Equity attributable to owners was S$163.1m and total assets S$878.0m. Interim dividend 0.40 cents, with the scrip dividend scheme applied.
Guidance: Retail expected to 'perform positively' in 2H2023 on pre-GST-hike and festive buying; barring unforeseen circumstances the group expects to continue to grow its businesses and remain profitable for 2023.
Large price moves
122 Aug 2023 · +5% · index 0% · peers 0%
Q4 2023
2 Oct 2023 – 29 Dec 2023
5UF −3.9%STI +0.7%Peer median −6.5%Range S$0.12–S$0.13Close S$0.12
Record date 4 October 2023, paid 22 November 2023. The Maxi-Cash scrip dividend scheme was applied, so shareholders could take new shares in lieu of cash. The chart's return series is adjusted for it, so the ex-date step is not counted as a move.
Q1 2024
2 Jan 2024 – 28 Mar 2024
5UF +1.6%STI −0.5%Peer median +7.0%Range S$0.12–S$0.13Close S$0.13
Retail and trading of jewellery rose 53.6%, which the company attributed to the jewellery business acquired in 2H2022; pawnbroking revenue rose 23.4% to S$63.6m on a growing pledge book and a newly acquired subsidiary; secured lending revenue fell. Operating expenses rose S$40.0m on marketing, staff and depreciation from the jewellery business and the Malaysian subsidiaries, and finance costs rose on higher borrowings and 'the significant increase in interest rates'. Profit before tax was S$23.7m against S$21.8m, after a S$1.8m ringgit foreign-exchange loss (S$25.5m excluding it). The second half was the stronger: 2H2023 revenue S$242.8m (up 37%) and PATMI S$9.8m (up 46%). EPS was 1.36 cents against 1.39. Operating cash flow was S$16.9m; total assets S$921.5m, total liabilities S$747.9m, equity attributable to owners S$168.4m. Final dividend 0.38 cents proposed.
Guidance: Pawnbroking 'continues to experience healthy expansion'; the company said it was 'cautiously optimistic' on the contribution of its Malaysia pawnbroking operations in FY2024, and that it remained focused on operating effectiveness amid increased costs.Next session (26 Feb): 5UF −1.6% · STI −0.4% · peers +0.0%
Maxi-Cash Capital Management held 15% of BigFundr, a Singapore company with a Capital Markets Services licence from MAS; the purchase of 2,695,000 shares took it to 70%, with Trinity House keeping 30%. BigFundr's net assets were S$1.3m at 31 December 2023; no independent valuation was done and the price was paid from internal resources. A later Rule 706A filing (25 February 2026) disclosed a further 25% bought on 30 November 2025 for S$2.85m, taking the stake to 90%.
Next session (26 Feb): 5UF −1.6% · STI −0.4% · peers +0.0%
Q2 2024
1 Apr 2024 – 28 Jun 2024
5UF +4.7%STI +3.4%Peer median +15.7%Range S$0.12–S$0.13Close S$0.13
Niessing is a German jewellery brand dating from 1873 with mono-brand stores in Germany, Switzerland, Singapore, Australia, Hong Kong, China, Malaysia and Japan. The target made a S$0.25m loss before tax in FY2023 after a S$1.99m profit in FY2022; its pro-forma NTA after loan capitalisation was S$14.85m. The deal was a discloseable transaction (9.98% of market capitalisation) and an interested person transaction, so independent shareholders voted at an EGM on 27 June 2024 with ACL and the Koh siblings abstaining. Completion on 8 July 2024 lifted the share count from 1,418,592,499 to 1,559,217,499 and ACL's stake to 73.93%.
Next session (16 May): 5UF +0.0% · STI +0.5% · peers +0.0%
Tan Keh Yan had served since April 2012 and chaired the Audit Committee. Yeo Yun Seng Bernard becomes lead independent director and Audit Committee chairman; Ng Bie Tjin chairs the Nominating Committee. The board is six strong with three independent directors.
Large price moves
27 May 2024 · +6% · index 0% · peers 0%
Q3 2024
1 Jul 2024 – 30 Sep 2024
5UF −3.1%STI +7.6%Peer median +14.1%Range S$0.12–S$0.13Close S$0.12
Retail revenue rose 9.6%; pawnbroking rose 5.0% to S$33.0m on the pledge book; secured lending rose to S$2.2m from S$0.3m on the newly consolidated BigFundr. Operating expenses rose S$7.4m on marketing, staff and depreciation, and finance costs rose on higher borrowings. Profit before tax was S$18.0m against S$12.4m; EPS 1.00 cents against 0.66. Operating cash flow was an outflow of S$25.8m on higher inventories and receivables, funded by S$19.0m of net short-term borrowings and term loans. Total assets were S$1,048.8m and total liabilities S$866.7m; equity attributable to owners S$176.2m.
Guidance: Demand for short-term loans projected to 'stay healthy' through the year; BigFundr anticipated to sustain its momentum; barring unforeseen circumstances the group expects to continue growing and remain profitable in 2024.Next session (13 Aug): 5UF −1.6% · STI +0.7% · peers −1.2%
The issue price was a 4.76% discount to the S$0.126 close and 4.00% to the theoretical ex-rights price. S$11.0m was earmarked to repay bank borrowings and S$26.2m for working capital and, if opportunities arose, strategic investments or acquisitions. ACL, holding 73.93%, and the directors indicated they would take up their entitlements in full or in part, which the board said made underwriting unnecessary. The shares were issued under the general mandate, so no shareholder vote was needed.
Next session (22 Aug): 5UF −1.6% · STI −0.0% · peers +0.0%
Holders of S$39.0m accepted the exchange by the 13 September deadline, and a further S$31.0m was sold at par on reverse enquiry, including from directors and controlling shareholders, with DBS as sole dealer. The company said the exercise refinanced the maturing notes and was prompted by holders wanting to stay invested. The Series 004 notes carry a put if the Koh siblings' combined interest falls below 50%. The remaining S$21.0m of the 2025 notes was redeemed at maturity on 24 January 2025.
Same session: 5UF +0.8% · STI +0.5% · peers +0.0%
Q4 2024
1 Oct 2024 – 31 Dec 2024
5UF −1.6%STI +5.6%Peer median −3.3%Range S$0.12–S$0.12Close S$0.12
Valid acceptances covered 65.7% of the issue and excess applications 29.5%, so every excess application was filled in full. S$11.0m goes to bank borrowings and S$24.4m to working capital and potential investments. The rights shares were listed on or about 5 November 2024, taking the issued share count to about 1,856.2m (computed).
Next session (1 Nov): 5UF −0.8% · STI −0.1% · peers +1.5%
Retail rose 25.4% (40.2% in the second half), partly on the Niessing business consolidated from July; pawnbroking rose 10.9% to S$70.5m on the pledge book; secured lending rose to S$6.1m from S$0.7m on real-estate-backed lending. Operating expenses rose S$27.1m on marketing, staff and depreciation from the acquired subsidiaries; finance costs rose 16%. Profit before tax was S$45.2m against S$23.7m, and 2H2024 PATMI of S$20.2m was up 106%. Operating cash flow was an outflow of S$46.1m on inventories and receivables, against S$56.9m of net financing from borrowings, the rights issue and the notes. Total assets were S$1,240.4m and total liabilities S$988.1m; equity attributable to owners rose to S$240.4m from S$165.9m. Final dividend 0.38 cents proposed.
Guidance: Pawnbroking in Singapore and Malaysia expected to 'remain resilient' on steady demand for short-term financing; easing bank rates expected to lower financing costs; barring unforeseen circumstances the group expects to remain profitable in 2025.Next session (25 Feb): 5UF +1.7% · STI −0.3% · peers +0.0%
Q2 2025
1 Apr 2025 – 30 Jun 2025
5UF +10.0%STI −0.2%Peer median +22.6%Range S$0.11–S$0.13Close S$0.13
The tranche was sold to institutional and accredited investors with DBS as sole dealer and issued on 24 April 2025, fungible with the S$70m issued in September 2024. Proceeds are for general corporate purposes including refinancing and working capital.
Next session (15 Apr): 5UF +0.8% · STI +2.1% · peers +1.2%
Both are, with chairman Koh Wee Seng, the 'Koh siblings' named in the notes' change-of-shareholding clause. The new director joins the Remuneration Committee. The board stays at six with three independent directors.
Large price moves
39 Apr 2025 · −5% · index −2% · peers −2%
Q3 2025
1 Jul 2025 – 30 Sep 2025
5UF +67.0%STI +8.5%Peer median +54.2%Range S$0.12–S$0.23Close S$0.21
Retail rose 47.7% to S$319.2m, partly on Niessing; pawnbroking rose 29.7% to S$42.8m on the pledge book; secured lending rose to S$5.2m from S$2.2m. Operating expenses rose S$20.7m. Profit before tax was S$37.3m against S$18.0m and EPS 1.50 cents against 1.00. Operating cash flow was an outflow of S$34.8m on inventories and receivables, against S$28.8m of net financing including new notes. Total assets were S$1,288.8m and total liabilities S$1,013.2m; equity attributable to owners S$261.7m. The company said elevated gold prices had 'somewhat moderated' retail sales.
Guidance: Pawnbroking demand expected to remain steady; retail faces keen competition and cautious buyers at high gold prices; barring unexpected developments the group expects continued growth and to maintain profitability in 2025.Next session (12 Aug): 5UF +6.8% · STI −0.3% · peers +6.6%
Purchases were made under the mandate of 28 April 2025 (maximum 35,278,494 shares) across eight sessions and held in treasury. This was the company's first use of the mandate in the window; the moves of 21 and 22 August 2025 fell inside the purchase period.
The company said it was acting 'well ahead' of the September 2027 maturity to extend maturities and spread repayments, citing pledge-book growth in Singapore and Malaysia. After the exchange S$53.5m of the 2027 notes remained outstanding. An updated information memorandum for the S$300m MTN programme was filed the same morning.
The additional notes were sold on reverse enquiry, including from directors and controlling shareholders, with DBS as sole dealer, and consolidated with the S$36.5m issued under the exchange. The coupon is 1.15 points below the 2027 series (computed). Proceeds are for general corporate purposes including refinancing and working capital.
Next session (22 Oct): 5UF +12.2% · STI +0.3% · peers −1.1%
Large price moves
1222 Oct 2025 · +12% · index 0% · peers −1%
Q1 2026
2 Jan 2026 – 31 Mar 2026
5UF +42.6%STI +5.1%Peer median +54.8%Range S$0.21–S$0.38Close S$0.30
Both tranches were sold to institutional and accredited investors with DBS as sole dealer and are fungible with the S$75m issued in October 2025. The April tranche was issued on 29 April 2026 alongside an updated MTN information memorandum.
Next session (14 Jan): 5UF +0.0% · STI +0.1% · peers +1.5%
Retail rose 42.2%, pawnbroking 30.5% and secured lending 91.8%; the media release's segment table shows S$726.6m retail, S$148.6m pawnbroking and S$11.5m secured lending. Profit before tax rose to S$102.5m from S$45.2m on gross profit, other income and lower finance costs, after a S$8.0m loss on the hedge over the unredeemed pledge portfolio as gold surged, which the company said was offset by higher collateral values (S$110.5m excluding it). 2H2025 PATMI of S$52.8m was up 161%; EPS was 4.35 cents against 2.24. Cash was S$86.5m; operating cash flow was an outflow of S$7.8m against S$82.1m of net financing. Total assets were S$1,599.3m, including S$296.9m of secured-lending receivables held as agent for third-party investors with S$288.5m of matching loan payables; equity attributable to owners S$301.0m. The company said it would 'explore options to strengthen its equity base'. Released 07:47, before the open.
Guidance: 1H2026 expected to deliver a 'substantially stronger performance' than 1H2025; pawnbroking to maintain its growth trajectory on elevated gold prices; BigFundr to contribute further growth; Malaysia treated as a strategic growth market.Same session: 5UF +15.2% · STI −0.3% · peers −2.3%
The company cited PATMI growth from S$14.4m in FY2021 to S$80.7m in FY2025 and a one-month average market capitalisation of S$580.75m. On 12 March ACL cut the sale price to S$0.31, a 7.7% discount, citing 'the geopolitical situation and the recent trading prices', and sold the 10m shares for S$3.1m the same day, taking its stake from 71.33% to 70.79%. The application went in on 20 March, SGX gave in-principle approval on 30 March, shareholders passed the special resolution at an EGM on 28 April, and the transfer took effect on 4 May 2026.
Next session (5 Mar): 5UF +0.0% · STI +0.7% · peers −1.0%
Ion World holds the 35% of Maxion Holdings not already owned by Maxi Cash (Malaysia); Kedai Emas retails jewellery and Focus owns a property used by the group. The target group had pro-forma NTA of RM56.9m (S$18.0m) and FY2025 net profit of RM36.7m (S$11.6m), 11.32% of group net profit under Rule 1006, making it a discloseable transaction funded from cash and borrowings. Eight of fourteen vendors (51.04%) accepted at launch and the rest by 7 April. Completion on 26 June 2026 was at an adjusted RM147.3m (S$46.4m), with RM3.0m withheld for twelve months.
Next session (11 Mar): 5UF −2.9% · STI +0.1% · peers +3.0%
Large price moves
1323 Jan 2026 · +10% · index +1% · peers +5%
14week to 23 Jan 2026 · +15% · index +1% · peers +11%
1526 Jan 2026 · +13% · index −1% · peers +12%
1630 Jan 2026 · −8% · index −1% · peers −7%
1723 Feb 2026 · +10% · index +1% · peers +8%
1825 Feb 2026 · +15% · index 0% · peers −2%
19week to 27 Feb 2026 · +16% · index −1% · peers −5%
2025 Mar 2026 · +9% · index +1% · peers +7%
Q2 2026
1 Apr 2026 – 30 Jun 2026
5UF +18.3%STI +5.8%Peer median +1.0%Range S$0.31–S$0.46Close S$0.35
Figures are a preliminary estimate from unaudited management accounts. The company attributed the quarter to sustained demand across its brands and to growth in Malaysia. It said a capital raising would target growth in pawnbroking and secured lending and improve its capital structure, and flagged Middle East tensions and precious-metal volatility as the risks it was watching.
Guidance: 1H2026 expected to deliver a stronger performance than 1H2025, when profit before tax was S$37m.Next session (16 Apr): 5UF +13.6% · STI −0.3% · peers +2.6%
Announced after a trading halt on 14 May and lifted the next morning. The S$60.0m placement was on a best-efforts basis through DBS, OCBC, SAC Capital and UOB; the S$24.8m preferential offering was underwritten by SAC with ACL and Koh Wee Seng undertaking to take their entitlements. About 80% of proceeds was for general corporate activities including the pawnbroking and secured lending businesses and 18% for working capital and bank repayment. The placement closed on 25 May 'over 2 times covered', with placees including Eastspring, JPMorgan Asset Management, Lion Global and Value Partners; the preferential offering was 99.53% taken up and listed on 17 June, leaving ACL at 65.7%. By 8 July the proceeds were fully used: S$67.5m into secured lending and S$12.5m to repay bank borrowings.
Next session (15 May): 5UF +0.0% · STI −0.1% · peers −1.9%
He was appointed Finance Director on 30 September 2025 and is on garden leave. Oh Kwok Fon, previously Assistant Business Director, was redesignated Assistant Finance Director in the same filing; the 1H2026 media release lists him as Finance Director.
Large price moves
2116 Apr 2026 · +14% · index 0% · peers +3%
22week to 17 Apr 2026 · +22% · index 0% · peers +4%
Q3 2026
1 Jul 2026 – 21 Aug 2026 (part quarter)
5UF +3.9%STI +10.0%Peer median +3.3%Range S$0.34–S$0.39Close S$0.36
Retail rose 25.2% to S$399.6m, pawnbroking 29.3% to S$55.3m on the pledge book, and secured lending 76.1% to S$9.2m, mainly through BigFundr. Gross margin was 38.7% against 36.6%. Profit before tax rose to S$71.5m from S$37.3m after a S$5.2m hedging loss on the pledge hedge (S$76.7m excluding it); EPS 2.77 cents against 1.50. Operating cash flow was an outflow of S$131.8m on inventories and receivables, against S$134.7m of net financing including the S$84.8m equity raise and new notes; secured-lending receivables held for investors rose to S$367.9m from S$296.9m. Total assets were S$1,864.4m and total liabilities S$1,419.4m; equity attributable to owners S$426.1m. The media release put net debt to equity at 1.7 times against 2.1 at December, the store count at 118 and BigFundr funds under management up more than 25% since December.
Guidance: Barring unforeseen adverse developments the board 'remains optimistic' about FY2026; deployment of additional capital into secured lending expected to broaden recurring income in 2H2026.Next session (11 Aug): 5UF +1.3% · STI +1.0% · peers +0.6%
Declared with the 1H2026 results; record date 19 August 2026, paid 27 August 2026. The first dividend on the share base enlarged by the May equity raise.
Notes and sources
Share price record
How this section was built
The detector flagged 22 large moves in the window — 16 single sessions and 6 weekly windows — before any news was read. 1 market move, 8 sector moves; 13 are left over after both controls, unexplained by them. Of those, 3 followed a filing by timestamp, 2 coincided with one in the same session or week and 8 have nothing filed against them beyond routine notices and are recorded as unexplained rather than explained away.
This section records the 36-month price history and puts every large move through two subtractions and reports what is left over, not what caused it: first the Straits Times Index, then the median of the 3 listed comparisons — ValueMax, MoneyMax Financial Services and Taka Jewellery — which trade the same session. “Left over” is what survives both controls.
Each quarter panel pairs two records. Key developments are the filings that carry information — results, the BigFundr and Niessing transactions, the MTN exchange offers and taps, the Mainboard transfer, board and dividend events — with the figures as filed, the guidance given, the close on the day and how the reacting session traded against the controls; a filing after the 09:00 open is read against the next session. Large price moves are the threshold-detected sessions, detected before any news was read and dispositioned from the controls and the enumerated tape; rows with a written note carry a numbered pin, the rest are dots on the line.
How to read the tags.Market-wide and Sector-wide mean the index or the peer median moved with the share over the same session or week; Residual means the move is still large after both are subtracted. A residual is what is left over, not a cause: it does not establish that the company’s own news moved the price, and an unchanged or thinly traded price is not proof that no information arrived. Returns use the dividend-adjusted close; a filing released after the open is read against the next session.
Prices are Yahoo Finance daily closes for 5UF.SI, dividend-adjusted for returns; the announcement tape is every SGXNet broadcast by the issuer from 22 Aug 2023 to 21 Aug 2026, retrieved from the SGX announcements API v1.1 on 23 Aug 2026 with SGX broadcast times. A filing after the open is read against the next session.
Limitations bound every row above. The tape is the issuer's own SGXNet stream (209 broadcasts in the window) and the register was selected from it by the brief's rule, with one pre-window exception: the 1H2023 results of 10 August 2023 are carried as KD01 with a note because they are the baseline the first quarter of the chart trades against, and they are not on the tape. Broker notes, block trades and substantial-shareholder timing, trade press and index reviews were not examined, and a PDF-attachment sweep does not capture metadata-only announcements, so an unexplained move may reflect a disclosure outside this set. The parent, Aspial Corporation (SGX: A30, 65.7% holder after the June 2026 preferential offering), has its own disclosure stream that was swept only for items bearing on the subsidiary (interested-person transactions, the 2022 injection, litigation, its scrip dividend) and is not enumerated here; BigFundr has no separate stream, and the Malaysian filings of the Ion World group acquired in June 2026 were not retrieved (`research/entity-tape-register.json`). The peer control uses three SGX pawnbrokers (ValueMax T6I.SI, MoneyMax 5WJ.SI, Taka Jewellery 42L.SI); the map's 22 detected moves show wide dispersion between them, with Taka often flat while the other two moved together, so the sector read depends on a median of three.
A quarter shows only the columns it has. An empty developments column means: No filings beyond routine disclosures this quarter. An empty moves column means: No session cleared the large-move threshold this quarter.
The full move register — every large move and its market and sector controls
Every threshold-detected move in the window with its controls, dispositioned in the price-driver register; rows with a written note carry a numbered pin on the chart.
#
Session
5UF
STI
Peers
Left over
Control result
What the evidence supports
1
22 Aug 2023
+5.3%
+0.2%
+0.0%
+5.3%
Residual
The first session of the window: a 5.3% step from S$0.133 to S$0.140 on 8,000 shares, 0.05× median volume. The index rose 0.2% and none of the three peers moved. The tape is silent — the company's first broadcast in the window is the scrip-dividend notice of 21 September — and the nearest filing is the 1H2023 results of 10 August, eight sessions earlier. The close stayed at S$0.140 on no volume for the next three sessions and slipped 2.1% on 28 August. No filing explains it. ValueMax +0.0 · MoneyMax +0.0 · Taka +0.0
2
7 May 2024
+5.6%
−0.1%
+0.0%
+5.6%
Residual
A 5.6% rise from S$0.125 to S$0.132 on 14,700 shares, 0.09× median volume, the session after the shares went ex the 0.38-cent final dividend (the return series is adjusted for it). The index fell 0.1% and the peer median was flat (ValueMax +1.3%, MoneyMax flat, Taka −1.5%). The tape is silent from the annual report of 30 April to the Niessing acquisition announcement of 15 May, six sessions later. The next three sessions were −0.8%, flat and −1.5%, returning the close to S$0.129. No filing explains it. ValueMax +1.3 · MoneyMax +0.0 · Taka −1.5
3
9 Apr 2025
−5.1%
−2.2%
−2.0%
−3.1%
Market-wide
The tariff sell-off: the session sits inside the four in which the index fell 13.9%, 7.5% of it on 7 April alone. The shares fell 5.1% to S$0.112, the low of the window, on 9,200 shares, against the index's 2.2% and Taka's 12.0% that day (ValueMax −2.0%, MoneyMax flat); over 3 to 9 April they fell 5.9% to the index's 13.9%, and the next session they rose 4.5% with the index's 5.4%. No filing preceded the session: the AGM notice and annual report were broadcast at 07:47 and 07:48 on 11 April, two sessions later, and the S$20m notes tap was priced on 14 April. On the controls this is a market session with about three points left over on the day. ValueMax −2.0 · MoneyMax +0.0 · Taka −12.0
4
12 Aug 2025
+6.8%
−0.3%
+6.6%
+0.1%
Sector-wide
The session after the 1H2025 results, filed at 20:33 on 11 August after the close, so the rise followed them: revenue up 46.2% to S$367.2m and PATMI up 98% to S$27.9m, with the interim dividend held at 0.40 cents. The shares rose 6.8% to S$0.142 on 14.4m shares, 85× median volume and the second-heaviest session of the window, but ValueMax rose 6.6% and MoneyMax 12.0% the same session (Taka flat), so after the peer median 0.15 of a point is left; the index fell 0.3%. On the controls the session reads as sector, not company, even though the filing preceded it. The next three sessions gave back 4.9%, to S$0.135 on 15 August, before the run of 18–22 August. ValueMax +6.6 · MoneyMax +12.0 · Taka +0.0
5
21 Aug 2025
+9.2%
+0.3%
+1.2%
+8.0%
Residual
A 9.2% rise from S$0.142 to S$0.155 on 7.2m shares, 42× median volume, the highest close of the window to that date and the first clear of the S$0.112–0.142 band the shares had held since August 2023. The index rose 0.3% and the peer median 1.2% (ValueMax +1.2%, MoneyMax +5.4%, Taka flat), leaving about eight points. The only filings within three days were three daily buy-back notices — 100,000, 200,000 and 387,400 shares bought on 15, 18 and 19 August, 0.04% of the share count in total — and a director's notice of S$2.5m of the company's 2027 notes bought on 15 August; the 1H2025 results were seven sessions earlier. Volume had run at 10–13× median since 18 August and the three prior sessions were +1.5%, +0.7% and +2.9%; the next session rose a further 14.2%. No filing explains it. ValueMax +1.2 · MoneyMax +5.4 · Taka +0.0
6
22 Aug 2025
+14.2%
+0.5%
+1.8%
+12.4%
Residual
A second session of gains: 14.2% from S$0.155 to S$0.177 on 8.1m shares, 48× median volume, making 24.6% over two sessions. The index rose 0.5% and the peer median 1.8% (ValueMax +1.8%, MoneyMax +3.8%, Taka −2.7%), so about 12 points survive both controls. The only tape items within three days are three daily buy-back notices for 687,400 shares bought on 15, 18 and 19 August and a director's notice of S$2.5m of the company's 2027 notes bought on 15 August; the company reported no purchase for 20–22 August, and its next broadcast was the ex-date notice for the 0.40-cent interim dividend on 1 September. There was no reversal: the next three sessions were −3.4%, −0.6% and +1.2%, and 28 August closed higher at S$0.181. No filing explains it. ValueMax +1.8 · MoneyMax +3.8 · Taka −2.7
7
week to 22 Aug 2025
+31.1%
+0.5%
+11.7%
+19.4%
Residual
Weekly window, 15 to 22 August 2025, from S$0.135 to S$0.177, the largest weekly move in the register. The sessions were +1.5%, +0.7%, +2.9%, +9.2% and +14.2%. The index rose 0.5% over the week; the peer median rose 11.7% but the three peers diverged (ValueMax +11.7%, MoneyMax +22.7%, Taka −2.7%), so the sector control takes 12 of the 31 points and about 19 remain. The week included only daily buy-back notices, 687,400 shares in all, and a director's purchase of S$2.5m of the company's notes; the 1H2025 results had been filed on 11 August, four sessions before the window's base. The following week closed higher, at S$0.181 on 28 August, so none of the gain was given back. No filing explains it. ValueMax +11.7 · MoneyMax +22.7 · Taka −2.7
8
3 Sep 2025
+7.7%
−0.2%
+1.8%
+5.9%
Residual
A 7.7% rise from S$0.182 to S$0.196 on 10.7m shares, 63× median volume, to a new high for the window. The index fell 0.2% and the peer median rose 1.8% (ValueMax +1.8%, MoneyMax +6.7%, Taka −0.7%), leaving about six points. The filings within three days were the ex-date notice for the 0.40-cent interim dividend declared with the August results (1 September, 17:51), a buy-back notice for 500,000 shares bought on 2 September and, after the close, one for 57,500 shares bought on the day; the company bought a further 1.1m shares at S$0.191–0.192 the next session, when the shares fell 1.5%. The move was not reversed: 8 and 9 September added 6.1% and 7.1%, the start of the week in which the peer median rose 15.4%. No filing explains it. ValueMax +1.8 · MoneyMax +6.7 · Taka −0.7
9
week to 12 Sep 2025
+20.8%
+0.9%
+15.4%
+5.4%
Sector-wide
Weekly window, 5 Sep to 12 Sep: Against an index move of +0.9% and a peer median of +15.4%, about 5 points are left over. Sector-wide move; peers moved with it. ValueMax +15.7 · MoneyMax +15.4 · Taka +4.0
10
week to 19 Sep 2025
−17.9%
−1.0%
−14.6%
−3.3%
Sector-wide
Weekly window, 12 Sep to 19 Sep: Against an index move of −1.0% and a peer median of −14.6%, about 3 points are left over. Sector-wide move; peers moved with it. ValueMax −14.6 · MoneyMax −16.2 · Taka −0.6
11
24 Sep 2025
+10.0%
−0.3%
+2.2%
+7.8%
Residual
A 10.0% rise from S$0.200 to S$0.220 on 10.1m shares, 60× median volume. The index fell 0.3% and the peer median rose 2.2% (ValueMax +3.3%, MoneyMax +2.2%, Taka flat), leaving about eight points. The only filing in the window was the daily buy-back notice broadcast at 22:45 the previous evening, recording 3,023,800 shares bought on 23 September at S$0.198–0.205 — the largest purchase under the mandate, 0.16% of the share count, and the last of the programme; no purchase was reported for 24 September. Two-thirds of the move was reversed within two sessions, −4.5% and −2.4% to S$0.205, and the close held S$0.205–0.210 to the end of the month. No filing explains it. ValueMax +3.3 · MoneyMax +2.2 · Taka +0.0
12
22 Oct 2025
+12.2%
+0.3%
−1.1%
+13.3%
Residual
The session followed a filing at 22:04 the previous evening pricing S$38.5m of new 5.10% notes due 2029 at par, sold on reverse enquiry, with directors, controlling shareholders and their associates allocated about 13% of the tranche and 29.7% of the enlarged S$75m series; the exchange offer that created the series had closed on 17 October with S$36.5m accepted. The shares rose 12.2% to S$0.230, the highest close since 12 September, on 8.5m shares, 50× median volume. The index rose 0.3% and the peer median fell 1.1% (ValueMax −2.5%, MoneyMax −1.1%, Taka flat), so about 13 points survive both controls. The filing carries no trading figure, and the gain was given back within six sessions: −4.3% the next day, −6.5% on 28 October, and a close of S$0.205 on 30 October, level with the close before the move. ValueMax −2.5 · MoneyMax −1.1 · Taka +0.0
13
23 Jan 2026
+10.2%
+1.3%
+4.9%
+5.3%
Residual
A 10.2% rise from S$0.245 to S$0.270 on 7.2m shares, 43× median volume, to a new high for the window. The index rose 1.3% and all three peers rose — ValueMax 4.0%, MoneyMax 4.9%, Taka 7.1% — so after the peer median about five points remain. The filings within three days were the closing notice for the S$25m tap of the 5.10% notes due 2029 (20 January, 18:00; priced on 13 January) and a director's notice of S$3.25m of those notes bought on 20 January; neither carries a trading figure. The next session the shares rose a further 13.0% with ValueMax and MoneyMax up 12.4% and Taka 23.2%, a sector session on the controls, and 30 January gave back 8.2% alongside the peers. No filing explains the 23 January residual. ValueMax +4.0 · MoneyMax +4.9 · Taka +7.1
14
week to 23 Jan 2026
+14.9%
+0.9%
+11.0%
+3.9%
Sector-wide
Weekly window, 16 Jan to 23 Jan: Against an index move of +0.9% and a peer median of +11.0%, about 4 points are left over. Sector-wide move; peers moved with it. ValueMax +6.6 · MoneyMax +24.0 · Taka +11.0
15
26 Jan 2026
+13.0%
−0.6%
+12.4%
+0.6%
Sector-wide
Against an index move of −0.6% and a peer median of +12.4%, about 1 points are left over; 45.0× median volume. Sector-wide move; peers moved with it. ValueMax +12.4 · MoneyMax +12.4 · Taka +23.2
16
30 Jan 2026
−8.2%
−0.5%
−7.1%
−1.1%
Sector-wide
Against an index move of −0.5% and a peer median of −7.1%, about 1 points are left over; 22.1× median volume. Sector-wide move; peers moved with it. ValueMax −4.1 · MoneyMax −9.6 · Taka −7.1
17
23 Feb 2026
+9.5%
+0.5%
+8.2%
+1.3%
Sector-wide
Against an index move of +0.5% and a peer median of +8.2%, about 1 points are left over; 45.7× median volume. Sector-wide move; peers moved with it. ValueMax +9.8 · MoneyMax +8.2 · Taka +2.3
18
25 Feb 2026
+15.2%
−0.3%
−2.3%
+17.4%
Residual
The session after the FY2025 results, filed at 07:47 on 25 February before the open, so the rise followed them: revenue up 41.3% to S$830.1m and PATMI up 135% to S$80.7m, the second-half dividend doubled to 0.80 cents, and a statement that the company would 'explore options to strengthen its equity base'. The shares rose 15.2% to S$0.380, a new high for the window, on 15.99m shares — the heaviest session of the three years and 94.6× median volume. The index fell 0.3% and all three peers fell (ValueMax −3.1%, MoneyMax −1.6%, Taka −2.3%), so about 17 points survive both controls. The two prior sessions were +9.5%, shared with the peers, and −4.3%; the next session gave back 5.3%, and the close five sessions later, S$0.370 on 3 March, was 2.6% below the results-day close and 12.1% above the close before it. ValueMax −3.1 · MoneyMax −1.6 · Taka −2.3
19
week to 27 Feb 2026
+15.9%
−0.5%
−4.9%
+20.8%
Residual
Weekly window, 20 to 27 February 2026, from S$0.315 to S$0.365. The week included the FY2025 results, filed at 07:47 on 25 February (revenue up 41.3% to S$830.1m, PATMI up 135% to S$80.7m, total dividend 1.20 cents against 0.78), and the results session accounts for the whole move: the five sessions were +9.5%, −4.3%, +15.2%, −5.3% and +1.4%. The index fell 0.5% over the week and the peer median fell 4.9% (ValueMax −8.2%, MoneyMax −4.9%, Taka +2.3%), leaving about 21 points, the largest residual in the register. The 23 February rise was shared with ValueMax (+9.8%) and MoneyMax (+8.2%); the results session was not. ValueMax −8.2 · MoneyMax −4.9 · Taka +2.3
20
25 Mar 2026
+8.5%
+0.9%
+7.0%
+1.5%
Sector-wide
Against an index move of +0.9% and a peer median of +7.0%, about 1 points are left over; 18.9× median volume. Sector-wide move; peers moved with it. ValueMax +7.0 · MoneyMax +7.0 · Taka −0.5
21
16 Apr 2026
+13.6%
−0.3%
+2.6%
+11.1%
Residual
The session after the 1Q2026 business update, filed at 17:23 on 15 April after a flat close, so the rise followed it: revenue of about S$247m, up 48%, and profit before tax of about S$40m, up 140%, on the company's preliminary figures, with a statement that it was evaluating equity and/or debt fund-raising. The shares rose 13.6% to S$0.375 on 8.8m shares, 52× median volume. The index fell 0.3% and the peer median rose 2.6% (ValueMax +5.4%, MoneyMax flat, Taka +2.6%), leaving about 11 points. There was no reversal: the next four sessions were +4.0%, +5.1%, +7.3% and +3.4%, to the window high of S$0.455 on 22 April, 37.9% above the close before the filing. ValueMax +5.4 · MoneyMax +0.0 · Taka +2.6
22
week to 17 Apr 2026
+21.9%
+0.2%
+4.4%
+17.5%
Residual
Weekly window, 10 to 17 April 2026, from S$0.320 to S$0.390. The week included the 1Q2026 business update, filed at 17:23 on 15 April (revenue about S$247m, up 48%; profit before tax about S$40m, up 140%), and the annual report and AGM notice broadcast on the morning of 13 April; the sessions were −1.6%, +4.8%, flat, +13.6% and +4.0%, so the two sessions after the update account for 18 of the 22 points. The index rose 0.2% over the week and the peer median 4.4% (ValueMax +4.4%, MoneyMax +8.6%, Taka +0.5%), leaving about 17 points. The 17 April close of S$0.390 was the first above the S$0.380 of the FY2025 results day; the fund-raising the update had flagged was announced on 14 May as an S$84.8m placement and preferential offering at S$0.402 a share. ValueMax +4.4 · MoneyMax +8.6 · Taka +0.5
Key developments: sources, timing and notes
10 Aug 2023 · 1H2023 results: revenue up 62.0% to S$228.8m on the jewellery business injected in 2022, profit before tax S$12.4m against S$11.5m.ResultsFiled before the price window opens on 22 Aug 2023; no reaction session is computed.Source: Results announcement, 10 Aug 2023 (issuer IR page; not on the tape)
3 Oct 2023 · Ex-dividend: interim FY2023 dividend of 0.40 cents per share, with a scrip election.DividendSource: Scrip dividend notice, 21 Sep 2023
23 Feb 2024 · FY2023 results: revenue up 47.8% to S$471.6m and PATMI up 20% to S$19.2m; total dividend 0.78 cents against 1.05.ResultsReaction (next session, 26 Feb): 5UF −1.6% · STI −0.4% · peers +0.0% · 9.3× median volumeSource: SGX announcement, 23 Feb 2024
23 Feb 2024 · BigFundr becomes a 70%-owned subsidiary: a further 55% bought from Trinity House Capital for S$2.72m.Corporate actionReaction (next session, 26 Feb): 5UF −1.6% · STI −0.4% · peers +0.0% · 9.3× median volumeSource: SGX announcement, 23 Feb 2024 · Rule 706A announcement, 25 Feb 2026
15 May 2024 · Niessing Group to be bought from parent Aspial Corporation for S$18.0m, settled in 140,625,000 new shares at S$0.128.Corporate actionReaction (next session, 16 May): 5UF +0.0% · STI +0.5% · peers +0.0% · 0.2× median volumeSource: SGX announcement, 15 May 2024 · Completion announcement, 8 Jul 2024
12 Aug 2024 · 1H2024 results: revenue up 9.8% to S$251.2m and PATMI up 51% to S$14.1m; interim dividend held at 0.40 cents.ResultsReaction (next session, 13 Aug): 5UF −1.6% · STI +0.7% · peers −1.2% · 2.8× median volumeSource: SGX announcement, 12 Aug 2024
21 Aug 2024 · Rights issue: one-for-five, renounceable and non-underwritten, up to 311,843,500 shares at S$0.12 to raise up to S$37.2m net.Corporate actionReaction (next session, 22 Aug): 5UF −1.6% · STI −0.0% · peers +0.0% · 9.9× median volumeSource: SGX announcement, 21 Aug 2024
30 Oct 2024 · Rights issue closes 95.2% subscribed: 296,979,393 shares issued for S$35.4m net, of which ACL and the directors took 242,807,895.Corporate actionReaction (next session, 1 Nov): 5UF −0.8% · STI −0.1% · peers +1.5% · 5.2× median volumeSource: SGX announcement, 30 Oct 2024
24 Feb 2025 · FY2024 results: revenue up 24.6% to S$587.6m and PATMI up 79% to S$34.3m; EPS 2.24 cents; total dividend 0.78 cents.ResultsReaction (next session, 25 Feb): 5UF +1.7% · STI −0.3% · peers +0.0% · 19.0× median volumeSource: SGX announcement, 24 Feb 2025
14 Apr 2025 · S$20m tap of the 6.25% notes due 2027 priced at 100.50, taking the series to S$90m.Corporate actionReaction (next session, 15 Apr): 5UF +0.8% · STI +2.1% · peers +1.2% · 4.3× median volumeSource: SGX announcement, 14 Apr 2025 · Closing announcement, 24 Apr 2025
11 Aug 2025 · 1H2025 results: revenue up 46.2% to S$367.2m and PATMI up 98% to S$27.9m; interim dividend 0.40 cents.ResultsReaction (next session, 12 Aug): 5UF +6.8% · STI −0.3% · peers +6.6% · 28.7× median volumeSource: SGX announcement, 11 Aug 2025
6 Oct 2025 · Exchange offer: holders of the S$90m 6.25% notes due 2027 invited to swap into new 5.10% notes due 2029; S$36.5m accepted by 17 October.Corporate actionReaction (same session): 5UF +2.3% · STI +0.2% · peers +2.1% · 1.1× median volumeSource: Exchange offer notice, 6 Oct 2025 · Exchange offer results, 17 Oct 2025
21 Oct 2025 · S$38.5m of new 5.10% notes due 2029 priced at par, taking the Series 005 issue to S$75m on 29 October 2025.Corporate actionReaction (next session, 22 Oct): 5UF +12.2% · STI +0.3% · peers −1.1% · 2.7× median volumeSource: SGX announcement, 21 Oct 2025 · Closing announcement, 29 Oct 2025
25 Feb 2026 · FY2025 results: revenue up 41.3% to S$830.1m and PATMI up 135% to S$80.7m; second-half dividend doubled to 0.80 cents, total 1.20 cents against 0.78.ResultsReaction (same session): 5UF +15.2% · STI −0.3% · peers −2.3% · 11.1× median volumeSource: SGX announcement, 25 Feb 2026 · Media release, 25 Feb 2026
4 Mar 2026 · Ex-dividend: second interim FY2025 dividend of 0.80 cents per share, double the 0.40 cents paid for 1H2025.DividendSource: Dividend announcement, 25 Feb 2026
15 Apr 2026 · 1Q2026 business update: revenue about S$247m (up 48%) and profit before tax about S$40m (up 140%); the company is evaluating equity and/or debt fund-raising.Business updateReaction (next session, 16 Apr): 5UF +13.6% · STI −0.3% · peers +2.6% · 3.5× median volumeSource: SGX announcement, 15 Apr 2026
7 Aug 2026 · 1H2026 results: revenue up 26.4% to S$464.2m and PATMI up 88% to S$52.4m; interim dividend raised 125% to 0.90 cents.ResultsReaction (next session, 11 Aug): 5UF +1.3% · STI +1.0% · peers +0.6% · 5.8× median volumeSource: SGX announcement, 7 Aug 2026 · Media release, 7 Aug 2026
These comparisons reuse evidence from other covered companies when a specific economic mechanism connects the source to this company; sector labels and apparent relatedness are not the test. Period, definition, geography, business mix and reporting perimeter are checked, and the external evidence remains a lead until this company's own disclosure confirms it.
Every other test on this page waits for the company to file. These do not. Each row is a series you can look up yourself, free, today — with the level this reading was built against, the levels that would put it in question, and what the series cannot tell you.
The headline gold price, in US dollars per troy ounce. It is an OTC/CFD market reference, not an official benchmark. Trading Economics (OTC/CFD market reference; LBMA benchmark averages used as the anchors)
3,432 and 2,386 US$/oz, on a move below — currently between the assumed level and the watch level
How often to look
monthly (the series prints daily)
What it points to. Gold is the master variable behind pledge ticket size, retail demand, retail inventory value and redemption behaviour: four exposures on one factor.
Direction only — this pack does not carry a coefficient from this series to reported earnings.
What it cannot tell you. Gold sets the size of the loan advanced against a pledge and the value of metal inventory; it does not set the number of pledges or the footfall through the shops. A rally alongside falling volumes can leave interest income flat. The level here is an OTC/CFD market reference, while the anchors are LBMA benchmark annual averages, so read the gap between them as approximate at the margin, never to the dollar.
Settled by FY2026 results and segment note, due 2027-02-28. Lead time: one pledge or stock cycle, roughly one to six months.
property-backed lending (BigFundr) — nothing public to watch
Searched the Monetary Authority's statistics, the land authority's price and rental indices and the accounting and corporate regulator's registers for a series covering the developer-loan book this segment lends against. Nothing public reports at that perimeter: the notes are privately placed against individual projects, so the first observable is the issuer's own expected-credit-loss line.
Watchlist reviewed on 2026-09-24; each observation has its own date above. This watchlist date does not change the company research cutoff. A series moving past a level is a reason to re-read the case, not a recommendation. The same series across every company covered: what you can watch.
Download
A print-ready PDF of this page, for reading away from the screen: Aspial Lifestyle evidence library (PDF). It carries the same content as this page — the segment economics, the 1H2026 update, the track record, funding, five years of cash, the earnings drivers, peer context, the red-flags scorecard, the share price and the credit evidence update — and the same omissions: no rating, no fair value, no forecast.
The 20 Aug 2026 source refresh opened 58 canonical PDFs and 25 newly recovered PDFs. It recovered the 12 Jun 2012 Maxi-Cash IPO offer document, FY2014 and FY2016-FY2020 annual reports, the 2024 rights OIS, the operative 2024 MTN Information Memorandum and its 2025-2026 supplements and pricing chain, missing AGM minutes, and current peer primary filings. FY2012, FY2013 and FY2015 standalone annual reports remain unresolved. A SGX attachment FileID sweep is not a complete announcement tape, so metadata-only events were reconciled separately; this added the 10 Jul 2026 appointment of Pan Pei Say and board reconstitution and confirmed the 11 Aug 2026 Koh Wee Seng interest filing as the last issuer event found before cut-off. Research is AI-assisted with human verification.
Corrections log. 16 Aug 2026 — pawn interest cap. The underlying research pack stated the Singapore cap as "1.5% first month, then 1.0%/month". That is the pre-2015 regime. The Pawnbrokers Act 2015 cap is a flat 1.5% per month (verified against the Ministry of Law's Registry during the ValueMax work), and the licence count is 244 as at 1 Aug 2026. Resolved 17 Aug 2026: the pack has been rebuilt and now carries the corrected cap throughout, not merely a note on this page. The correction sharpens the reading rather than softening it — against a flat ceiling, the company's disclosed 1.5–2.0% for months two to seven means the Singapore book sits exactly at the cap, so pricing is not a lever and growth must come from ticket size, unit count and share. 17 Aug 2026 — parent's stake on the 2022 injection. Both earlier packs carried 71.78%. That figure appears only in the 7 July 2022 media release, where it is the expected stake; the completion announcement records the realised figure as 70.77% (975,819,010 of 1,378,800,475 shares, R). An expectation had been quoted as an outcome. Today's stake is 65.7% after the June 2026 offering. 17 Aug 2026 — the Malaysian acquisition, framing withdrawn. Earlier drafts characterised the S$46.4m Ion World transaction as expensive on a price-to-book basis with no independent valuation commissioned. The no-valuation point stands as a disclosure fact, but the framing was unfair: the announcement's own illustrative financial effects show the transaction increasing earnings per share from 4.35 to 4.85 cents — roughly 5.0x earnings on the consideration — and the sale agreement permits completion up to 90 days before payment, which explains its absence from the interim accounts. Price-to-book was the wrong lens. The error came from reading a 647-line announcement only as far as its consideration section; the refuting paragraph was in the same document. 16 Sep 2026 — net debt, FY2020 to FY2022. The track-record table’s net-debt row excluded the S$45.25m of medium-term notes outstanding at the end of FY2020 and FY2021 — a residue of the v1 pack that the funding-structure chart above already records as corrected. On the row’s own basis (total interest-bearing loans and notes, less cash and bank balances) FY2020 is S$287.0m (S$310.770m less S$23.816m) and FY2021 is S$361.8m (S$381.547m less S$19.735m), against S$241.7m and S$316.6m as published. FY2022 is restated from S$476.9m to S$477.0m, a rounding slip on S$476.963m (S$507.776m less S$30.813m). FY2023 onwards are unchanged and were already on the inclusive basis. Figures re-keyed from the FY2021, FY2022 and FY2025 annual reports and the 1H2026 interim.
No rating, fair value, price target, expected return or recommendation is published here; all rated views remain private. Information cut-off 24 August 2026 · Next scheduled update after FY2026 results (~late Feb 2027) or on a material announcement.
Reader questions & corrections
Ask about this company, challenge a source or suggest a factual correction. Only selected questions that SMID Research has reviewed and answered are published.
Submissions are private by default. Your email is encrypted and never published. Please do not send confidential or inside information, allegations about individuals, promotions, or requests for personalised investment advice.
Behind the lock
A complete private working view of this company exists beyond this page: the full initiation note as a PDF, the financial model workbook with live formulas, the presentation deck, scenario and valuation work, and the independent-review artifacts. It is maintained in the author's vault for the author's own records — not published, and not available for sharing. This page carries everything that is public.
These bounded retrospective corrections clarify specific published facts or calculations. They retain each report's existing research cutoff and do not represent a full refresh or a finding that all possible issues are resolved.
Aspial Lifestyle
Verified Fact. Current loans at 30 June 2026 are S$567.1m, not the December 2025 comparator of S$530.8m. Gross proceeds of S$84.8m were from a placement and preferential offering. Sources: Source. Limitation: This does not establish committed undrawn facilities.
Verified Fact. The price-section peer labels now identify ValueMax as SGX T6I and Taka Jewellery as SGX 42L. Source basis: SGX issuer and securities identifiers. Limitation: This corrects the displayed ticker labels, not the underlying peer return series.
Transcripts
Find available event transcripts in the transcript library.
· Update and Upsize of Multicurrency MTN Programme · SGX
Earlier announcements, before 24 August 2026 (37)
· Aspial Lifestyle Reports Record 1H2026 Revenue of S$464.2 Million and Raises Interim Dividend by 125% — AI summary: profit after tax rose 89% to S$55.0 million · SGX
· Unaudited Condensed Interim Financial Statements for the Six Months Ended 30 June 2026 · SGX
· Changes to the Board and Reconstitution of the Board Committees · SGX
· Equity Fund Raising – Utilisation of Proceeds from the Equity Fund Raising — AI summary: net proceeds from the Equity Fund Raising have been fully utilised · SGX
· Listing of Preferential Offering Shares Announcement · SGX
· Issue of Private Placement Shares Announcement · SGX
· Renounceable Non-Underwritten Rights Issue – Utilisation of Proceeds from the Rights Issue · SGX
· Effective Date of the Transfer of Listing from Catalist to the Mainboard of the SGX-ST (SGX-ST) · SGX
· Business Update for the First Quarter Ended 31 March 2026 · SGX
· Acquisition of Shares in Ion World Sdn. Bhd., Kedai Emas Ion Sdn. Bhd. and Focus Resources Sdn. Bhd. by a Wholly-Owned Subsidiary of the Company as a Discloseable Transaction – Update Announcement · SGX
· The Proposed Transfer from the Catalist to the Mainboard of the SGX-ST (SGX-ST) (the Proposed Transfer) · SGX
· The Proposed Transfer from the Catalist to the Mainboard of the SGX-ST (SGX-ST) (the Proposed Transfer) · SGX
· Completion of the Proposed Sale of Vendor Shares — AI summary: interest in the Company has decreased from 71.33% to 70.79% · SGX
· Aspial - Addendum to Transfer Announcement · SGX
· The Proposed Transfer from the Catalist to the Mainboard of the SGX-ST (SGX-ST) (the Proposed Transfer) and the Proposed Sale of Vendor Shares · SGX
· Aspial Lifestyle Limited FY2025 profit after tax soars 142% YoY to a record S$84 million · SGX
· Unaudited Condensed Interim Financial Statements for the Six Months and Full Year Ended 31 December 2025 · SGX
· Update of the Information Memorandum Dated 12 July 2024 in Relation to the S$300,000,000 Multicurrency MTN Programme · SGX
· Unaudited Condensed Interim Financial Statements for the Six Months Ended 30 June 2025 · SGX
· Changes to the Board and Re-Composition of the Board Committees · SGX
· Aspial Series 004 Tap-Closing Announcement · SGX
· Unaudited Condensed Interim Financial Statements for the Six Months and Full Year Ended 31 December 2024 · SGX
· Unaudited Condensed Interim Financial Statements for the Six Months Ended 30 June 2024 · SGX
· Completion of the Proposed Re-Organisation of Niessing Group Pte. Ltd. as a Discloseable Transaction and an Interested Person Transaction · SGX
· Proposed Allotment of 140,625,000 New Ordinary Shares in the Capital of the Company (Consideration Shares) to Aspial Corporation Limited (Acl) - Receipt of Listing and Quotation Notice · SGX
· Changes to the Board and Re-Composition of the Board Committees · SGX
· Proposed Re-Organisation of Niessing Group Pte. Ltd. as a Discloseable Transaction and an Interested Person Transaction · SGX
· Increase in Shareholding of an Associated Company · SGX
· Unaudited Condensed Interim Financial Statements for the Six Months and Full Year Ended 31 December 2023 · SGX
· Scrip Dividend Scheme Allotment and Issuance of New Shares · SGX
Titles are from the linked SGX filing, with common words abbreviated. Summaries are written by AI and may contain inaccuracies; refer to the original announcement. Items after 24 August 2026 are not reflected in this page's analysis; earlier items are listed for reference, may not be discussed in it, and may have been updated by later announcements.