Listed in Singapore · Jewellery wholesale, retail & pawnbroking
SGX: 42L · Information cut-off 28 August 2026
Investor snapshot
Business model
Taka Jewellery sells jewellery through wholesale, exhibitions and retail, and deploys a separately funded pawnbroking and secured-lending book.
Latest figures
In FY2026 financial-services assets rose 59.3% year on year and 18.0% half on half to S$106.1m; derived second-half PBT rose 79.6% and annualized PBT ROAA improved to 5.6%, but operating cash flow remained negative S$15.4m and current loans rose to S$97.2m.
Main risk
The central risk is that nominal collateral and ticket growth is mistaken for market-share growth while the book absorbs liabilities and capital faster than cash earnings.
Next proof
The next test is 1H FY2027 book growth, pledge or average-ticket evidence, PBT ROAA and verified facility headroom.
Share price
S$0.196 (E, 28 Aug 2026 close)
Book value
29.0¢ at 30 Jun 2026 · 0.68× (D)
Shares
559,406,000 ex-treasury (R)
Former name
TLV Holdings — renamed 2022
Public float
25.45% — Rule 723 basis (R)
Reporting
Half-yearly · FY ends 30 June
This page carries no rating, no fair value and no recommendation. Information cut-off: 28 August 2026. FY2026 full-year results and the refreshed factual catalyst/falsifier set are incorporated; the integrated model and decision have been rebuilt behind the private vault boundary. Evidence tags: R = primary source · D = derived · E = external/unverified · O = opinion. See methodology.
Evidence balance
The live questionDo jewellery sales and pledge redemptions convert to cash fast enough to fund the inventory and lending book that growth keeps absorbing?FY2026 is now reported rather than guided: revenue and profit both rose sharply while operating cash flow stayed negative and current loans and borrowings nearly doubled, so funding, not growth, is the open question.
What improved
FY2026 revenue rose 59% to S$284.0m and profit after tax 81% to S$22.7m. Financial-services segment assets reached S$106.1m at 30 June 2026, 59.3% above a year earlier, and the derived second-half annualised pre-tax return on average segment assets improved to 5.6%.
What became more demanding
Operating cash flow was negative S$15.4m as receivables and prepayments absorbed S$50.5m and inventory S$8.9m; current loans rose to S$97.2m from S$49.5m. Net segment capital of S$47.1m was 44.4% of financial-services assets, so each extra dollar of book needs roughly 56 cents of liabilities.
Strongest alternative explanation
The absorption could be deliberate deployment rather than weakening collection: 87.7% of the FY2025 receivables build was the loan book, not unpaid invoices, and rising gold mechanically inflates inventory value, so a growing collateralised book would be consistent with the cash outflow.
The decisive missing fact
The filings disclose no pawn-book flow bridge - originations, redemptions, pledge counts, average ticket and collateral realisation are all absent - so FY2027 interim segment and cash disclosures, with verified facility headroom, would settle whether the book seasons or merely grows.
Drawn from the evidence on this page: the improvement, the constraint, the benign reading and the fact that would settle it. It states no view on the shares.
About the private research record
Also on file behind the rated view 🔒 (author-only): the refreshed integrated write-up, formula-linked financial/valuation/credit workbook, canonical model outputs and independent-review disposition. Kept private; not for distribution.
On this page
Business anatomy · where revenue and profit come from
Jewellery sales and pawn lending use different cash engines
Wholesale and retail turn gold and gemstones into product sales; financial services advances cash against pledged collateral and collects interest.
Compare the business or contract models; each card names its operating role and economic consequence.
Inventory engineJewellery stock
Design, make and merchandise
What happensGold, gemstones and designs become collections held for wholesale and retail sale.
Capital at workInventory absorbs cash until a trade or retail buyer purchases the piece.
Route to marketProduct sales
Sell through fairs and stores
What happensCollections reach trade customers at fairs and consumers through retail stores.
Revenue triggerJewellery buyers pay the sale price; Taka retains the product margin.
Business linePawn counter
Appraise the security
What happensA separate borrower pledges jewellery or other approved security and receives a cash advance.
How it earnsThe collateral protects the loan rather than becoming an immediate product sale.
Cash conversionLoan cash
Collect interest or recover
What happensA redeemed pledge returns to the borrower; an unredeemed pledge follows the permitted recovery process.
Cash triggerFinancial-services revenue comes from interest and related secured-lending income.
Original SMID Research comic. AI-assisted, analyst-directed monochrome artwork depicts the evidenced operating steps of Taka Jewellery Holdings; deterministic captions and dated mix figures state the economics using issuer disclosures available to 2026-08-28. The drawings are representative—not issuer artwork, an exact product or site design, a statement of scale, or a company forecast.
Investor translation
What matters after the operating picture
Four questions connect the business model to cash and balance-sheet risk. This is a factual reading aid, not a valuation or recommendation.
Value lever
Jewellery earnings and pawn-book returns valued separately after shared funding and overhead.
Cash bottleneck
Gold inventory and pawn principal absorb cash before a sale, redemption or auction.
Balance-sheet pressure
Realizable collateral and committed funding no longer cover short-term debt and inventory needs.
Inventory engine · Design, make and merchandise Gold, gemstones and designs become collections held for wholesale and retail sale. Capital at work: Inventory absorbs cash until a trade or retail buyer purchases the piece.
Route to market · Sell through fairs and stores Collections reach trade customers at fairs and consumers through retail stores. Revenue trigger: Jewellery buyers pay the sale price; Taka retains the product margin.
Business line · Appraise the security A separate borrower pledges jewellery or other approved security and receives a cash advance. How it earns: The collateral protects the loan rather than becoming an immediate product sale.
Cash conversion · Collect interest or recover A redeemed pledge returns to the borrower; an unredeemed pledge follows the permitted recovery process. Cash trigger: Financial-services revenue comes from interest and related secured-lending income.
1 · What the company is
Three reported segments. Wholesale & Exhibitions sells jewellery through international trade fairs; Retail runs the Singapore store network; Financial Services is a pawnbroking and secured-lending book operating under the Pawnbrokers Act 2015. The group listed on Catalist in September 2015 as TLV Holdings and renamed to Taka Jewellery in 2022. (R)
Two structural breaks that corrupt any naive series
The fiscal year-end moved from 31 March to 30 June, making FP2020 a fifteen-month financial period (1 Apr 2019 – 30 Jun 2020). The company's own label is FP2020, not FY2020. Its headline commentary compares across that break without adjusting: revenue "dipped 4%" to S$114.1m against a twelve-month S$119.0m — on a like-for-like basis the decline is nearer 23%. Separately, segmentation changed from two reported segments to three in FY2018, when Financial Services was carved out of the old "Retail and Pawnbroking". The restatement at 1 April 2017 reconciles exactly: Retail 64,900 + Financial Services 11,263 = 76,163. (R/D)
2 · Segment economics — nine years, one pattern
Return on average segment assets, annualised
Wholesale & Exhib.
Retail
Financial Services
FY2018
11.9%
5.2%
4.6%
FY2019
12.0%
3.2%
3.8%
FP2020 (15m)
4.5%
1.9%
1.8%
FY2021
7.6%
4.1%
2.3%
FY2022
16.5%
4.2%
2.1%
FY2023
21.6%
5.2%
3.1%
FY2024
18.5%
6.3%
3.2%
FY2025
21.6%
6.1%
2.7%
1H FY2026 (annualised)
22.6%
11.8%
3.9%
R (segment notes, AR-FY2016 to AR-FY2025 and 1H FY2026 filing), returns recomputed on average assets (D). All eleven periods reconcile segment-to-group on revenue, assets, liabilities and pre-tax profit with residual exactly zero.
That historical ceiling has now broken. Financial Services earned 5.0% PBT on average segment assets in FY2026; the derived half-year path improved from 3.9% annualised in 1H to 5.6% in 2H. Segment assets reached S$106.1m at 30 June 2026, 59.3% above June 2025 and 18.0% above December. The segment is still less efficient than Wholesale and Retail, but the latest return improvement means the old statement that it had never exceeded 4.6% is no longer true. (R/D)
The obvious objection, tested — and the peer check that reframes it
A pawn book is levered, so gross-asset returns may flatter the unlevered segments. On net segment assets, FY2025: Wholesale 33.9%, Retail 10.3%, Financial Services 5.6% — leverage-adjusting lifts all three and the ordering is unchanged. But the peer check matters more: ValueMax shows the same structural shape, with retail and trading earning 41.0% of segment profit on 9.5% of segment assets while moneylending earned 32.2% of profit on 49.9% of assets (R, T6I FY2025). The pattern is industry-structural, not a Taka-specific error. The defensible claim is narrower: Taka's lending arm is sub-scale and roughly half as capital-efficient as a peer running the same model — asset-share-to-profit-share conversion of about 0.29 against ValueMax's 0.65. (D/O)
2A · Funded-asset runway — faster, but not a clean market-share win
Financial-services revenue was S$3.306m in 1H FY2026 and a derived S$4.534m in 2H, up 37.1% half on half. PBT rose from S$1.535m to a derived S$2.757m, up 79.6%, while segment assets rose 18.0%. Revenue and profit therefore grew faster than the average book in the second half. That is the strongest evidence that the larger book is seasoning better rather than merely getting larger. (R/D)
30 Jun 2026 funded-asset proxy
31 Dec 2025
30 Jun 2026
H/H
Definition and limit
Taka financial-services segment assets
S$89.9m
S$106.1m
+18.0%
Closing segment-asset stock
ValueMax pawn + moneylending segment assets
S$1,288.7m
S$1,477.1m
+14.6%
Closest peer stock proxy
MoneyMax total receivables
S$1,010.8m
S$1,229.6m
+21.6%
Broader: pledged loans plus lease and other receivables
Aspial trade and other receivables
S$989.3m
S$1,249.8m
+26.3%
Broader group proxy including nominee exposures
Taka, ValueMax, MoneyMax and Aspial primary 1H/FY2026 filings (R/D). The periods align, but the definitions do not. Taka outgrew ValueMax's closest stock proxy; the broader MoneyMax and Aspial proxies grew faster. This is directional evidence, not a precise league table.
The independent regulator series changes the interpretation. Singapore pawnshops advanced S$6.209bn in H2 2025, 22.4% more than in H1, but pledge counts rose only 8.9% to 2.168m. Average loan per pledge rose 12.3%, from S$2,550 to S$2,864. In Q1 2026 versus Q1 2025, loan value rose 58.1%, pledge counts 17.7% and average ticket 34.3%. The sector's nominal growth was therefore driven much more by collateral/ticket value than by transaction count alone. A company book is a closing stock while the regulator series records loan and pledge flows, so the two must not be divided or ranked directly. (E/D)
What the runway does — and does not — proveTaka has room to deploy: its S$106.1m financial-services assets equal only 0.65× FY2026 parent equity. But net segment capital was S$47.1m, or 44.4% of segment assets; at the current mix, each extra S$1 of book requires roughly 56 cents of liabilities and 44 cents of net capital before group liquidity and dividends. Singapore law caps pawn profit at 1.5% of the loan per month and gives a six-month redemption period. The runway is sustainable only while asset yield and PBT ROAA stay above funding and capital costs. Missing originations, redemptions, pledge counts, average tickets and collateral-realisation data prevent a clean organic-share claim. Registry activity series · profit cap · redemption period. (R/D/E/O)
3 · The cash mechanism — growth here is bought, not generated
Cash conversion cycle
Inventory
+ Trade debtors
− Payables
= Cycle
Core WC / revenue
FY2024 ending-balance snapshot
383 d
43 d
85 d
341 d
69.4%
FY2025 average-balance
348 d
37 d
74 d
311 d
68.6%*
FY2025 turnover uses average balances: inventory on cost of sales, trade debtors on matching retail/wholesale revenue, and payables on cost of sales (D, from R inputs). FY2024 is shown only as an ending-balance snapshot because FY2023 balance-sheet inputs are not extracted. *68.6% is an ending stock ratio; the observed FY2024–FY2025 incremental core-WC/revenue coefficient was 65.0%.
The observed FY2024–FY2025 marginal core-working-capital coefficient was 65.0%, against a net margin near 7%. On that two-point observation, revenue growth above roughly 10.8% a year cannot be funded from earnings. FY2025 is the worked example: +21.6% revenue growth, S$12.5m of profit, negative S$11.4m of operating cash flow, S$22.7m of net new bank borrowing, and lease-adjusted net debt using unrestricted cash rising from S$46.6m to S$69.6m. (R/D/L)
Two measurement errors worth avoiding on this company
The reported "trade receivables" line contains the pawnshop and secured-lending book — 0.70%–1.50% per month, 2–12 month maturities (R, AR-FY2025 note 16). Dividing it by group revenue produces 155 days and reads as deteriorating collection; the actual trade-debtor metric is 39.3 days in FY2025 against 43.1 in FY2024 — collection improved. And 87.7% of the FY2025 receivables build is the loan book, not unpaid invoices. Separately, inventory days on revenue rather than cost of sales understates the cycle by roughly 140 days. (R/D)
The company has now said this itself. 1H FY2026 declared no interim dividend, citing conservation of cash for working capital. Payout has run ~35% in FY2018–FY2019, nil through FP2020–FY2023, then 9.7% and 12.0% in FY2024 and FY2025 — moving opposite to profits. (R/D)
4 · The five-year record, on a comparable basis
S$’000, financial years ended 30 June, from the consolidated cash flow statements and financial reviews in the FY2021, FY2022, FY2023, FY2024 and FY2025 annual reports. FP2020 — a fifteen-month stub from 1 April 2019 to 30 June 2020, created by the change of year-end from 31 March — is left out rather than spliced in beside twelve-month years.
S$’000
FY2021
FY2022
FY2023
FY2024
FY2025
Revenue
96,833
104,270
145,889
146,756
178,443
Profit after tax
2,417
5,877
8,901
10,319
12,544
Operating cash flow, as each year’s own report filed it
17,880
2,308
(4,842)
2,770
(11,373)
… interest paid, and where that report put it
900 op
718 op
2,034 op
2,731 fin
2,985 fin
… all five on the FY2024 basis
18,780
3,026
(2,808)
2,770
(11,373)
Purchase of property, plant and equipment
113
296
2,722
888
6,164
Bank borrowings drawn
5,000
9,500
22,550
21,001
32,539
Bank borrowings repaid
15,702
11,948
12,407
15,882
9,810
Bullion loans drawn
–
–
3,892
30,718
51,141
Bullion loans repaid
2,921
–
–
30,588
50,414
Bills payable, movement
+1,968
+759
(3,439)
+1,190
+1,160
Lease principal paid
4,445
4,324
4,426
3,922
4,565
Dividends paid to shareholders
–
–
–
–
1,001
Dividend received from the associate
–
–
–
–
4,000
Cash and cash equivalents at year end
12,746
8,707
8,389
9,888
11,535
The operating cash flow line changed definition in FY2024, which is why it is shown twice. Through FY2023 the company put interest paid inside operating activities; from FY2024 it puts it in financing. The FY2024 annual report restates FY2023 on the new basis itself, from S$(4,842)k to S$(2,808)k, with the financing total moving the opposite way by the same S$2,034k. FY2021 and FY2022 were never restated, so they are restated here the same way and both rows are shown. A series that mixes the two bases understates the earlier years by the interest bill of each — small in FY2021, S$0.9m, and material by FY2023, S$2.0m.
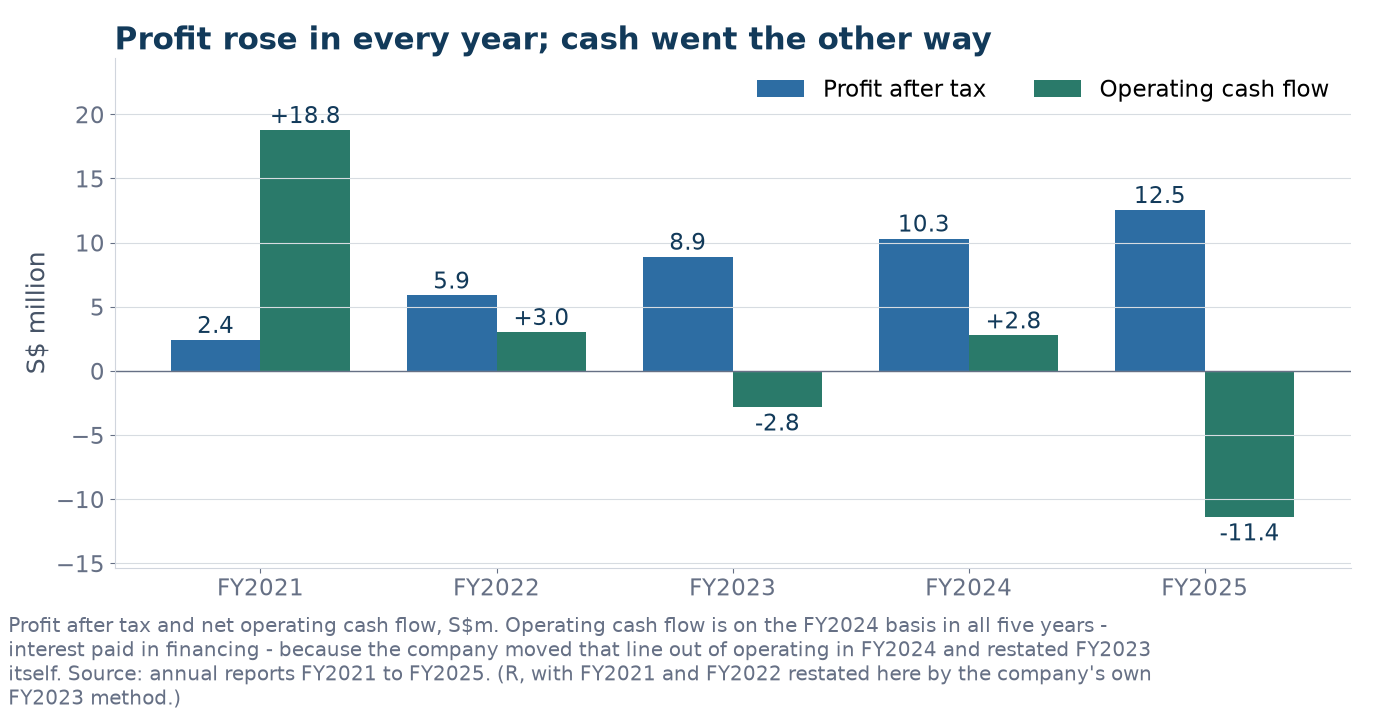
On the comparable basis, profit rose 5.2 times over the five years while operating cash flow went from positive S$18.8m to negative S$11.4m. Profit after tax ran S$2.4m, S$5.9m, S$8.9m, S$10.3m, S$12.5m — up in every single year. Operating cash flow ran S$18.8m, S$3.0m, S$(2.8)m, S$2.8m, S$(11.4)m. Cumulatively the group earned S$40.1m and produced S$10.4m of operating cash, a conversion of 26%. That is the section above stated as a five-year record rather than a two-point coefficient, and it points the same way.
Profit after tax against net operating cash flow, S$m. Operating cash flow is on the FY2024 basis in all five years, so the FY2024 change in where interest paid sits does not appear as a change in the business. Source: annual reports FY2021–FY2025. (R/D)
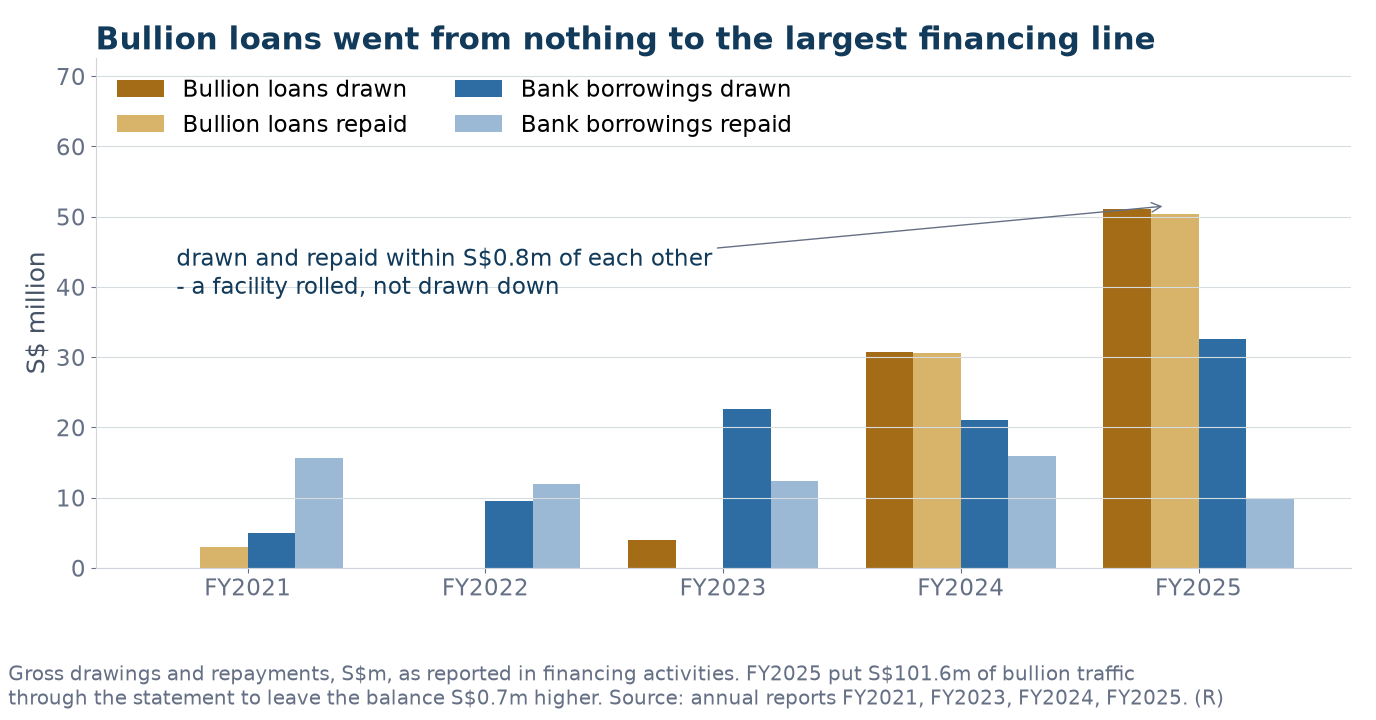
Bullion loans went from nothing to the largest financing line on the statement. There were no drawings at all in FY2022, S$3.9m in FY2023, then S$30.7m and S$51.1m — with repayments in each of the last two years within S$0.8m of the drawings. That is a facility being rolled, not drawn down: FY2025 alone put S$101.6m of gross bullion traffic through the cash flow statement to leave the balance S$0.7m higher. Bank borrowings drawn rose over the same period from S$5.0m to S$32.5m, and FY2025 is the third consecutive year of net bank drawing rather than the first: the net position runs S$(10.7)m, S$(2.4)m, then +S$10.1m, +S$5.1m and +S$22.7m. Repayments did not fall steadily either — FY2024’s S$15.9m was the heaviest of the five years, above FY2021’s. What changed in FY2025 is the scale of the drawing, not its direction.
Gross drawings and repayments in financing activities, S$m. The bullion facility is rolled rather than drawn down: FY2025’s S$101.6m of gross traffic left the balance S$0.7m higher. Source: annual reports FY2021, FY2023, FY2024, FY2025. (R)
Two smaller things the table makes visible. Capital spending was negligible for three years — S$113k, S$296k, then S$2.7m — and then S$6.2m in FY2025, seven times the prior year, alongside the outlet expansion the company gives as a reason for retail growth. And the associate paid Taka a S$4.0m dividend in FY2025, four times the S$1.0m Taka paid its own shareholders in the same year and the only shareholder dividend paid in the five years. The associate is examined in the next section; the point here is that its cash came upstream in the year the operating line was most negative.
5 · The associate — a largely captive upstream affiliate under pressure
Globe Diamonds Pte Ltd — 50% held
Taka's own purchases were 89.9% of the associate's entire revenue in FY2025 (S$3.565m of S$3.964m) and 93.4% in FY2024. The filing classifies Globe as a 50%-owned equity-accounted associate; describing it as economically a largely captive upstream affiliate is an analytical inference. Related-party transactions occurred at “terms agreed between the parties”; the filing does not provide an arm's-length representation. Globe is audited by a different firm from the group auditor. Its revenue fell from S$31.6m in FY2023 to S$4.0m in FY2025 — 87%. (R/D/O)
FY2025 investing cash flow included a S$4.0m associate dividend. Excluding it, operating-plus-investing cash flow was negative S$17.5m. The dividend had not repeated in 1H FY2026; future recurrence is uncertain. Globe reported a loss in FY2025 and net assets fell to S$7.6m, of which Taka's 50% share was S$3.8m. (R/D)
AR-FY2025 states there were no interested-person transactions of S$100,000 or above in FY2025. That is technically correct — a group associate is not an "interested person" under Catalist Chapter 9 — but the effect is that the largest related-party flow in the group attracts no general mandate and no independent shareholder vote. It should not be read as evidence of clean related-party hygiene. (R/O)
7 · Credit evidence — funding, liquidity and asset quality
FY2025 lease-adjusted gross debt was S$81.1m; unrestricted cash was S$11.5m, giving adjusted net debt of S$69.6m. Pre-working-capital operating cash of S$25.6m became negative S$11.4m after a S$35.7m working-capital absorption. After S$6.2m capex and S$3.0m cash interest, free cash flow was negative S$20.5m before lease principal and dividends. (R/D)
Funding marker
FY2025
31 Dec 2025
Bank + bullion debt
S$72.6m
S$97.1m
Current share of bank + bullion debt
74.8%
82.9%
Free cash
S$11.5m
S$14.1m
Net receivables
S$75.9m
S$99.2m
Reported balances and derived ratios. The table shows bank and bullion debt only; the discussion below adds separately disclosed 1H lease liabilities.
At 31 December 2025, lease-adjusted gross debt was S$105.2m, adjusted net debt was S$91.1m, and 80.7% of adjusted debt was current. 1H FY2026 operating cash flow was negative S$15.0m; after capex, interest, lease principal and dividends, the funding deficit before new debt was S$22.0m, financed by S$24.5m of net bank, bills and bullion funding. The credit tension is timing rather than demonstrated insolvency: 1–4 month revolving facilities and undisclosed committed headroom make collection timing and rollover access decisive. Financial-services ECL was 0.47% of its FY2025 gross book, but LTV, collateral mix, delinquency, non-redemption and recovery data are not disclosed. No public rating is presented on this page. (R/D/O)
FY2026 results — 28 August 2026The guidance was confirmed: revenue rose 59% to S$284.0m, profit after tax rose 81% to S$22.7m, and EPS reached 4.05 cents. The cash-conversion constraint also intensified. Operating cash flow was negative S$15.4m; receivables and prepayments absorbed S$50.5m, inventory absorbed S$8.9m, and current loans rose to S$97.2m from S$49.5m. Cash was S$28.3m. The board proposed a 0.536-cent final dividend. Growth is now reported rather than guided, but the funding and working-capital question is not resolved. FY2026 results. (R/D)
FY2026 reported result
FY2026
FY2025
Change
Revenue
S$284.0m
S$178.4m
+59%
Profit after tax
S$22.7m
S$12.5m
+81%
Operating cash flow
−S$15.4m
−S$11.4m
weaker
Inventory
S$138.277m
S$130.539m
+5.93%
Trade and other receivables
S$126.248m
S$77.626m
+62.64%
Current loans and borrowings
S$97.2m
S$49.5m
+96%
FY2026 result and FY2025 comparatives as filed. Percentages are rounded from reported values. (R/D)
Gold driver snapshot — 25 August 2026
The earlier forecast narrative referred to higher gold values but did not freeze a numeric gold-price deck. That is a model-input gap, so there is no honest forecast variance to calculate from the prose alone. The period-aligned market record is more informative than a single spot quote: COMEX gold averaged approximately US$4,396/oz in FY2026, including US$4,687/oz in 2H FY2026; it averaged about US$4,198/oz in FY2027 to 25 August, while the latest 25 August observation was about US$4,725/oz. The latest point is 4.6% above the 20 August model-date close and 0.8% above the 2H FY2026 average, but the FY2027-to-date average is 4.5% below the FY2026 average. Calculations use Yahoo Finance's GC=F daily series; the World Gold Council independently reported LBMA Gold PM at US$4,391/oz on 14 August. (E/D)
Gold observation
US$/oz
What it tests
FY2026 average, Jul 2025–Jun 2026
4,396
Reference environment for the year covered by guidance
2H FY2026 average, Jan–Jun 2026
4,687
Closest market basis to the guided second half
FY2027-to-date average, 1 Jul–25 Aug 2026
4,198
Early through-period input for the new financial year
Latest observation, 25 Aug 2026
4,725
Current inventory/funding watch; not a period average
The 25 August price is after Taka's 30 June year-end, so it cannot change the FY2026 result. If sustained it can lift nominal FY2027 retail selling prices, but the sign to profit remains two-sided: volume and customer behaviour can change, inventory replacement costs and working-capital funding can rise, and the bullion-loan hedge ratio is undisclosed. A three-year return check also does not establish gold as a stable one-for-one share-price driver: monthly return correlation was about +0.28, weekly correlation about -0.12, and Taka's adjusted close was unchanged on roughly 63% of trading sessions. Gold is therefore a material operating and monitoring lever; the short-horizon share-price relationship is weak and liquidity-distorted. Gold series · World Gold Council, 19 Aug. (E/D/O)
8 · What would change this reading
Open test
Resolves at
What did the balance sheet look like after the growth?
Answered at FY2026: receivables S$126.2m, inventory S$138.3m and current loans S$97.2m
Does Financial Services' return improve as the book seasons?
FY2027 interim segment note and cash disclosures
Does the FinServ revenue yield keep falling? (9.31% → 6.82%, FY2023 → FY2025)
FY2027 interim segment note
Is the 8.0× asset growth price or volume?
Needs pledge counts — not disclosed
Is the 69% working-capital intensity structural or gold-cycle?
FY2016–FY2023 balance-sheet series
Does gold remain above the FY2026 average and translate into gross profit rather than only nominal sales and working capital?
FY2027 interim results and segment/cash disclosures
FY2026 is now reported: revenue rose 59% and profit after tax 81%, while operating cash flow remained negative and current borrowings nearly doubled. FY2027 cash conversion is the next test.
9 · What the share price did, and how much of it was Taka
Over the window Taka Jewellery returned +141.7% on a dividend-adjusted basis; the Straits Times Index returned +80.0% and the median of the 3 listed comparisons +260.9%.
The detector flagged 38 large moves in the window — 29 single sessions and 9 weekly windows — before any news was read. 1 market move, 2 sector moves; 35 are left over after both controls, unexplained by them. Of those, 2 followed a filing by timestamp and 33 have nothing filed against them beyond routine notices and are recorded as unexplained rather than explained away.
This section records the 36-month price history and puts every large move through two subtractions and reports what is left over, not what caused it: first the Straits Times Index, then the median of the 3 listed comparisons — Aspial Lifestyle, MoneyMax Financial Services and ValueMax — which trade the same session. “Left over” is what survives both controls.
Each quarter below pairs two records. Key developments are the filings that carry information — results, profit guidance, board and dividend events — with the figures as filed, the guidance given, the close on the day and how the reacting session traded against the controls; a filing after the 09:00 open is read against the next session. Large price moves are the threshold-detected sessions, detected before any news was read and dispositioned from the controls and the enumerated tape; rows with a written note carry a numbered pin, the rest are dots on the line.
Click a quarter — on the chart or in the return strip under it — to read its filings beside its large moves.
Key: Taka Jewellery (42L) as a solid line; Straits Times Index rebased, dashed; peer median rebased, dotted; the peer median runs off scale from Aug 25 and is clipped there; filing ticks above the axis; ex-dividend ticks on it; numbered pins are moves with a written note; plain dots are other detected moves.
How to read the tags.Market-wide and Sector-wide mean the index or the peer median moved with the share over the same session or week; Residual means the move is still large after both are subtracted. A residual is what is left over, not a cause: it does not establish that the company’s own news moved the price, and an unchanged or thinly traded price is not proof that no information arrived. Returns use the dividend-adjusted close; a filing released after the open is read against the next session.
Q3 2023
22 Aug 2023 – 29 Sep 2023 (part quarter)
42L −10.7%STI +1.8%Peer median −3.2%Range S$0.07–S$0.09Close S$0.07
Key developments
24Aug
S$0.09Results
FY2023 results (year to 30 June 2023): revenue up 40% to S$145.9m and profit after tax up 51% to S$8.9m; no dividend.
Wholesale and exhibition revenue rose 46% to S$61.0m as the group resumed international jewellery fairs, retail rose 37% to S$81.5m and financial services (pawnbroking and moneylending) rose 17% to S$3.4m. Gross margin widened to 29.0% from 26.3%, which the company attributed to overseas exhibitions and product mix. Profit before tax was S$10.8m (up 54%) after a S$1.9m impairment of long-overdue overseas receivables, a S$1.6m share of associate profit from Globe Diamonds' property disposals, and finance costs up 179% to S$2.0m. The second half was weaker: 2H2023 profit after tax was S$2.7m, down 32%. Inventories rose S$21.8m to S$105.0m ahead of exhibitions, operating cash flow was an outflow of S$4.7m, and aggregate borrowings were S$37.6m (computed) plus S$3.7m of bullion loans. No dividend, 'to conserve cash for working capital purposes'.
Guidance: The company said it was 'cautiously optimistic that our business profitability will remain healthy' but prepared for a significant slowdown, with inflation lifting labour, material and interest costs.Reaction (next session, 25 Aug): 42L −12.6% · STI +0.3% · peers +0.0% · 1483.0× median volumeSource: SGX announcement, 24 Aug 2023
21Sep
S$0.07Board
Board renewal: all three independent directors appointed at the 2015 listing step down ahead of the nine-year limit; three replacements named, with Dr Tan Kia King to chair the board.
Board chairman Goh Yeow Tin and Chua Kern announced on 4 September that they would retire at the 25 October 2023 AGM, and audit committee chairman Lu King Seng on 21 September that he would resign on 31 December 2023, each citing the nine-year tenure limit for independent directors. The same evening the company named Dr Tan Kia King (board and remuneration committee chair), Young Sau Kwan Joanna (nominating committee chair) and Kuan Cheng Tuck (audit committee chair) as independent directors from the AGM, where shareholders approved all three.
Audited FY2023 accounts match the unaudited release on revenue (S$145.9m), profit after tax (S$8.9m) and net assets (S$119.5m); the variances are reclassifications.
Under Catalist Rule 704(5) the company reported that the audit moved S$33,000 of lease interest from other operating expenses to finance costs, reclassified S$230,000 of lease liabilities from non-current to current, and restated cash-flow lines for a subsidiary acquired and disposed of during the year, so that purchases of plant and equipment became S$2.7m against S$1.4m unaudited and the operating cash outflow S$4.8m against S$4.7m.
25 Aug 2023 · −12.6% · Residual · index +0.3%, peers +0.0%, left over −12.6%
The session after the FY2023 results, filed at 18:04 on 24 August: revenue up 40% to S$145.9m and profit after tax up 51% to S$8.9m, but second-half profit after tax of S$2.7m was down 32% and no dividend was declared, ‘to conserve cash for working capital purposes’. The index rose 0.3% and none of the three peers moved, so the whole fall is left over. 148,300 shares traded against prints of 100 shares on the preceding sessions, and the 0.087 close the fall is measured from was itself a 100-share uptick: from the 0.084 that stood on 22 and 23 August the fall is 9.5%. The close then held at 0.076 for six sessions and slipped to 0.065 by 13 September.
25 Sep 2023 · +15.4% · Residual · index +0.3%, peers +0.0%, left over +15.4%
A 50,000-share session that took the close from 0.065, where it had stood since 13 September on a single 10,000-share trade, to 0.075. The index rose 0.3%, Aspial 0.7%, and the other two peers did not move. The only filings in the three prior sessions were board-composition notices released after the close on 21 September — the audit committee chairman’s resignation under the nine-year tenure limit and three independent-director appointments — and a 22 September notice promoting the financial-services business manager to general manager; the first session after them was unchanged. Nothing material was filed. The 0.075 close stood, on almost no volume, until it was more than reversed on 12 October (−13.5% on 8,100 shares).
42L −6.7%STI +0.7%Peer median −3.9%Range S$0.06–S$0.07Close S$0.07
Key developments
No filings beyond routine disclosures this quarter.
Large price moves
3
12 Oct 2023 · −13.5% · Residual · index +0.8%, peers +0.0%, left over −13.5%
Against an index move of +0.8% and a peer median of +0.0%, about 14 points are left over; 0.1× median volume. No filing beyond routine notices in the prior three sessions.
20 Nov 2023 · +13.8% · Residual · index −0.4%, peers +0.0%, left over +13.8%
Against an index move of −0.4% and a peer median of +0.0%, about 14 points are left over; 0.5× median volume. No filing beyond routine notices in the prior three sessions.
42L −18.6%STI −0.5%Peer median +7.0%Range S$0.06–S$0.07Close S$0.06
Key developments
8Feb
S$0.07Results
1H FY2024 results (six months to 31 December 2023): revenue down 2% to S$70.6m and profit after tax down 12% to S$5.4m as export sales eased.
Wholesale and exhibition revenue fell 6.2% to S$27.1m on lower export sales to overseas customers; retail rose 1.2% to S$41.6m and financial services 11.2% to S$1.9m. Gross margin slipped to 28.8% from 29.6% on product mix. Selling and administrative costs fell 11% and 16%, but finance costs rose 59% to S$1.4m on higher facility use and borrowing costs, and the associate contributed S$0.1m against S$1.0m a year earlier, so profit before tax fell 13% to S$6.3m. Trade receivables rose S$10.0m, mainly in financial services; operating cash flow was an outflow of S$2.1m; cash rose to S$14.5m while current bank borrowings rose S$6.7m to S$31.0m and bullion loans to S$6.7m. No interim dividend.
Guidance: The company said it was 'reasonably optimistic about sustaining profitability in FY2024 barring any unforeseen circumstances', and that it envisaged 'a gradual increase in the number of our jewellery and pawnshop outlets'.Reaction (next session, 9 Feb): 42L +0.0% · STI −0.1% · peers +0.0%Source: SGX announcement, 8 Feb 2024
Large price moves
5
22 Jan 2024 · −10.2% · Residual · index −0.1%, peers +1.5%, left over −11.7%
Against an index move of −0.1% and a peer median of +1.5%, about 12 points are left over; 0.1× median volume. No filing beyond routine notices in the prior three sessions.
1 Feb 2024 · +9.7% · Residual · index −0.3%, peers +0.0%, left over +9.7%
Against an index move of −0.3% and a peer median of +0.0%, about 10 points are left over; 0.1× median volume. No filing beyond routine notices in the prior three sessions.
14 Mar 2024 · −10.6% · Residual · index +0.8%, peers +1.3%, left over −11.9%
Against an index move of +0.8% and a peer median of +1.3%, about 12 points are left over; 0.0× median volume. No filing beyond routine notices in the prior three sessions.
15 Mar 2024 · +11.9% · Residual · index −0.4%, peers +0.0%, left over +11.9%
Against an index move of −0.4% and a peer median of +0.0%, about 12 points are left over; 14.0× median volume. No filing beyond routine notices in the prior three sessions.
25 Mar 2024 · −13.6% · Residual · index −0.6%, peers +0.0%, left over −13.6%
Against an index move of −0.6% and a peer median of +0.0%, about 14 points are left over; 0.1× median volume. No filing beyond routine notices in the prior three sessions.
42L +24.6%STI +3.4%Peer median +10.8%Range S$0.06–S$0.08Close S$0.07
Key developments
No filings beyond routine disclosures this quarter.
Large price moves
10
1 Apr 2024 · +14.0% · Residual · index +0.3%, peers +0.0%, left over +14.0%
Against an index move of +0.3% and a peer median of +0.0%, about 14 points are left over; 0.7× median volume. No filing beyond routine notices in the prior three sessions.
week to 3 May 2024 · +22.4% · Residual · index +0.4%, peers +0.0%, left over +22.4%
The week’s rise ran from 0.058, a tenth of a cent above the 25 March window low, to 0.071, and unlike most of the 2024 register it was traded: 1.18m shares on 2 May and 3.94m on 3 May, the latter 42.6× median volume. The index rose 0.4% over the week; Aspial was unchanged, MoneyMax rose 3.9% and ValueMax fell 1.3%, so the peer median is zero and the whole 22 points are left over. The tape is silent from the 1H FY2024 results of 8 February to the FY2024 results of 28 August. The close eased to 0.067 over the next two sessions and stayed there for two weeks.
17 May 2024 · +17.9% · Residual · index +0.3%, peers +0.0%, left over +17.9%
A 20,900-share session that reset the close from 0.067, unchanged since 7 May, to 0.079. The index rose 0.3%, Aspial fell 0.8%, ValueMax rose 1.4% and MoneyMax did not trade; nothing was filed between 8 February and 28 August. The price was not tested again until 28 May, when 953,300 shares traded at 0.078; it slipped to 0.073 on 30 May.
week to 17 May 2024 · +17.9% · Residual · index +0.7%, peers +0.0%, left over +17.9%
Weekly window, 2024-05-10 to 2024-05-17: against an index move of +0.7% and a peer median of +0.0%, about 18 points are left over. No filing beyond routine notices inside the window.
7 Jun 2024 · +15.1% · Residual · index −0.0%, peers +0.0%, left over +15.1%
1.88m shares, 25.4× median volume, took the close from 0.073 to 0.084. The index was flat; Aspial rose 1.6%, ValueMax fell 2.5% and MoneyMax did not move, so the peer median is zero and the 15 points survive both controls. No filing sits in the three sessions on either side, and none between 8 February and 28 August. Two sessions without a trade followed, and on 12 June a single 1,500-share trade took the close to 0.070, below where this session started.
12 Jun 2024 · −16.7% · Residual · index −0.1%, peers +0.0%, left over −16.7%
The reversal of the 7 June rise, on 1,500 shares: two sessions with no trade, then one print at 0.070, below the 0.073 that stood before 7 June. The index fell 0.1%; MoneyMax rose 2.0%, ValueMax fell 2.5% and Aspial was unchanged. Nothing was filed. The level was then confirmed with volume — 4.89m shares traded at 0.071 on 21 June, the largest session of 2024.
week to 14 Jun 2024 · −16.7% · Residual · index −1.0%, peers −1.6%, left over −15.1%
Weekly window, 2024-06-07 to 2024-06-14: against an index move of −1.0% and a peer median of −1.6%, about 15 points are left over. No filing beyond routine notices inside the window.
42L +14.1%STI +7.6%Peer median +9.6%Range S$0.07–S$0.08Close S$0.08
Key developments
28Aug
S$0.07Results
FY2024 results (year to 30 June 2024): revenue up 0.6% to S$146.8m and profit after tax up 16% to S$10.3m; a final dividend of 0.179 cents proposed after none for FY2023.
Retail rose 1.9% to S$83.1m on e-commerce sales and higher gold prices, financial services rose 16.9% to S$3.9m, and wholesale and exhibition fell 2.1% to S$59.8m on lower export sales. Gross margin held at 29%. Profit before tax rose 7% to S$11.6m, which the company attributed mainly to impairment losses falling to S$0.6m from S$1.9m after tighter credit control; finance costs rose 34% to S$2.7m and the tax charge fell 33% on an FY2023 overprovision. 2H2024 profit after tax was S$4.9m, up 80%. Operating cash flow turned to an inflow of S$2.8m after S$15.0m of working-capital outflow; inventories were S$109.3m, trade and other receivables S$61.9m (up S$10.1m, mainly financial services), cash S$12.7m, aggregate borrowings S$43.9m (computed) and bullion loans S$4.0m. NAV per share 23.20 cents.
Guidance: The company said it 'expects to sustain its overall performance while maintaining a cautiously optimistic outlook', citing currency and gold-price volatility, inflation and geopolitical tensions as cost pressures.Reaction (next session, 29 Aug): 42L +0.0% · STI +0.4% · peers −0.8%Source: SGX announcement, 28 Aug 2024
Large price moves
17
17 Jul 2024 · +16.2% · Residual · index +0.1%, peers −0.8%, left over +17.0%
A single trade of 300 shares at 0.079, after a 6,000-share session on 12 July had taken the close from 0.071 to 0.068. The index rose 0.1%; Aspial fell 0.8%, MoneyMax 4.0% and ValueMax rose 2.5%. Nothing was filed. No share changed hands for the next 17 sessions, so the 300-share print set the close until 13 August, when 550,000 shares traded at 0.075.
week to 19 Jul 2024 · +16.2% · Residual · index −1.4%, peers +1.2%, left over +14.9%
Weekly window, 2024-07-12 to 2024-07-19: against an index move of −1.4% and a peer median of +1.2%, about 15 points are left over. No filing beyond routine notices inside the window.
9 Sep 2024 · +8.1% · Residual · index +1.2%, peers +0.0%, left over +8.1%
Against an index move of +1.2% and a peer median of +0.0%, about 8 points are left over; 23.6× median volume. No filing beyond routine notices in the prior three sessions.
42L +15.9%STI +5.6%Peer median −3.3%Range S$0.08–S$0.10Close S$0.09
Key developments
1Nov
S$0.09Dividend
Ex-dividend: final FY2024 dividend of 0.179 cents per share.
Approved at the AGM of 22 October 2024; record date 4 November and paid 18 November 2024. The chart's return series is adjusted for it, so the ex-date step is not counted as a move.
22 Oct 2024 · +5.8% · Residual · index −0.8%, peers +0.8%, left over +4.9%
Against an index move of −0.8% and a peer median of +0.8%, about 5 points are left over; 42.2× median volume. No filing beyond routine notices in the prior three sessions.
42L +13.0%STI +4.9%Peer median +18.2%Range S$0.09–S$0.11Close S$0.10
Key developments
12Feb
S$0.09Results
1H FY2025 results (six months to 31 December 2024): revenue up 18% to S$83.1m and profit after tax up 22% to S$6.6m on new outlets and exhibition sales.
Retail rose 16.6% to S$48.6m on a larger outlet network, wholesale and exhibition rose 19.8% to S$32.4m on exhibition shows, and financial services 10.6% to S$2.1m on pawnbroking. Gross margin rose to 30.1% from 28.8% on mix. Selling costs rose 25.8% to S$12.4m with outlet expansion, a S$0.4m impairment was taken on overdue overseas receivables, and profit before tax rose 24% to S$7.7m. Inventories rose S$18.4m to S$127.7m on new outlets and gold-price-inflated replacement stock, so operating cash flow was an outflow of S$4.7m. A freehold property was acquired (property and plant purchases S$5.8m), part-funded by a S$2.5m dividend from the associate. Aggregate borrowings rose to S$53.0m (computed) and bullion loans to S$9.8m; cash was S$13.5m. No interim dividend.
Guidance: The company said it 'remains optimistic and aims to sustain performance through market share retention and topline growth', with expansion of its retail network across Singapore described as 'a key part of its strategy'.Reaction (next session, 13 Feb): 42L +3.3% · STI +0.2% · peers +1.1% · 849.0× median volumeSource: SGX announcement, 12 Feb 2025
Large price moves
22
19 Mar 2025 · +8.0% · Residual · index +0.3%, peers −0.8%, left over +8.8%
Against an index move of +0.3% and a peer median of −0.8%, about 9 points are left over; 2.4× median volume. No filing beyond routine notices in the prior three sessions.
week to 21 Mar 2025 · +10.5% · Residual · index +2.4%, peers +1.7%, left over +8.8%
Weekly window, 2025-03-14 to 2025-03-21: against an index move of +2.4% and a peer median of +1.7%, about 9 points are left over. No filing beyond routine notices inside the window.
42L +9.6%STI −0.2%Peer median +22.6%Range S$0.09–S$0.11Close S$0.11
Key developments
No filings beyond routine disclosures this quarter.
Large price moves
24
9 Apr 2025 · −12.0% · Residual · index −2.2%, peers −2.0%, left over −10.0%
Against an index move of −2.2% and a peer median of −2.0%, about 10 points are left over; 1.6× median volume. No filing beyond routine notices in the prior three sessions.
week to 2 May 2025 · +9.7% · Residual · index +0.6%, peers +0.0%, left over +9.7%
Weekly window, 2025-04-25 to 2025-05-02: against an index move of +0.6% and a peer median of +0.0%, about 10 points are left over. No filing beyond routine notices inside the window.
19 May 2025 · +7.4% · Residual · index −0.6%, peers −0.8%, left over +8.2%
Against an index move of −0.6% and a peer median of −0.8%, about 8 points are left over; 0.1× median volume. No filing beyond routine notices in the prior three sessions.
42L +24.6%STI +8.5%Peer median +60.7%Range S$0.11–S$0.15Close S$0.14
Key developments
28Aug
S$0.15Results
FY2025 results (year to 30 June 2025): revenue up 21.6% to S$178.4m and profit after tax up 22% to S$12.5m; dividend raised to 0.268 cents from 0.179.
Retail rose 20.8% to S$100.3m on more outlets and e-commerce, wholesale and exhibition 23.1% to S$73.6m, and financial services 15.9% to S$4.5m. Gross margin was 29.6% against 29.1%. Profit before tax rose 30% to S$15.1m, helped by a S$0.8m foreign-exchange gain, against a S$1.3m impairment on overdue overseas receivables and a S$0.6m share of associate loss; finance costs rose 9% to S$3.0m. Working capital absorbed S$35.6m: inventories rose S$21.3m to S$130.5m and receivables S$15.7m to S$77.6m (financial services), so operating cash flow was an outflow of S$11.3m, funded by S$22.7m of net bank borrowings. Aggregate borrowings rose to S$67.8m from S$43.9m, bullion loans were S$4.8m and cash S$15.0m; NAV per share 25.24 cents. 2H2025 profit after tax was S$6.0m, up 21%.
Guidance: The company said it 'remains optimistic and aims to sustain performance through market share retention and topline growth' while continuing to expand its Singapore retail network, and cited currency and gold-price volatility and geopolitical disruption to trade flows and supply chains.Reaction (next session, 29 Aug): 42L +0.0% · STI +0.4% · peers +0.6%Source: SGX announcement, 28 Aug 2025
Large price moves
28
4 Jul 2025 · +9.3% · Residual · index −0.1%, peers +0.0%, left over +9.3%
Against an index move of −0.1% and a peer median of +0.0%, about 9 points are left over; 2.7× median volume. No filing beyond routine notices in the prior three sessions.
14 Aug 2025 · +25.2% · Residual · index −0.4%, peers −1.4%, left over +26.6%
The largest single-session gain in the window: 1.16m shares, 15.8× median volume, took the close from 0.119, where it had stood since 29 July with three small prints and no trade at all from 8 to 13 August, to 0.149. On the day the index fell 0.4% and all three peers fell (Aspial −1.4%, MoneyMax −0.7%, ValueMax −1.9%), so nothing is subtracted. The peers had, however, risen two sessions earlier: on 12 August Aspial rose 6.8% on 14.4m shares, MoneyMax 12.0% and ValueMax 6.6%, while Taka did not trade; over the week to 15 August the peer median is +4.8% and about 20 points remain. The tape is silent — nothing between the 1H FY2025 results of 12 February and the FY2025 results filed at 17:39 on 28 August, a fortnight later — and the close was 0.145–0.149 through to those results.
week to 15 Aug 2025 · +25.2% · Residual · index −0.2%, peers +4.8%, left over +20.5%
Weekly window, 2025-08-08 to 2025-08-15: against an index move of −0.2% and a peer median of +4.8%, about 20 points are left over. No filing beyond routine notices inside the window.
17 Nov 2025 · −6.7% · Residual · index −0.1%, peers +0.0%, left over −6.7%
Against an index move of −0.1% and a peer median of +0.0%, about 7 points are left over; 19.3× median volume. No filing beyond routine notices in the prior three sessions.
26 Dec 2025 · −7.4% · Residual · index −0.0%, peers +2.2%, left over −9.7%
Against an index move of −0.0% and a peer median of +2.2%, about 10 points are left over; 1.6× median volume. No filing beyond routine notices in the prior three sessions.
42L +54.8%STI +5.1%Peer median +42.6%Range S$0.13–S$0.23Close S$0.20
Key developments
5Feb
S$0.18Business update
Profit guidance: the company expects 'a significant improvement in revenue and net profit' for 1H FY2026 against 1H FY2025, across all three segments.
The board attributed the improvement to higher retail revenue on higher gold prices, higher volumes and more outlets, better financial-services results on higher income and lower interest costs, and stronger wholesale and exhibition results on more exhibition participation. No figures were given; the results were to be released on or before 14 February 2026, and shareholders were advised to exercise caution.
Reaction (next session, 6 Feb): 42L +6.5% · STI −0.8% · peers +0.0% · 35.2× median volumeSource: SGX announcement, 5 Feb 2026
12Feb
S$0.21Results
1H FY2026 results (six months to 31 December 2025): revenue up 44.3% to S$119.9m and profit after tax up 59.5% to S$10.5m, with a S$15.0m operating cash outflow.
Retail rose 45.1% to S$70.5m on gold prices, volumes and outlet expansion, wholesale and exhibition 42.0% to S$46.1m, and financial services 60.2% to S$3.3m on pawnbroking. Gross margin eased to 29.5% from 30.1% on mix. Selling costs rose 29.5% to S$16.1m with outlet expansion; a S$0.8m impairment on overdue overseas receivables and a S$0.6m associate loss were taken; finance costs fell 7.6% to S$1.3m on lower rates. Profit before tax rose 59.5% to S$12.4m. Pawnshop loans rose S$25.2m and inventories S$11.6m to S$142.1m, so operating cash flow was an outflow of S$15.0m, funded by S$17.3m of net bank borrowings: aggregate borrowings reached S$88.5m from S$67.8m, bullion loans S$8.6m, cash S$17.6m; NAV per share 26.86 cents. No interim dividend, 'to conserve cash for working capital purposes'.
Guidance: The company said the continued rise in gold prices 'has resulted in higher working capital requirements and cashflow pressure for the jewellery industry', and that it would pursue 'disciplined expansion of its retail network in Singapore' while remaining optimistic about sustaining performance.Reaction (next session, 13 Feb): 42L +0.0% · STI −1.6% · peers −2.9% · 17.3× median volumeSource: SGX announcement, 12 Feb 2026
Large price moves
33
2 Jan 2026 · +7.9% · Residual · index +0.2%, peers +0.0%, left over +7.9%
Against an index move of +0.2% and a peer median of +0.0%, about 8 points are left over; 0.1× median volume. No filing beyond routine notices in the prior three sessions.
26 Jan 2026 · +23.2% · Sector-wide · index −0.6%, peers +12.4%, left over +10.8%
The heaviest session in the window, 17.2m shares or 232× median volume, from 0.151 to 0.186. The index fell 0.6%, but all three peers rose between 12.4% and 13.0% (Aspial +13.0%, MoneyMax +12.4%, ValueMax +12.4%), and they had already risen 4–10% the session before. On the controls this is a sector session, with about 11 points left over after the peer median. Nothing was filed by Taka between the AGM minutes of 27 November and the profit guidance of 5 February. The rise continued to 0.198 on 29 January, and on 30 January Taka fell 7.1% against peer falls of 4.1–9.6%.
week to 30 Jan 2026 · +21.9% · Residual · index +0.3%, peers +9.3%, left over +12.6%
Weekly window, 2026-01-23 to 2026-01-30: against an index move of +0.3% and a peer median of +9.3%, about 13 points are left over. No filing beyond routine notices inside the window.
9 Feb 2026 · +11.7% · Residual · index +0.5%, peers +3.7%, left over +8.0%
The second session after the profit guidance filed at 18:51 on 5 February, in which the company said it expected ‘a significant improvement in revenue and net profit’ for 1H FY2026 across all three segments, without figures. The first session after it, 6 February, rose 6.5% on 4.2m shares; this one rose 11.7% on 8.9m shares, 120× median volume, with the index up 0.5% and the peer median up 3.7% (MoneyMax +8.8%, Aspial +3.7%, ValueMax +2.7%), leaving about eight points. The window high of 0.225 followed on 11 February. The results themselves — revenue up 44.3% to S$119.9m, profit after tax up 59.5% to S$10.5m, an operating cash outflow of S$15.0m — were filed at 17:22 on 12 February, after that session’s 6.7% fall, and the session after them closed unchanged on 3.7m shares.
42L +1.0%STI +5.8%Peer median +4.9%Range S$0.19–S$0.20Close S$0.20
Key developments
No filings beyond routine disclosures this quarter.
Large price moves
No session cleared the large-move threshold this quarter.
Q3 2026
1 Jul 2026 – 21 Aug 2026 (part quarter)
42L −1.0%STI +10.0%Peer median +3.9%Range S$0.18–S$0.20Close S$0.20
Key developments
21Aug
S$0.20Business update
Profit guidance: the company expects 'a significant improvement in revenue and net profit' for 2H FY2026 and the full year to 30 June 2026 against the prior-year periods.
The board cited the same three drivers as in February: higher retail revenue on gold prices, volumes and more outlets; better financial-services results on higher income and lower interest costs; and stronger wholesale and exhibition results on more exhibition participation. No figures were given; the results were to be released on or before 29 August 2026.
Released after the close on the last session of the price window; no reaction session is computed.Source: SGX announcement, 21 Aug 2026
Large price moves
38
3 Jul 2026 · −7.6% · Residual · index +0.5%, peers +6.9%, left over −14.5%
Against an index move of +0.5% and a peer median of +6.9%, about 14 points are left over. No filing beyond routine notices in the prior three sessions.
Prices are Yahoo Finance daily closes for 42L.SI over 22 August 2023 to 21 August 2026, dividend-adjusted for the two final dividends; the filings tape is every SGXNet announcement by the issuer over the same window from the SGX announcements API, with SGX broadcast times. A filing after the open is read against the next session.
The full move register — every large move and its market and sector controls
Every threshold-detected move in the window with its controls, dispositioned in the price-driver register; rows with a written note carry a numbered pin on the chart.
#
Session
42L
STI
Peers
Left over
Control result
What the evidence supports
1
25 Aug 2023
−12.6%
+0.3%
+0.0%
−12.6%
Residual
The session after the FY2023 results, filed at 18:04 on 24 August: revenue up 40% to S$145.9m and profit after tax up 51% to S$8.9m, but second-half profit after tax of S$2.7m was down 32% and no dividend was declared, ‘to conserve cash for working capital purposes’. The index rose 0.3% and none of the three peers moved, so the whole fall is left over. 148,300 shares traded against prints of 100 shares on the preceding sessions, and the 0.087 close the fall is measured from was itself a 100-share uptick: from the 0.084 that stood on 22 and 23 August the fall is 9.5%. The close then held at 0.076 for six sessions and slipped to 0.065 by 13 September.Aspial +0.0 · MoneyMax +0.0 · ValueMax +0.0
2
25 Sep 2023
+15.4%
+0.3%
+0.0%
+15.4%
Residual
A 50,000-share session that took the close from 0.065, where it had stood since 13 September on a single 10,000-share trade, to 0.075. The index rose 0.3%, Aspial 0.7%, and the other two peers did not move. The only filings in the three prior sessions were board-composition notices released after the close on 21 September — the audit committee chairman’s resignation under the nine-year tenure limit and three independent-director appointments — and a 22 September notice promoting the financial-services business manager to general manager; the first session after them was unchanged. Nothing material was filed. The 0.075 close stood, on almost no volume, until it was more than reversed on 12 October (−13.5% on 8,100 shares).Aspial +0.7 · MoneyMax +0.0 · ValueMax +0.0
3
12 Oct 2023
−13.5%
+0.8%
+0.0%
−13.5%
Residual
Against an index move of +0.8% and a peer median of +0.0%, about 14 points are left over; 0.1× median volume. No filing beyond routine notices in the prior three sessions.Aspial −3.8 · MoneyMax +0.0 · ValueMax +0.0
4
20 Nov 2023
+13.8%
−0.4%
+0.0%
+13.8%
Residual
Against an index move of −0.4% and a peer median of +0.0%, about 14 points are left over; 0.5× median volume. No filing beyond routine notices in the prior three sessions.Aspial −1.6 · MoneyMax +0.0 · ValueMax +1.6
5
22 Jan 2024
−10.2%
−0.1%
+1.5%
−11.7%
Residual
Against an index move of −0.1% and a peer median of +1.5%, about 12 points are left over; 0.1× median volume. No filing beyond routine notices in the prior three sessions.Aspial +0.0 · MoneyMax +2.3 · ValueMax +1.5
6
1 Feb 2024
+9.7%
−0.3%
+0.0%
+9.7%
Residual
Against an index move of −0.3% and a peer median of +0.0%, about 10 points are left over; 0.1× median volume. No filing beyond routine notices in the prior three sessions.Aspial +0.0 · MoneyMax +0.0 · ValueMax +0.0
7
14 Mar 2024
−10.6%
+0.8%
+1.3%
−11.9%
Residual
Against an index move of +0.8% and a peer median of +1.3%, about 12 points are left over; 0.0× median volume. No filing beyond routine notices in the prior three sessions.Aspial +0.0 · MoneyMax +4.5 · ValueMax +1.3
8
15 Mar 2024
+11.9%
−0.4%
+0.0%
+11.9%
Residual
Against an index move of −0.4% and a peer median of +0.0%, about 12 points are left over; 14.0× median volume. No filing beyond routine notices in the prior three sessions.Aspial +0.0 · MoneyMax +0.0 · ValueMax +0.0
9
25 Mar 2024
−13.6%
−0.6%
+0.0%
−13.6%
Residual
Against an index move of −0.6% and a peer median of +0.0%, about 14 points are left over; 0.1× median volume. No filing beyond routine notices in the prior three sessions.Aspial +0.0 · MoneyMax +0.0 · ValueMax +0.0
10
1 Apr 2024
+14.0%
+0.3%
+0.0%
+14.0%
Residual
Against an index move of +0.3% and a peer median of +0.0%, about 14 points are left over; 0.7× median volume. No filing beyond routine notices in the prior three sessions.Aspial −0.8 · MoneyMax +2.2 · ValueMax +0.0
11
week to 3 May 2024
+22.4%
+0.4%
+0.0%
+22.4%
Residual
The week’s rise ran from 0.058, a tenth of a cent above the 25 March window low, to 0.071, and unlike most of the 2024 register it was traded: 1.18m shares on 2 May and 3.94m on 3 May, the latter 42.6× median volume. The index rose 0.4% over the week; Aspial was unchanged, MoneyMax rose 3.9% and ValueMax fell 1.3%, so the peer median is zero and the whole 22 points are left over. The tape is silent from the 1H FY2024 results of 8 February to the FY2024 results of 28 August. The close eased to 0.067 over the next two sessions and stayed there for two weeks.Aspial +0.0 · MoneyMax +3.9 · ValueMax −1.3
12
17 May 2024
+17.9%
+0.3%
+0.0%
+17.9%
Residual
A 20,900-share session that reset the close from 0.067, unchanged since 7 May, to 0.079. The index rose 0.3%, Aspial fell 0.8%, ValueMax rose 1.4% and MoneyMax did not trade; nothing was filed between 8 February and 28 August. The price was not tested again until 28 May, when 953,300 shares traded at 0.078; it slipped to 0.073 on 30 May.Aspial −0.8 · MoneyMax +0.0 · ValueMax +1.4
13
week to 17 May 2024
+17.9%
+0.7%
+0.0%
+17.9%
Residual
Weekly window, 2024-05-10 to 2024-05-17: against an index move of +0.7% and a peer median of +0.0%, about 18 points are left over. No filing beyond routine notices inside the window.Aspial −1.6 · MoneyMax +0.0 · ValueMax +0.0
14
7 Jun 2024
+15.1%
−0.0%
+0.0%
+15.1%
Residual
1.88m shares, 25.4× median volume, took the close from 0.073 to 0.084. The index was flat; Aspial rose 1.6%, ValueMax fell 2.5% and MoneyMax did not move, so the peer median is zero and the 15 points survive both controls. No filing sits in the three sessions on either side, and none between 8 February and 28 August. Two sessions without a trade followed, and on 12 June a single 1,500-share trade took the close to 0.070, below where this session started.Aspial +1.6 · MoneyMax +0.0 · ValueMax −2.5
15
12 Jun 2024
−16.7%
−0.1%
+0.0%
−16.7%
Residual
The reversal of the 7 June rise, on 1,500 shares: two sessions with no trade, then one print at 0.070, below the 0.073 that stood before 7 June. The index fell 0.1%; MoneyMax rose 2.0%, ValueMax fell 2.5% and Aspial was unchanged. Nothing was filed. The level was then confirmed with volume — 4.89m shares traded at 0.071 on 21 June, the largest session of 2024.Aspial +0.0 · MoneyMax +2.0 · ValueMax −2.5
16
week to 14 Jun 2024
−16.7%
−1.0%
−1.6%
−15.1%
Residual
Weekly window, 2024-06-07 to 2024-06-14: against an index move of −1.0% and a peer median of −1.6%, about 15 points are left over. No filing beyond routine notices inside the window.Aspial −1.6 · MoneyMax −3.8 · ValueMax +2.6
17
17 Jul 2024
+16.2%
+0.1%
−0.8%
+17.0%
Residual
A single trade of 300 shares at 0.079, after a 6,000-share session on 12 July had taken the close from 0.071 to 0.068. The index rose 0.1%; Aspial fell 0.8%, MoneyMax 4.0% and ValueMax rose 2.5%. Nothing was filed. No share changed hands for the next 17 sessions, so the 300-share print set the close until 13 August, when 550,000 shares traded at 0.075.Aspial −0.8 · MoneyMax −4.0 · ValueMax +2.5
18
week to 19 Jul 2024
+16.2%
−1.4%
+1.2%
+14.9%
Residual
Weekly window, 2024-07-12 to 2024-07-19: against an index move of −1.4% and a peer median of +1.2%, about 15 points are left over. No filing beyond routine notices inside the window.Aspial +0.0 · MoneyMax +2.0 · ValueMax +1.2
19
9 Sep 2024
+8.1%
+1.2%
+0.0%
+8.1%
Residual
Against an index move of +1.2% and a peer median of +0.0%, about 8 points are left over; 23.6× median volume. No filing beyond routine notices in the prior three sessions.Aspial +0.0 · MoneyMax −1.6 · ValueMax +1.1
20
22 Oct 2024
+5.8%
−0.8%
+0.8%
+4.9%
Residual
Against an index move of −0.8% and a peer median of +0.8%, about 5 points are left over; 42.2× median volume. No filing beyond routine notices in the prior three sessions.Aspial +0.8 · MoneyMax +0.0 · ValueMax +1.1
21
4 Dec 2024
+5.7%
+0.4%
+0.0%
+5.7%
Residual
Against an index move of +0.4% and a peer median of +0.0%, about 6 points are left over. No filing beyond routine notices in the prior three sessions.Aspial +0.8 · MoneyMax +0.0 · ValueMax +0.0
22
19 Mar 2025
+8.0%
+0.3%
−0.8%
+8.8%
Residual
Against an index move of +0.3% and a peer median of −0.8%, about 9 points are left over; 2.4× median volume. No filing beyond routine notices in the prior three sessions.Aspial −0.8 · MoneyMax +2.4 · ValueMax −0.9
23
week to 21 Mar 2025
+10.5%
+2.4%
+1.7%
+8.8%
Residual
Weekly window, 2025-03-14 to 2025-03-21: against an index move of +2.4% and a peer median of +1.7%, about 9 points are left over. No filing beyond routine notices inside the window.Aspial +1.7 · MoneyMax +7.7 · ValueMax +1.0
24
9 Apr 2025
−12.0%
−2.2%
−2.0%
−10.0%
Residual
Against an index move of −2.2% and a peer median of −2.0%, about 10 points are left over; 1.6× median volume. No filing beyond routine notices in the prior three sessions.Aspial −5.1 · MoneyMax +0.0 · ValueMax −2.0
25
week to 11 Apr 2025
−9.0%
−8.2%
−1.0%
−8.0%
Market-wide
In line with the market: against an index move of −8.2% and a peer median of −1.0%, about 8 points are left over.Aspial +0.8 · MoneyMax −3.7 · ValueMax −1.0
26
week to 2 May 2025
+9.7%
+0.6%
+0.0%
+9.7%
Residual
Weekly window, 2025-04-25 to 2025-05-02: against an index move of +0.6% and a peer median of +0.0%, about 10 points are left over. No filing beyond routine notices inside the window.Aspial +1.7 · MoneyMax +0.0 · ValueMax +0.0
27
19 May 2025
+7.4%
−0.6%
−0.8%
+8.2%
Residual
Against an index move of −0.6% and a peer median of −0.8%, about 8 points are left over; 0.1× median volume. No filing beyond routine notices in the prior three sessions.Aspial −0.8 · MoneyMax +2.3 · ValueMax −0.9
28
4 Jul 2025
+9.3%
−0.1%
+0.0%
+9.3%
Residual
Against an index move of −0.1% and a peer median of +0.0%, about 9 points are left over; 2.7× median volume. No filing beyond routine notices in the prior three sessions.Aspial +0.0 · MoneyMax +0.9 · ValueMax −0.8
29
14 Aug 2025
+25.2%
−0.4%
−1.4%
+26.6%
Residual
The largest single-session gain in the window: 1.16m shares, 15.8× median volume, took the close from 0.119, where it had stood since 29 July with three small prints and no trade at all from 8 to 13 August, to 0.149. On the day the index fell 0.4% and all three peers fell (Aspial −1.4%, MoneyMax −0.7%, ValueMax −1.9%), so nothing is subtracted. The peers had, however, risen two sessions earlier: on 12 August Aspial rose 6.8% on 14.4m shares, MoneyMax 12.0% and ValueMax 6.6%, while Taka did not trade; over the week to 15 August the peer median is +4.8% and about 20 points remain. The tape is silent — nothing between the 1H FY2025 results of 12 February and the FY2025 results filed at 17:39 on 28 August, a fortnight later — and the close was 0.145–0.149 through to those results.Aspial −1.4 · MoneyMax −0.7 · ValueMax −1.9
30
week to 15 Aug 2025
+25.2%
−0.2%
+4.8%
+20.5%
Residual
Weekly window, 2025-08-08 to 2025-08-15: against an index move of −0.2% and a peer median of +4.8%, about 20 points are left over. No filing beyond routine notices inside the window.Aspial +1.5 · MoneyMax +6.5 · ValueMax +4.8
31
17 Nov 2025
−6.7%
−0.1%
+0.0%
−6.7%
Residual
Against an index move of −0.1% and a peer median of +0.0%, about 7 points are left over; 19.3× median volume. No filing beyond routine notices in the prior three sessions.Aspial +0.0 · MoneyMax −1.2 · ValueMax +1.1
32
26 Dec 2025
−7.4%
−0.0%
+2.2%
−9.7%
Residual
Against an index move of −0.0% and a peer median of +2.2%, about 10 points are left over; 1.6× median volume. No filing beyond routine notices in the prior three sessions.Aspial +4.8 · MoneyMax +2.2 · ValueMax +0.5
33
2 Jan 2026
+7.9%
+0.2%
+0.0%
+7.9%
Residual
Against an index move of +0.2% and a peer median of +0.0%, about 8 points are left over; 0.1× median volume. No filing beyond routine notices in the prior three sessions.Aspial +0.0 · MoneyMax +1.1 · ValueMax −5.1
34
23 Jan 2026
+7.1%
+1.3%
+4.9%
+2.2%
Sector-wide
Tracked the sector: against an index move of +1.3% and a peer median of +4.9%, about 2 points are left over.Aspial +10.2 · MoneyMax +4.9 · ValueMax +4.0
35
26 Jan 2026
+23.2%
−0.6%
+12.4%
+10.8%
Sector-wide
The heaviest session in the window, 17.2m shares or 232× median volume, from 0.151 to 0.186. The index fell 0.6%, but all three peers rose between 12.4% and 13.0% (Aspial +13.0%, MoneyMax +12.4%, ValueMax +12.4%), and they had already risen 4–10% the session before. On the controls this is a sector session, with about 11 points left over after the peer median. Nothing was filed by Taka between the AGM minutes of 27 November and the profit guidance of 5 February. The rise continued to 0.198 on 29 January, and on 30 January Taka fell 7.1% against peer falls of 4.1–9.6%.Aspial +13.0 · MoneyMax +12.4 · ValueMax +12.4
36
week to 30 Jan 2026
+21.9%
+0.3%
+9.3%
+12.6%
Residual
Weekly window, 2026-01-23 to 2026-01-30: against an index move of +0.3% and a peer median of +9.3%, about 13 points are left over. No filing beyond routine notices inside the window.Aspial +3.7 · MoneyMax +9.3 · ValueMax +11.4
37
9 Feb 2026
+11.7%
+0.5%
+3.7%
+8.0%
Residual
The second session after the profit guidance filed at 18:51 on 5 February, in which the company said it expected ‘a significant improvement in revenue and net profit’ for 1H FY2026 across all three segments, without figures. The first session after it, 6 February, rose 6.5% on 4.2m shares; this one rose 11.7% on 8.9m shares, 120× median volume, with the index up 0.5% and the peer median up 3.7% (MoneyMax +8.8%, Aspial +3.7%, ValueMax +2.7%), leaving about eight points. The window high of 0.225 followed on 11 February. The results themselves — revenue up 44.3% to S$119.9m, profit after tax up 59.5% to S$10.5m, an operating cash outflow of S$15.0m — were filed at 17:22 on 12 February, after that session’s 6.7% fall, and the session after them closed unchanged on 3.7m shares.Aspial +3.7 · MoneyMax +8.8 · ValueMax +2.7
38
3 Jul 2026
−7.6%
+0.5%
+6.9%
−14.5%
Residual
Against an index move of +0.5% and a peer median of +6.9%, about 14 points are left over. No filing beyond routine notices in the prior three sessions.Aspial +7.4 · MoneyMax +4.9 · ValueMax +6.9
Limitations bound every row above. The tape is every SGXNet broadcast by Taka Jewellery over 22 August 2023 to 21 August 2026 — 40 announcements, of which six are results releases, two are profit-guidance notices and one an audited-versus-unaudited variance notice; the rest are AGM and annual-report paper, director and financial-controller changes and dividend notices. Broker notes, block trades and substantial-shareholder timing, trade press and index reviews were not examined. Gold is tested separately in the 25 August driver snapshot: its three-year relationship with Taka returns is weak and horizon-dependent, so it is not subtracted as a stable control in this event chart. The 50%-owned associate Globe Diamonds Singapore Pte Ltd has no disclosure stream of its own, so its results reach the tape only through Taka's filings; the pack's entity register marks the parent's long-run tape as gapped, but the 36-month window here was enumerated in full from the SGX API. The peer control is three listed pawnbroker-jewellers (Aspial Lifestyle, MoneyMax, ValueMax) that frequently do not trade on a given session, so the peer median is often exactly zero and the sector control is weak; of the 38 detected moves, one followed a results release, two were read as market or sector moves, and 35 had no material filing in the preceding three sessions.
The share price is dated to the information cut-off: S$0.196 at the 28 August 2026 close. It is a market observation, not a live quote.
Working-capital intensity rests on two years (FY2024, FY2025), both high-growth and high-gold. Rising gold inflates inventory value mechanically, so 69% may be overstated for a flat-gold year.
The funded-asset peer proxies are not the same definition. ValueMax segment assets are closest; MoneyMax and Aspial receivables are broader. They support a directional contrast only.
Taka does not disclose a pawn-book flow bridge. Originations, redemptions, pledge/customer counts, average ticket, non-redemption and collateral realisation are missing, so segment assets cannot be decomposed into activity, collateral value, mix and share with precision.
Unverified: the September 2023 independent-director cessation count (three or four — the cessation notices were not retrieved).
Expected-credit-loss movement lines unresolved. Closing allowances reconcile exactly three ways (jewellery 6,554 + financial services 272 = group 6,826), but the roll-forward leaves a 384 residual. Closing balances are safe to use; the movement lines are not.
Limited market liquidity. The public float is 25.45%; this evidence page contains no trading-capacity or exit analysis.
Evidence base. 24 Taka primary documents, 1,489 pages, retrieved and verified for this note: annual reports FY2016–FY2025 complete, the 2015 TLV offer document, FY2025, 1H FY2026 and FY2026 results, the 27 September 2023 variance filing, FY2024 AGM minutes, and eight SIAS question-and-answer documents. The funded-asset section adds current ValueMax, MoneyMax and Aspial primary results, Registry of Pawnbrokers monthly activity data, the Pawnbrokers Act and World Gold Council market context. Every FY2026 Taka figure traces to the 28 August result; derived 2H values subtract the 1H filing from FY2026.
Cross-company read-throughs
These comparisons reuse evidence from other covered companies when a specific economic mechanism connects the source to this company; sector labels and apparent relatedness are not the test. Period, definition, geography, business mix and reporting perimeter are checked, and the external evidence remains a lead until this company's own disclosure confirms it.
Every other test on this page waits for the company to file. These do not. Each row is a series you can look up yourself, free, today — with the level this reading was built against, the levels that would put it in question, and what the series cannot tell you.
The headline gold price, in US dollars per troy ounce. It is an OTC/CFD market reference, not an official benchmark. Trading Economics (OTC/CFD market reference; LBMA benchmark averages used as the anchors)
3,432 and 2,386 US$/oz, on a move below — currently between the assumed level and the watch level
How often to look
monthly (the series prints daily)
What it points to. Gold moves reported revenue through the selling price and simultaneously inflates the inventory and pledge book the company must fund.
Direction only — this pack does not carry a coefficient from this series to reported earnings.
What it cannot tell you. Gold sets the size of the loan advanced against a pledge and the value of metal inventory; it does not set the number of pledges or the footfall through the shops. A rally alongside falling volumes can leave interest income flat. The level here is an OTC/CFD market reference, while the anchors are LBMA benchmark annual averages, so read the gap between them as approximate at the margin, never to the dollar.
Settled by FY2027 interim results and segment note, due 2027-02-28. Lead time: one pledge or stock cycle, roughly one to six months.
Watchlist reviewed on 2026-09-24; each observation has its own date above. This watchlist date does not change the company research cutoff. A series moving past a level is a reason to re-read the case, not a recommendation. The same series across every company covered: what you can watch.
Notes and sources
6 · What the record does not support
Gold — the sign of the exposure is unknown, not merely its magnitude
Management has stated both that gold movements are "reflected in the selling price" with no direct P&L impact (SIAS 2022 response) and that they have "a more significant influence on our profit margins" (SIAS 2024 response). Neither has been withdrawn. A commodity-price-risk sensitivity was published in AR-FY2019, FY2020 and FY2021, then removed from AR-FY2022 onward and never reinstated — and in any case it equalled 10% of the bullion loan balance, containing zero inventory exposure. Management separately puts gold and gold-related products at around 20% of inventory value. No gold sensitivity is published in this note for those reasons. (R/O)
Bullion loans are financing, not a disclosed hedge ratio. The S$8.617m balance was 6.1% of S$142.112m total inventory at 31 December 2025, while FY2025 gross proceeds were S$51.1m against a S$4.8m period-end balance because the 1–3 month facility is rolled. Inventory includes gold, loose diamonds and jewellery pieces, and management has separately said gold and gold-related products were around 20% of FY2024 inventory. The filings do not disclose matched metal quantities; net gold exposure is therefore not quantifiable from the bullion-loan balance. (R/D)
Download
A print-ready PDF of this page, for reading away from the screen: Taka Jewellery Holdings evidence library (PDF). It carries the same content as this page — segment economics, the funded-asset runway, the cash mechanism, the five-year record, the associate, what the record does not support, credit evidence, what would change the reading, the share price, the stated gaps and cross-company read-throughs — and the same omissions: no rating, no fair value, no forecast.
Reader questions & corrections
Ask about this company, challenge a source or suggest a factual correction. Only selected questions that SMID Research has reviewed and answered are published.
Submissions are private by default. Your email is encrypted and never published. Please do not send confidential or inside information, allegations about individuals, promotions, or requests for personalised investment advice.
Behind the lock
A complete private working view of this company exists beyond this page: the full initiation note as a PDF, the financial model workbook with live formulas, the presentation deck, scenario and valuation work, and the independent-review artifacts. It is maintained in the author's vault for the author's own records — not published, and not available for sharing. This page carries everything that is public.
These bounded retrospective corrections clarify specific published facts or calculations. They retain each report's existing research cutoff and do not represent a full refresh or a finding that all possible issues are resolved.
Taka Jewellery Holdings
Verified Fact. FY2026 inventory was S$138.277m versus S$130.539m, up 5.93%; trade and other receivables were S$126.248m versus S$77.626m, up 62.64%. Sources: Source. Limitation: These use the filing's June balance-sheet comparators; separate historical rounded chronology is retained.
Transcripts
Find available event transcripts in the transcript library.