Singapore · Pawnbroking, gold & luxury retail and secured lending
SGX: 5WJ · Information cut-off 27 August 2026
Investor snapshot
Business model
MoneyMax earns pawn interest, gold and luxury trading margins, and interest on a separate secured-loan book.
Latest figures
In 1H2026 revenue rose 34.1% and profit attributable to owners rose 77.3% to S$52.5m; at 30 June gross debt was S$1.016bn against S$34.3m of cash, and 69.1% of debt was current.
Main risk
The central risk is refinancing a rapidly growing collateral and inventory book when usable cash covers only a small share of near-term funding.
Next proof
The next test is the FY2026 filing's receivables, operating cash flow, refinancing mix and disclosed covenant headroom.
Evidence balance
The live questionAs the collateral book expands, what funds receivables growth once pre-working-capital cash generation is absorbed and short-term debt must be rolled?The question matters now because 1H2026 closed with 69.1% of S$1.016bn of debt due within one year, so each half's book growth has to be carried alongside near-term maturities.
What improved
In 1H2026 revenue rose 34.1% and profit attributable to owners rose 77.3% to S$52.5m; pawn PBT of S$35.5m moved ahead of retail PBT of S$31.7m for the half, and operating cash flow before working capital reached S$98.4m.
What became more demanding
In the same half receivables absorbed S$219.6m and inventory S$13.0m, turning profit into a S$153.5m operating outflow funded alongside S$436.5m of borrowing proceeds and S$286.0m of repayments, against balance-sheet cash of S$34.3m.
Strongest alternative explanation
Negative operating cash flow could be deployment rather than deterioration: pawn advances and stock are the assets themselves, so receivables growth would be consistent with lending into demand, and the reported current ratio of 1.60 times and interest coverage of 4.49 times do not by themselves establish strain.
The decisive missing fact
The decisive disclosure is a maturity-and-liquidity ladder with quantified committed funding capacity: the FY2026 filing's receivables, operating cash flow, refinancing mix and disclosed covenant headroom would settle it.
Drawn from the evidence on this page: the improvement, the constraint, the benign reading and the fact that would settle it. It states no view on the shares.
About the private research record
Also on file behind the lock: integrated equity and credit initiation, provisional decision bridge, covenant/recovery gap register, source archive, chart suite and review record. Rated view 🔒
Public evidence viewNo proprietary rating, fair value, price target, forecast or recommendation is published here. The protected research remains private.
On this page
The reading
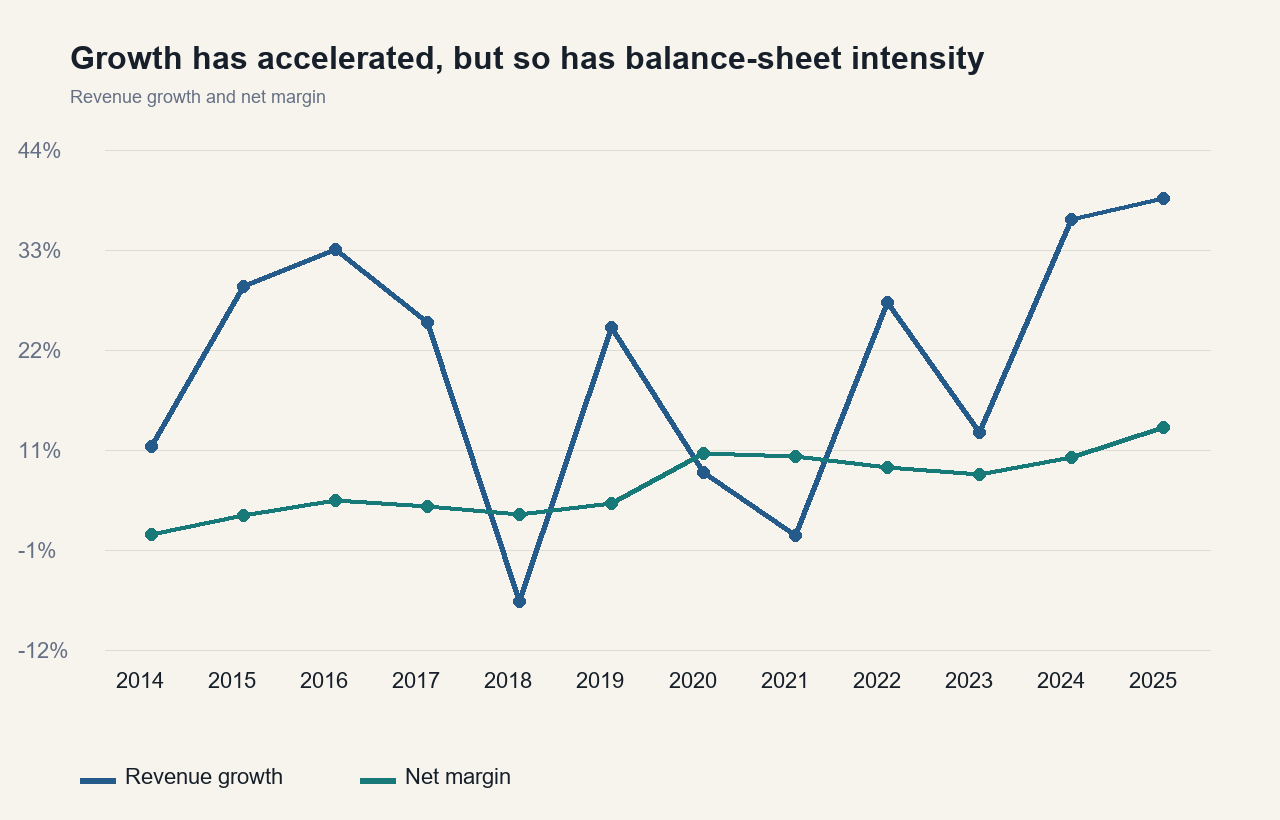
FY2025 revenue rose 38.9% to S$541.9m and PATMI rose 87.6% to S$71.7m. In 1H2026, revenue rose 34.1% and PATMI 77.3% to S$52.5m. Pawnbroking and gold/luxury were the principal profit engines. The counterweight is balance-sheet intensity: receivables reached S$1.230bn and gross debt S$1.016bn by 30 June 2026.
The credit fulcrum69.1% of debt was current, 70.3% secured and cash covered 4.9% of current debt. Positive accounting interest cover does not remove the need to keep refinancing a growing collateral book.
Business anatomy · where revenue and profit come from
Three linked engines: pawn credit, luxury retail and secured lending
MoneyMax advances against collateral, sells gold and luxury goods, and runs a separate secured-loan book; the three paths return cash differently.
Compare the business lines; dated mix appears only where reported segments map cleanly to a card.
What happensOther borrowers pledge property or security for a longer secured loan outside the pawn counter.
How it earnsPrincipal, interest and fees are collected over the credit term.
Original SMID Research comic. AI-assisted, analyst-directed monochrome artwork depicts the evidenced operating steps of MoneyMax Financial Services Ltd; deterministic captions and dated mix figures state the economics using issuer disclosures available to 2026-08-27. The drawings are representative—not issuer artwork, an exact product or site design, a statement of scale, or a company forecast.
Investor translation
What matters after the operating picture
Four questions connect the business model to cash and balance-sheet risk. This is a factual reading aid, not a valuation or recommendation.
Value lever
Sustainable return on equity after funding costs, credit losses and inventory carrying costs.
Cash bottleneck
Pawn loans, secured receivables and jewellery stock grow before redemption, repayment or sale.
Balance-sheet pressure
Realizable short-term assets and committed funding cease to cover short-term maturities.
Next proof
Loan-cohort collections, credit losses, stock turns and the maturity-and-liquidity ladder.
Text version of this comic
Business line · Appraise and advance A pawn customer pledges a valuable; MoneyMax appraises and stores it, then advances a cash loan. Reported mix: FY2025 revenue 17.9%; segment PBT before elimination 42.2% (D).How it earns: Interest is collected when the pledge is redeemed or renewed.
Capital recovery · Move collateral into stock If a pledge is not redeemed, the collateral can leave the loan book and enter the resale or gold-processing flow. Recovery driver: Recovery depends on the realised value of the collateral.
Business line · Merchandise and sell Purchased stock and eligible forfeited items are sorted and sold through retail or wholesale channels. Reported mix: FY2025 revenue 77.5%; segment PBT before elimination 51.1% (D).How it earns: Buyers pay for gold, jewellery, watches or other luxury goods; MoneyMax keeps the trading margin.
Business line · Underwrite a separate book Other borrowers pledge property or security for a longer secured loan outside the pawn counter. Reported mix: FY2025 revenue 4.5%; segment PBT before elimination 6.7% (D).How it earns: Principal, interest and fees are collected over the credit term.
Thirteen years of listed history
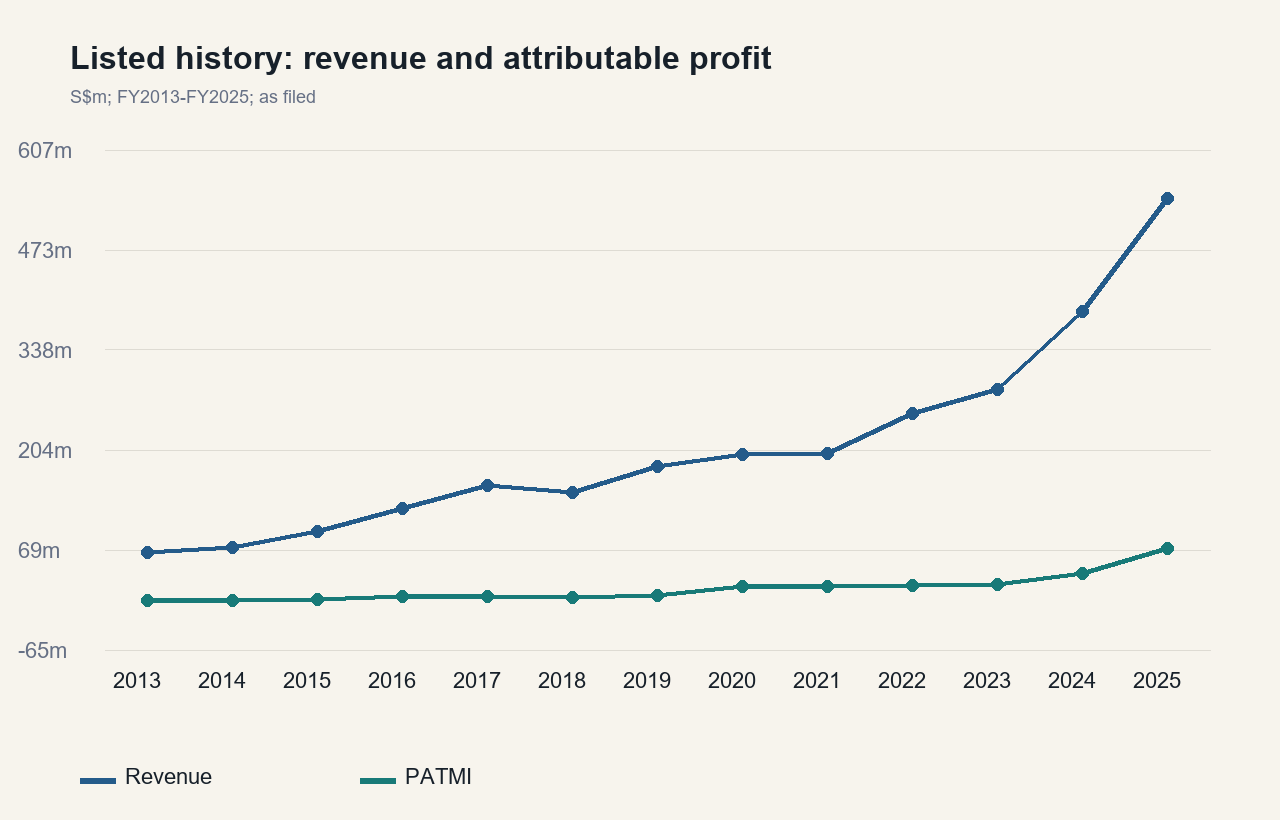
Revenue increased from S$65.6m in FY2013 to S$541.9m in FY2025; PATMI increased from S$1.8m to S$71.7m. The acceleration after FY2023 coincided with rapid expansion in receivables, inventory and debt.
FY
Revenue S$m
PATMI S$m
Owner equity S$m
Debt S$m
2013
65.6
1.8
57.9
93.5
2014
72.9
0.9
57.8
110.5
2015
94.0
3.1
59.7
119.0
2016
125.2
6.2
64.2
146.3
2017
156.4
6.8
69.3
163.8
2018
146.5
5.0
72.1
169.8
2019
182.2
8.5
78.8
182.5
2020
197.1
20.4
97.6
235.4
2021
199.2
19.8
113.4
331.2
2022
253.5
22.1
131.2
412.9
2023
285.7
22.7
146.6
501.2
2024
390.1
38.2
183.9
630.9
2025
541.9
71.7
252.9
868.6
Table basis. Revenue, PATMI and owner equity use each year’s contemporaneous annual report; later revisions are set out separately below. Debt is the reported current plus non-current “other financial liabilities” balance and excludes separately presented lease liabilities. The S$93.5m–S$235.4m FY2013–FY2020 debt series is newly reconstructed from notes 22–25 of those annual reports; the former public table left all eight cells blank.
The listing prospectus reaches three years further back than the listed-history table. Revenue rose from S$41.7m in FY2010 to S$75.6m in FY2012 as the network expanded, before falling to S$65.6m in FY2013. The FY2013 annual report attributed that reversal to lower gold prices and a deliberate shift away from wholesale trading towards retail. The pawn book nevertheless increased from S$115.3m at FY2012 to S$128.4m at FY2013, while pawn interest revenue was almost flat at S$17.4m. That is the first useful warning against reading group revenue as a loan-volume proxy.
The next inflection was profitability rather than sales. FY2014 restated PBT was S$1.4m and restated PATMI S$0.9m; FY2018 PATMI was S$5.0m on S$146.5m revenue. By FY2020, revenue was only 34.6% above FY2018 at S$197.1m, but PATMI had risen to S$20.4m. The FY2020 annual report recorded S$160.7m of retail and luxury revenue and said higher gold prices contributed to the increase. It also showed why the income statement needs care: MoneyMax reports expenses by nature and does not present a statutory gross-profit subtotal.
From FY2021 to FY2025, revenue rose from S$199.2m to S$541.9m and PATMI from S$19.8m to S$71.7m. Over the same period, receivables increased from S$368.7m to an audited S$1.011bn and debt from S$331.2m to S$868.6m. Earnings therefore accelerated alongside a much larger funded-asset base. The record establishes scale and profitability; it does not by itself distinguish volume, collateral-price, ticket-size, mix and acquisition effects.
From 27 Singapore outlets to a regional collateral network
MoneyMax’s 2013 prospectus dates the first pawnbroker’s licence and Yishun outlet to 2008. The network reached ten outlets in 2010 and twenty in 2012. At the prospectus’s 14 June 2013 latest practicable date, 27 outlets were operating: 26 under MoneyMax and one Cash Online, all in Singapore. Two additional licensed Serangoon Road premises had not started operating, which is why the prospectus’s property list contained more premises than the operating count.
The early economics were already more complicated than “pawnshop chain” suggests. In FY2012, pawnbroking generated S$17.5m of external revenue and S$5.7m of segment PBT, while retail and trading generated S$58.1m of external revenue. The pawn book was S$115.3m and pawn segment assets S$138.0m. Inter-segment sales from pawnbroking into retail were S$10.8m, evidence of unredeemed collateral moving from a credit process into inventory and sale.
The prospectus also exposes how concentrated the trading leg could be. Jin Heng Goldsmiths represented 65.0% of retail and trading revenue in FY2010, 40.1% in FY2011 and 15.7% in FY2012. Kaloti Jewellery represented 37.5% in FY2012 after contributing nothing in the prior two years. The top two customers together produced S$30.9m, or about 41% of group revenue, in FY2012. Those are historical prospectus figures, not a claim about the current customer book; they explain why revenue can move sharply with wholesale counterparties and gold flows.
Expansion then moved across the causeway. The FY2021 annual report described 76 outlets across Singapore and Malaysia; FY2022 said more than 90; FY2023 said 100. The FY2024 annual report gave an exact 106-store count. FY2025 added eight stores, including five acquired with CChaw Holdings in November 2025, and closed with 113 outlets, including 15 Malaysian drive-through locations. The issuer’s 1H2026 results release reports 139 stores following 26 new store openings in 2026. It does not establish a June-end store total.
Date
Filed network evidence
Source and perimeter
2008
1 outlet
First Yishun outlet; 2013 prospectus
14 Jun 2013
27 operating outlets
26 MoneyMax + 1 Cash Online; Singapore only
31 Mar 2014
32 outlets
FY2013 annual report; Singapore only
FY2021 report
76 outlets
Singapore and Malaysia
FY2022 report
More than 90 outlets
Singapore and Malaysia; rounded description
FY2023 report
100 outlets
Singapore and Malaysia
FY2024 report
106 stores
Singapore and Malaysia
31 Dec 2025
113 outlets
Includes 15 Malaysian drive-through outlets
1H2026 results release
139 stores
26 new openings in 2026; precise as-of date not stated in the release
Read the unit correctlyThe network total is a stock of 139 stores; 26 new openings in 2026 is a separate flow. The release does not identify the network total as a June-end observation.
The filings rewrite parts of the history
MoneyMax’s historical record is not a single immutable series. The FY2015 annual report finalised purchase-price accounting for the 2014 Malaysian acquisitions and restated FY2014 depreciation and amortisation from S$2.271m to S$2.327m, PBT from S$1.422m to S$1.366m and PATMI from S$0.916m to S$0.872m. The FY2016 annual report then finalised the next acquisition accounting and restated FY2015 depreciation and amortisation from S$2.069m to S$2.086m, PBT from S$3.786m to S$3.769m and PATMI from S$3.122m to S$3.115m.
Share-count changes rewrite per-share history even when group profit is unchanged. FY2019 EPS was first filed at 2.40 cents. FY2020 EPS was first filed at 5.76 cents, but the FY2021 annual report restated the comparative to 4.61 cents after an 88.45m-share bonus issue. A second one-for-one bonus issue in September 2025 doubled issued shares to 884.5m and the FY2025 five-year highlights restated FY2023 EPS to 2.56 cents. Comparing EPS from old annual reports without following the bonus-adjusted denominator overstates growth.
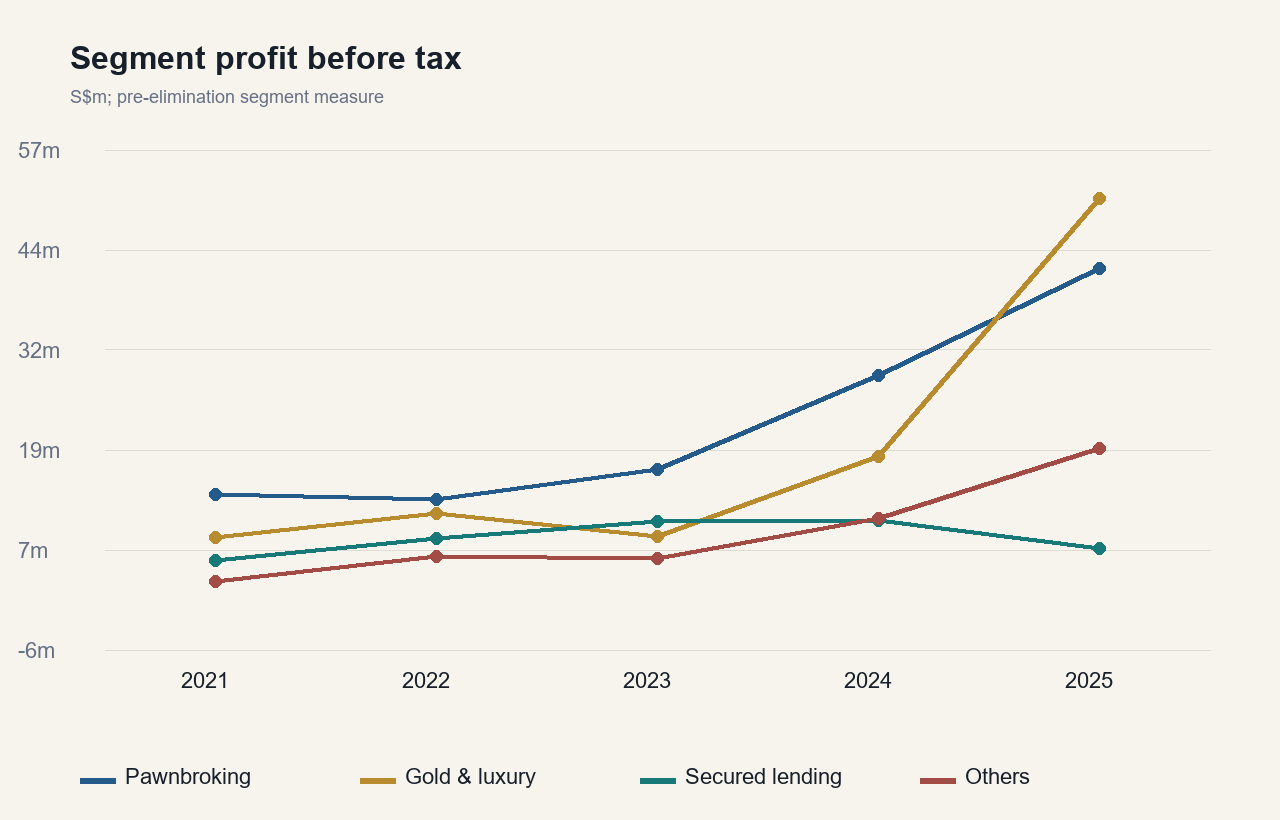
The largest recent change was segment classification. The FY2024 annual report first allocated S$94.3m of revenue and S$28.5m of PBT to pawnbroking, versus S$266.6m and S$18.3m to retail. The FY2025 annual report recast the same FY2024 group totals to S$66.4m of pawn revenue and S$22.1m of pawn PBT, and S$294.5m of retail revenue and S$24.7m of retail PBT. S$27.8m of revenue and S$6.4m of segment result moved between the two lines; group revenue and group PBT did not change.
That recast changes the conclusion drawn from the segment record. On the original FY2024 filing, retail PBT first overtook pawn PBT in FY2025. On the later authoritative comparative, retail had already overtaken pawn in FY2024. FY2023 was not recast in the annual-report segment note, so a clean FY2023-to-FY2024 growth rate by segment cannot be made from the annual reports alone. The table below therefore begins at the recast FY2024 base.
The FY2025 audited balance sheet also superseded the results announcement: total assets moved from S$1,236.6m to S$1,235.4m and current receivables from S$842.2m to S$841.0m, with a matching movement elsewhere in the statement. The FY2025 cash-flow statement restated FY2024 operating cash flow before working-capital changes from S$104.4m to S$105.8m and the receivables movement from S$149.2m to S$150.5m. The 1H2026 filing similarly recast 1H2025 operating cash flow before working capital from S$61.4m to S$62.2m. Current audited or later-comparative values take precedence on this page.
Series disciplineGroup totals are usually stable; classifications, per-share denominators and cash-flow components are not. Every comparison below states whether it uses an original or a later recast basis.
SMID Research; MoneyMax filings; figures as filed or derived.SMID Research; MoneyMax filings; figures as filed or derived.SMID Research; MoneyMax filings; figures as filed or derived.SMID Research; MoneyMax filings; figures as filed or derived.SMID Research; MoneyMax filings; FY2024 uses the originally filed segment classification. See “The filings rewrite parts of the history” for the later FY2024 recast.SMID Research; MoneyMax filings; figures as filed or derived.SMID Research; MoneyMax filings; figures as filed or derived.SMID Research; MoneyMax filings; figures as filed or derived.
The profit mix shifted twice
The FY2025 annual report’s current comparative basis shows three operating engines plus an “Others” segment and a group elimination. FY2024 external revenue was recast to S$66.4m pawnbroking, S$294.5m retail and trading, S$28.6m secured lending and S$0.6m Others. The corresponding segment PBT figures were S$22.1m, S$24.7m, S$10.2m and S$10.5m before a S$14.9m elimination.
In FY2025, retail and trading revenue rose to S$420.1m and PBT to S$50.9m. Pawnbroking revenue was S$97.1m and PBT S$42.0m. Secured lending moved in the opposite direction: revenue fell to S$24.3m and PBT to S$6.7m. “Others” produced S$19.3m PBT before a S$23.0m group elimination, so adding the four segment PBT numbers gives the wrong group result.
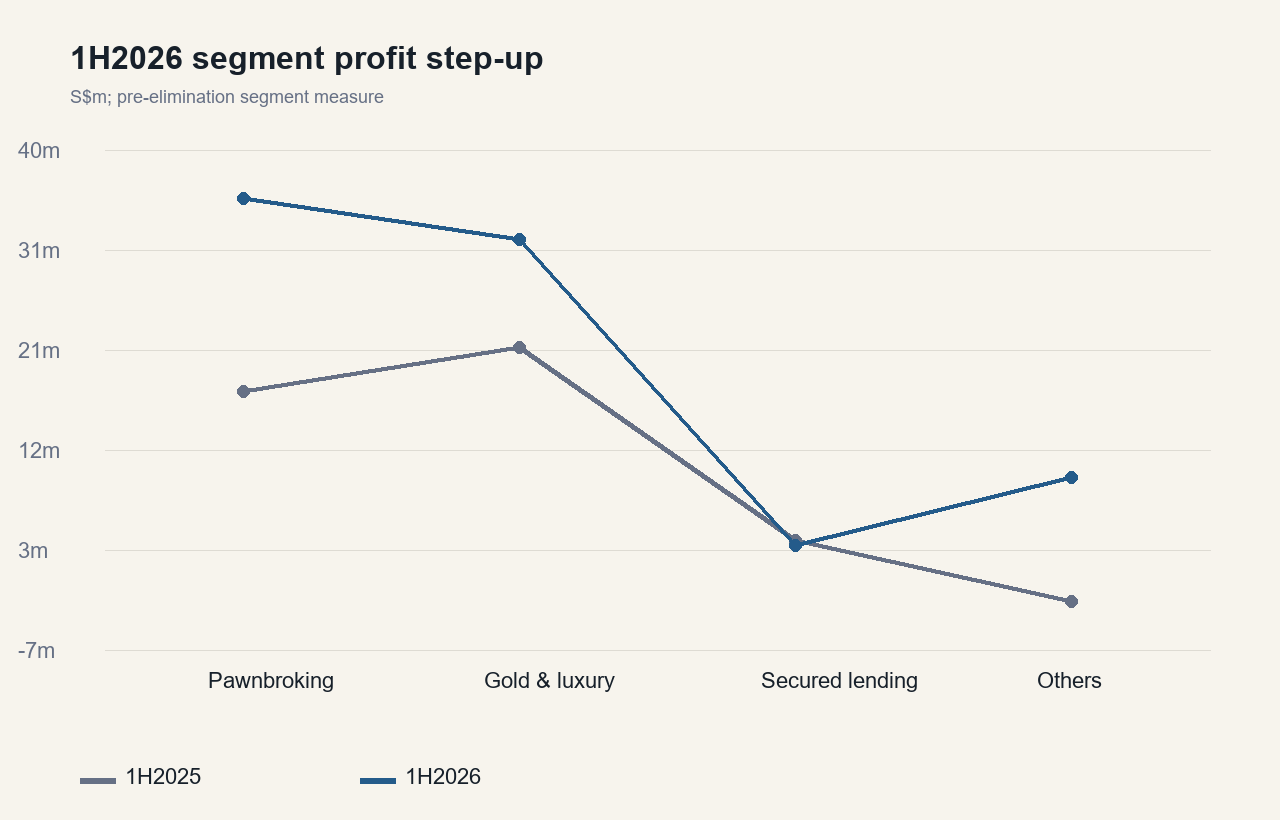
The 1H2026 filing showed another rotation. Pawn revenue rose to S$69.2m and pawn PBT to S$35.5m, ahead of retail PBT of S$31.7m for the half. Secured-lending PBT fell to S$2.9m from S$3.4m a year earlier. The half-year group PBT of S$69.5m includes the negative S$10.0m elimination; segment percentages calculated before handling that line can misstate the mix.
Period, S$m
Pawn revenue
Retail revenue
Secured revenue
Pawn PBT
Retail PBT
Secured PBT
Others PBT
Elimination
Group PBT
FY2024 recast
66.4
294.5
28.6
22.1
24.7
10.2
10.5
(14.9)
52.6
FY2025
97.1
420.1
24.3
42.0
50.9
6.7
19.3
(23.0)
95.8
1H2025
43.3
187.7
11.9
17.4
21.6
3.4
(2.3)
0.0
40.1
1H2026
69.2
245.0
11.2
35.5
31.7
2.9
9.3
(10.0)
69.5
The table’s FY2024 row uses the FY2025 annual report’s recast comparative. The 1H2025 and 1H2026 rows use the 1H2026 results. “Others” includes investment holding on the four-segment basis. The elimination is shown explicitly because the operating-segment PBT rows are not additive.
Geography is a separate lens. FY2025 revenue was S$463.2m in Singapore and S$78.8m in Malaysia, versus S$339.0m and S$51.1m in FY2024. In 1H2026 the filing reported S$279.7m Singapore revenue and S$46.0m Malaysia revenue. The half-year presentation also gave geographical PBT of S$48.1m for Singapore and S$21.4m for Malaysia. Those geography figures should not be mixed with business-segment margins: the two tables answer different questions.
The operating asset is the balance sheet
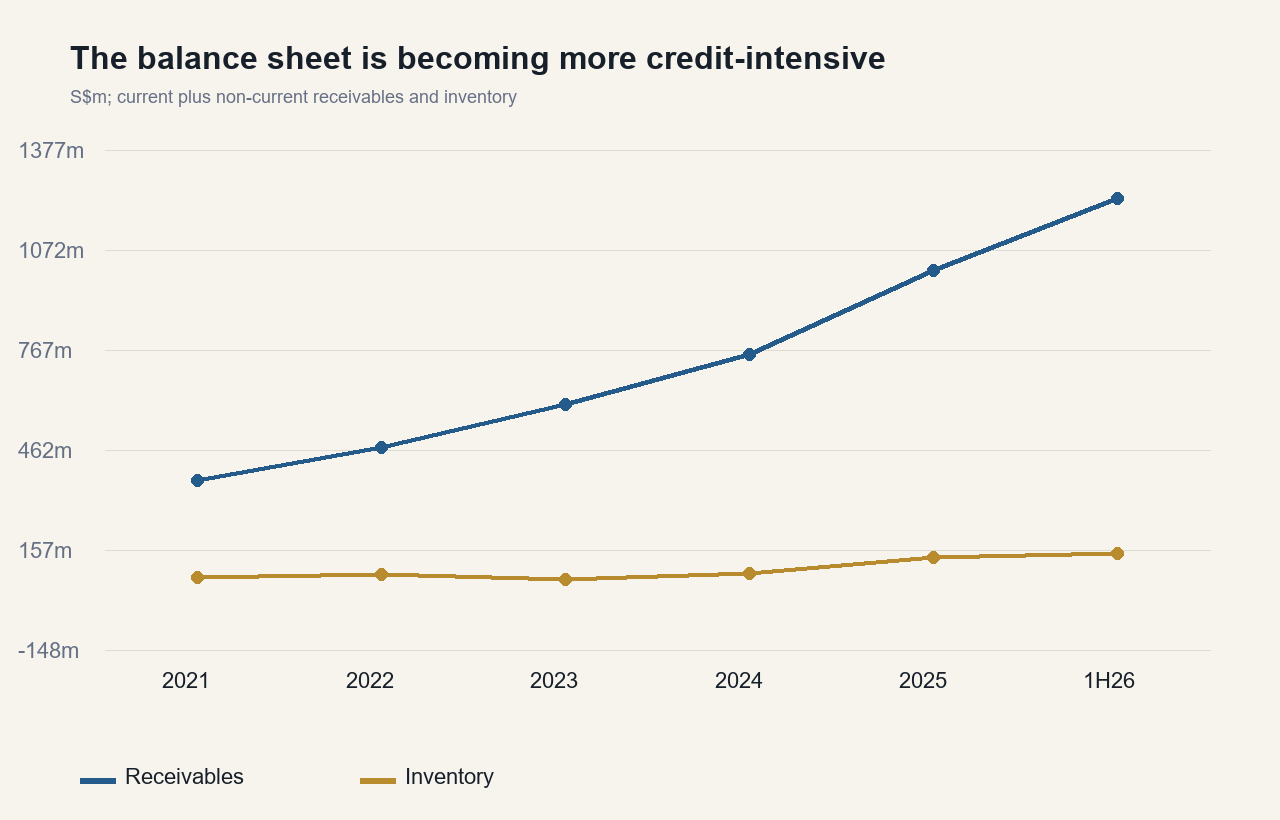
For a collateral lender, receivables and inventory are not incidental working-capital lines. They are the assets being deployed. Current plus non-current trade and other receivables increased from S$368.7m at FY2021 to an audited S$1.011bn at FY2025 and S$1.230bn at 30 June 2026. Inventory rose from S$73.2m to S$134.5m and S$147.5m over the same dates.
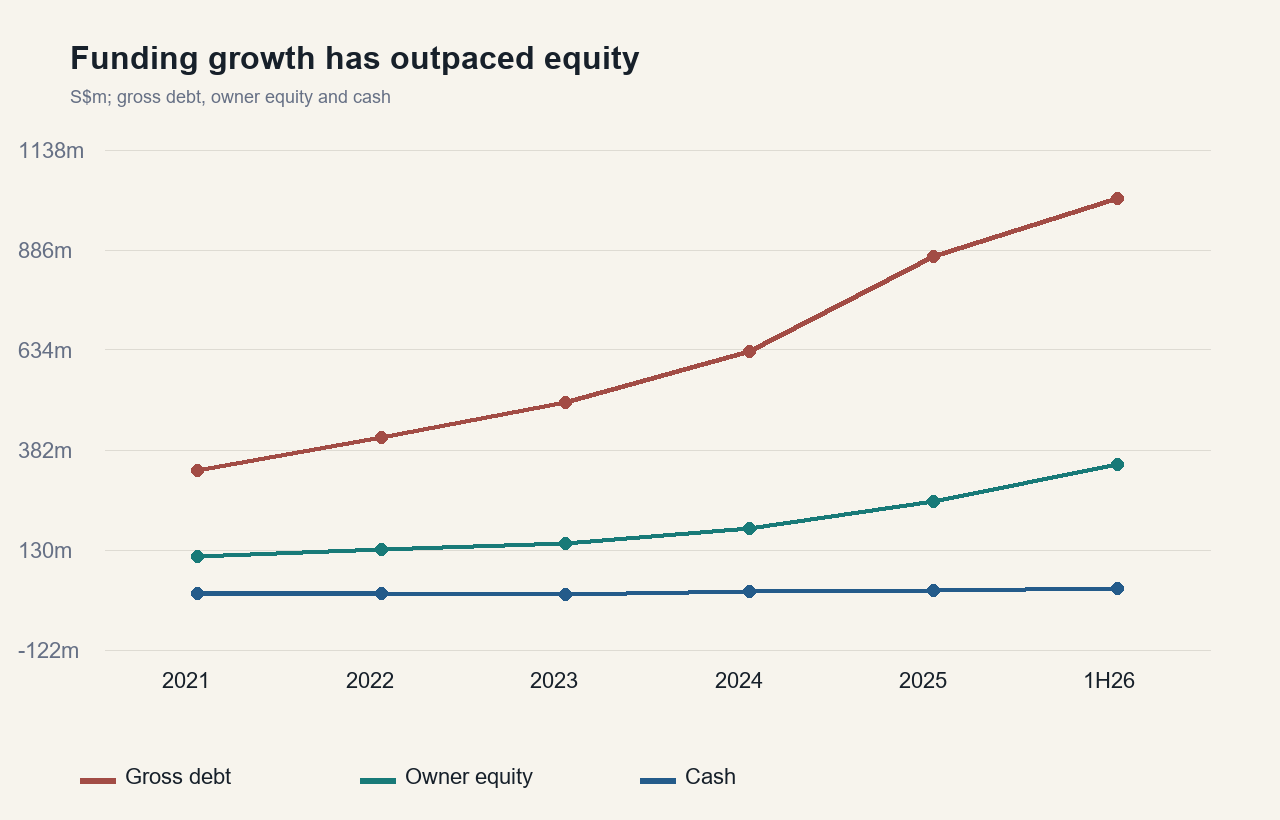
Debt followed that asset growth. Current plus non-current other financial liabilities increased from S$331.2m at FY2021 to S$868.6m at FY2025 and S$1.016bn at 30 June 2026. Owner equity rose from S$113.4m to S$252.9m and S$346.6m, helped in 1H2026 by the placement and scrip-dividend shares. Cash rose much less, from S$19.8m at FY2021 to S$34.3m at 30 June 2026.
S$m
FY2021
FY2022
FY2023
FY2024
FY2025 audited
1H2026
Receivables
368.7
470.7
600.7
753.5
1,010.8
1,229.6
Inventory
73.2
81.8
68.6
84.7
134.5
147.5
Debt
331.2
412.9
501.2
630.9
868.6
1,016.1
Owner equity
113.4
131.2
146.6
183.9
252.9
346.6
Cash
19.8
20.9
18.5
25.3
28.4
34.3
Reported operating cash flow
(66.3)
(45.6)
(46.7)
(71.2)
(178.0)
(153.5)
Two cash definitions appear in the filings. The balance sheet showed S$28.4m at FY2025 and S$34.3m at 30 June 2026. The cash-flow statement, after deducting bank overdrafts, showed S$23.3m and S$32.1m. Both are reported facts; substituting one for the other changes liquidity ratios.
At FY2025, S$970.6m of receivables and S$134.2m of inventory were under fixed and floating charges for borrowings. This is why a higher collateral book can support more funding while simultaneously tying more operating assets to lenders. It also means gross receivables cannot be treated as freely deployable liquidity.
Profit arrives before the cash comes back
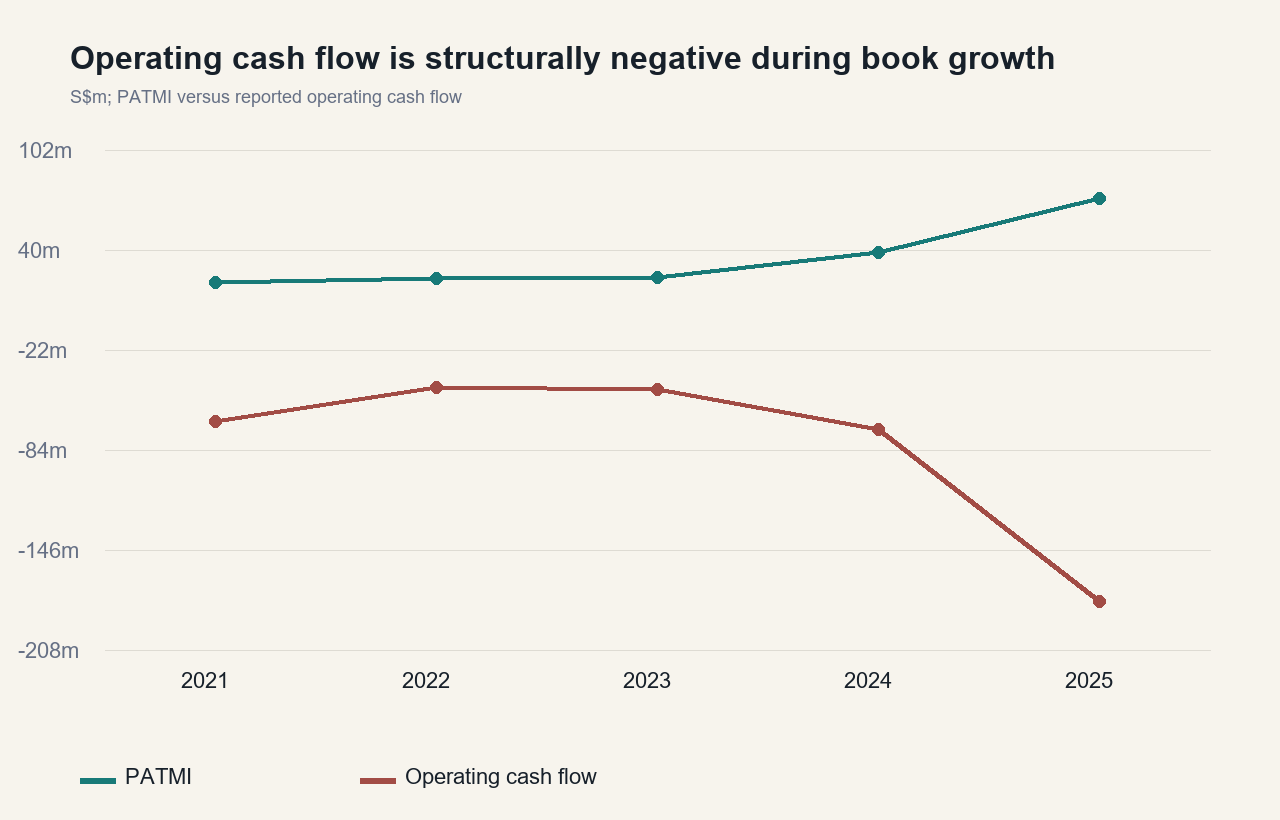
The cash-flow statement shows the mechanism directly. MoneyMax generated positive operating cash flow before changes in working capital in every period below. Net operating cash flow turned negative when receivables and, in several years, inventory expanded faster than that pre-working-capital cash generation.
Period, S$m
OCF before working capital
Receivables movement
Inventory movement
Net operating cash flow
Net new borrowings, derived
FY2019 restated
32.5
(27.3)
1.6
8.9
—
FY2020
45.2
(42.9)
(9.3)
(12.5)
—
FY2021
46.7
(92.5)
(30.8)
(66.3)
95.0
FY2022
57.5
(102.0)
(8.5)
(45.6)
81.1
FY2023
68.9
(130.0)
13.1
(46.7)
82.1
FY2024 restated
105.8
(150.5)
(16.2)
(71.2)
124.5
FY2025
153.5
(248.2)
(49.8)
(178.0)
235.2
1H2026
98.4
(219.6)
(13.0)
(153.5)
150.5
“Net new borrowings” is SMID Research arithmetic: proceeds from loans and borrowings less repayments in the same cash-flow statement. It was S$95.0m in FY2021, S$81.1m in FY2022, S$82.1m in FY2023, S$124.5m in FY2024, S$235.2m in FY2025 and S$150.5m in 1H2026. The derived line does not include equity proceeds.
FY2025 is the clearest example. Operating cash flow before working capital was S$153.5m. Receivables absorbed S$248.2m, inventory S$49.8m and trade and other payables S$20.9m, leaving reported operating cash outflow of S$178.0m. Borrowings provided S$591.8m and repayments used S$356.7m. Accounting profit was positive; cash still had to be raised because loan-book and inventory deployment preceded collection.
In 1H2026, operating cash flow before working capital was S$98.4m, while receivables absorbed S$219.6m and inventory S$13.0m. The resulting S$153.5m operating outflow was funded alongside S$436.5m of borrowing proceeds, S$286.0m of repayments and S$43.5m of net placement proceeds. This is the page’s central cash-conversion test: compare receivables growth with pre-working-capital cash generation, repayments and new funding, not PATMI alone.
Funding is diversified, but most of it is near term
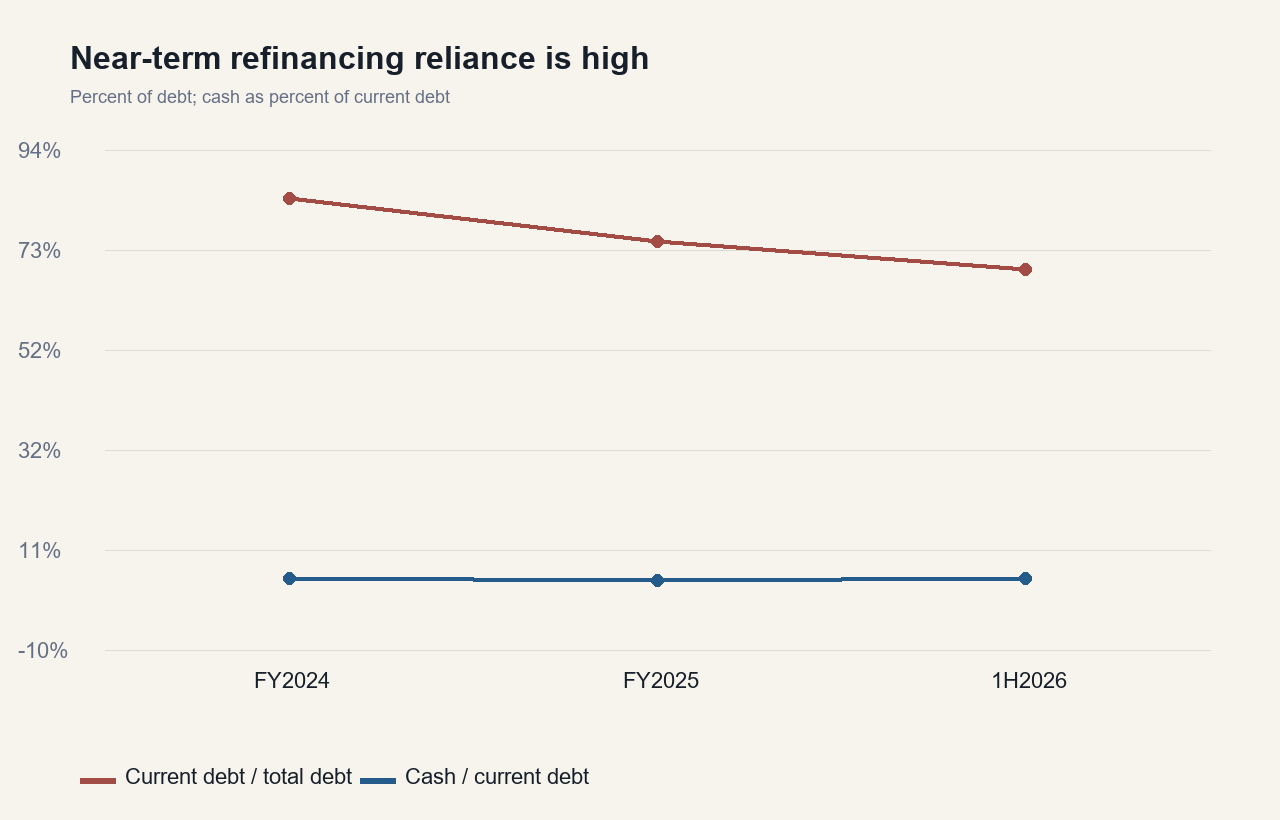
At 30 June 2026, S$701.9m of S$1.016bn debt was due within one year. The filing split that current balance into S$592.1m secured and S$109.8m unsecured. A further S$314.2m was due after one year: S$121.9m secured and S$192.2m unsecured. On that arithmetic, 69.1% of debt was current and 70.3% secured.
30 Jun 2026, S$m
Secured
Unsecured
Total
Share of total debt
Due within one year
592.1
109.8
701.9
69.1%
Due after one year
121.9
192.2
314.2
30.9%
Total
714.1
302.0
1,016.1
100.0%
The FY2025 audited note showed S$96.5m of current unsecured commercial paper and S$100.0m of non-current unsecured medium-term notes. By 1H2026, the public funding stack included S$130m of 5.0% notes due 30 October 2028, RM200m of 5.70% notes due 25 June 2029, bank facilities and commercial paper. The S$ notes are parent-guaranteed and contain a Lim-family change-of-control put. The Malaysian notes carry joint guarantees and an external MARC AA-(cg)/Stable opinion. External ratings are evidence, not SMID Research opinions.
The 1H2026 presentation reported a current ratio of 1.60 times and interest coverage of 4.49 times. Those accounting ratios answer whether current assets exceed current liabilities and whether earnings cover period interest. They do not turn receivables pledged to lenders into cash on hand. At the same date, balance-sheet cash of S$34.3m was 4.9% of current debt.
Related parties also appear in the funding record. The FY2025 annual report recorded S$2.075m of loan interest to the SK Group, S$1.016m to Lim Yong Guan, S$0.337m to Money Farm and S$0.317m to Tan Yang Hong. It separately recorded S$1.167m of interest expense to directors. These are filed interested-person and related-party amounts; they should not be combined without following the note’s counterparty perimeter.
The decision-relevant boundary remains the legal and maturity detail. This page can show the filed secured/unsecured and current/non-current splits, named notes, collateral charges and related-party interest. It cannot reconstruct an instrument-by-instrument monthly maturity waterfall or a legal-entity recovery waterfall from those aggregate rows alone.
The denominator changed four times
MoneyMax had 353.8m issued shares at FY2019 and FY2020. A bonus issue allotted 88.45m new shares in October 2021, taking the total to 442.25m. The September 2025 one-for-one bonus issue added another 442.25m and doubled the total to 884.5m. Neither bonus issue raised new cash; both changed historical per-share comparability.
The April 2026 compliance placement was different. It issued 53.0m shares at S$0.835, for S$44.3m gross consideration and S$43.484m credited to share capital after costs. The 1H2026 filing said those net proceeds were fully utilised by 15 July 2026. A June 2026 scrip dividend then issued 17.932648m shares and credited S$16.081m to share capital.
Date
Action
New shares
Issued shares after action
Cash effect
31 Dec 2020
Opening listed base
—
353.800m
—
13 Oct 2021
Bonus issue
88.450m
442.250m
No new cash
17 Sep 2025
One-for-one bonus issue
442.250m
884.500m
No new cash
24 Apr 2026
Compliance placement
53.000m
937.500m
S$43.484m net
24 Jun 2026
Scrip dividend
17.933m
955.433m
S$16.081m credited to share capital
At 30 June 2026 the filing gave an exact 955,432,646 issued shares, with no treasury shares, subsidiary holdings or convertibles. That exact count is the correct denominator for the period-end NAV per share. Weighted-average shares for EPS are different because the placement and scrip shares were not outstanding for the full half.
The Mainboard transfer explains the placement. At 11 February 2026, 105.5m of 884.5m shares, or 11.93%, were in public hands, below the 15% requirement applicable to the company’s market-cap band. The EGM approved a compliance placement; the April allotment used 53.0m of the maximum 88.5m shares authorised.
Control is concentrated; the independent bench is new
At 16 March 2026 the register contained 1,153 shareholders, but the top twenty held 822.0m shares, or 92.94% of the then issued capital. The Mainboard circular’s 11 February snapshot gave Lim Yong Guan 110.925m shares directly and 549.210m deemed, equal to 12.54% and 62.09% respectively before the April placement and June scrip issue. Those percentages are date-specific and should not be carried over to the larger 30 June denominator.
The FY2025 board had five directors: executive chairman and CEO Lim Yong Guan; non-executive director Lim Yong Sheng; and independent directors Lim Yeow Hua, Ko Chuan Aun and Ong Beng Hong. The two Lims are brothers. Three independents therefore form the numerical majority on a five-member board.
All three independent seats changed at the 26 April 2024 AGM. Ng Cher Yan, Khua Kian Kheng Ivan and Foo Say Tun had been appointed in June 2013 and left after almost eleven years. Lim Yeow Hua, Ko Chuan Aun and Ong Beng Hong joined on the same day. The FY2023 annual report had already linked the change to the end of the transitional tenure period, so the refresh was rules-driven rather than evidence of a disclosed operating dispute.
The new bench also has an unusual funding connection. Lim Yeow Hua disclosed S$0.3m of direct commercial-paper holdings at both the start and end of FY2025, while his deemed interest through Yeh Siew Ho rose to S$0.8m. The annual report recorded S$1.167m of aggregate interest expense to directors. The filed numbers establish an economic relationship; they do not allocate that aggregate interest expense to each director.
RSM SG Assurance LLP issued an unmodified FY2025 audit opinion. Lee Mong Sheong had been engagement partner since FY2021. FY2025 fees were S$0.274m to the company auditor, S$0.185m to other auditors and S$0.132m of non-audit fees to the company auditor, principally for tax compliance and agreed-upon procedures according to the annual report.
The meeting minutes reveal what the accounts do not foreground
No advance questions were received for the 28 April 2026 AGM, but shareholders questioned management from the floor. One asked why secured-lending revenue had fallen to S$24.3m and whether the activity remained core. The CFO said resources had been reallocated to pawnbroking and confirmed secured lending remained one of the group’s core segments.
A second question pointed to reports of Malaysian pawnshops becoming cash-strapped as gold prices rose and asked how MoneyMax funded growth. Management named commercial paper, medium-term notes, equity and bank relationships. Asked whether the parent funded Malaysian subsidiaries, the CFO said yes and added that those subsidiaries had their own funding sources. That answer confirms multiple channels; it does not quantify committed capacity.
The 19 March 2026 EGM minutes are equally useful on the Mainboard transfer. Management described the move as a natural progression intended to enhance the market profile and broaden the investor base. When shareholders challenged the possible 10% placement discount, the board said 10% was a cap rather than a target, that no placement agent had yet been appointed and that the company could remain on Catalist if acceptable terms were unavailable.
The polls show where minority concern was concentrated. The Mainboard transfer received 795.651m votes for and none against. The compliance placement received 795.498m for and 0.153m against. At the AGM, the ordinary share-issue mandate attracted 9.356m votes against, the largest dissent at 1.17%, while the auditor reappointment drew 3.366m against. The interested-person mandate had only 19.923m votes eligible after 778.972m Lim-family and related shares abstained.
Governance readingThe company passed every resolution by a wide margin. The more informative evidence is the denominator: concentrated control means the dilution and interested-person resolutions should be read with the abstention and eligible-vote counts beside the headline percentage.
What would change the evidence reading
Receivables growth versus operating cash flow before working capital, not PATMI alone.
Current and secured debt shares, balance-sheet cash and the proceeds-versus-repayments funding roll-forward.
Pawn, retail and secured-lending PBT on one consistent segment basis.
Collateral and inventory charges, realised recoveries and the allowance recognised in the next filing.
Gold-price and turnover changes against retail PBT rather than group revenue alone.
The exact issued-share denominator after any placement, bonus or scrip action.
Cross-company read-throughs
These comparisons reuse evidence from other covered companies when a specific economic mechanism connects the source to this company; sector labels and apparent relatedness are not the test. Period, definition, geography, business mix and reporting perimeter are checked, and the external evidence remains a lead until this company's own disclosure confirms it.
Every other test on this page waits for the company to file. These do not. Each row is a series you can look up yourself, free, today — with the level this reading was built against, the levels that would put it in question, and what the series cannot tell you.
Read the headline 3-month compounded figure and the quarter-end date shown on the current-SORA page. Monetary Authority of Singapore, quarterly reading republished by Propkaki
Last recorded
1.06 %, 2026-06-30
What the reading assumes
1.2 % (approximate level at the last financial year end, mid-December 2025)
Watch / alert
2.2 and 3 %, on a move above — currently at or better than the level the reading assumed
How often to look
quarterly (the series prints quarterly)
What it points to. A higher reference rate can raise floating and newly refinanced funding costs while pawn pricing remains statutorily capped.
Direction only — this pack does not carry a coefficient from this series to reported earnings.
What it cannot tell you. SORA covers only relevant floating or newly priced SGD funding. Fixed-rate notes, Malaysian-ringgit debt, lender spreads and already issued commercial paper can behave differently.
Settled by FY2026 finance-cost and borrowings notes, due 2027-02-28. Lead time: one repricing or refinancing quarter.
The headline gold price, in US dollars per troy ounce. It is an OTC/CFD market reference, not an official benchmark. Trading Economics (OTC/CFD market reference; LBMA benchmark averages used as the anchors)
3,432 and 2,386 US$/oz, on a move below — currently between the assumed level and the watch level
How often to look
monthly (the series prints daily)
What it points to. Gold influences pawn ticket size, collateral value, forfeited-stock value and wholesale gold turnover.
Direction only — this pack does not carry a coefficient from this series to reported earnings.
What it cannot tell you. Gold sets the size of the loan advanced against a pledge and the value of metal inventory; it does not set the number of pledges or the footfall through the shops. A rally alongside falling volumes can leave interest income flat. The level here is an OTC/CFD market reference, while the anchors are LBMA benchmark annual averages, so read the gap between them as approximate at the margin, never to the dollar.
Settled by FY2026 results and segment note, due 2027-02-28. Lead time: one pledge or stock cycle, roughly one to six months.
Watchlist reviewed on 2026-09-24; each observation has its own date above. This watchlist date does not change the company research cutoff. A series moving past a level is a reason to re-read the case, not a recommendation. The same series across every company covered: what you can watch.
Download
A print-ready PDF of this page, for reading away from the screen: MoneyMax Financial Services evidence library (PDF). It carries the same content as this page — the three business engines, thirteen years of listed history, the outlet network, where the filings rewrite the history, the profit mix, the balance sheet, cash conversion, funding, the share count, control and governance, the meeting minutes, what would change the reading and cross-company read-throughs — and the same omissions: no rating, no fair value, no forecast.
The retained research archive contains 28 primary PDFs covering the prospectus, every annual report FY2013–FY2025, results through 1H2026, the Mainboard circular, meeting minutes, the Series 001 pricing supplement and the placement-agreement announcement. The two previously unarchived SGX PDFs were downloaded through the official browser viewer, read in full and hash-bound on 29 August 2026.
Information cut-off 27 August 2026. The independent reviews and private provisional decision bridge are complete. Protected conclusions remain excluded from this public evidence page.
Reader questions & corrections
Ask about this company, challenge a source or suggest a factual correction. Only selected questions that SMID Research has reviewed and answered are published.
Submissions are private by default. Your email is encrypted and never published. Please do not send confidential or inside information, allegations about individuals, promotions, or requests for personalised investment advice.
Behind the lockA private working view exists: integrated initiation, workbook, modelled valuation frame, protected credit conclusion, evidence ledgers and audit trail. It is maintained for the author’s own records and is not available for sharing. This public page contains no directional conclusion.
These bounded retrospective corrections clarify specific published facts or calculations. They retain each report's existing research cutoff and do not represent a full refresh or a finding that all possible issues are resolved.
MoneyMax Financial Services Ltd
Verified Fact. The issuer’s 1H2026 results release reports 139 stores following 26 new store openings in 2026. Sources: Source. Limitation: The release gives no precise as-of date for this total; it is not treated as a June-end observation.
Price & events
No dedicated price & events section is published on this company page.
Transcripts
Find available event transcripts in the transcript library.