ValueMax earns pawn interest, trades gold and jewellery, and provides secured lending, all of which consume funding before cash is collected.
Latest figures
At 30 June 2026 borrowings were about S$1.0465bn against S$18.8m of cash, and 92.6% of the FY2025 funding stack was current.
Main risk
The central risk is a maturity and liquidity mismatch if collateral growth, inventory or refinancing costs rise faster than realised cash returns.
Next proof
The next test is the FY2026 maturity table, unrestricted cash, collateral performance and operating-cash conversion.
Share price
S$0.98 (21 Aug 2026 close)
Market cap
S$928.1m · 947.1m shares
Free float
18.2% (Rule 723 basis)
Listed
Oct 2013 at S$0.51 · SGX Mainboard
Credit
Fitch BB / Stable (Jun 2026)
Reporting
Half-yearly · FY ends 31 Dec
This page carries no proprietary rating, no fair value and no recommendation. It describes the business, its economics, its funding and its risks from primary filings. Information cut-off: 20 August 2026; an issuer-filing sweep on 26 August found no later filing that changed this page. Evidence tags: R = primary source · D = derived from primary inputs · E = external/unverified · O = opinion. See methodology.
Evidence balance
The live questionWhat funds the receivable growth that absorbs cash before collection, when almost all of the borrowings behind it are current?In 1H2026 revenue rose 38.2% to S$370.7m while operating cash flow was an outflow of S$33.8m, so how the growing book is funded is now the live question.
What improved
1H2026 PATMI rose 30.4% to S$62.6m, and cumulating operating cash before working capital since listing gives +S$496.8m against cumulative PATMI of +S$466.4m — 107% conversion, so the profits are matched by pre-growth operating cash even while the book absorbs it.
What became more demanding
In the same half receivables rose S$192.7m and gross margin fell 3.2 points to 27.0%; at 30 June 2026, 92.1% of S$1.046bn borrowings were current and cash covered only 1.95% of current debt.
Strongest alternative explanation
The absorption could be deployment rather than distress: the S$192.7m rise in receivables would be the loan book expanding, and operating cash before working capital rose in each of the five years without exception, which does not by itself establish that collections are deteriorating.
The decisive missing fact
The decisive disclosure is a month-by-month maturity ladder with committed undrawn facilities, lender concentration and collateral allocation, none of which the filings provide; without them the roll cannot be tested against collections.
Drawn from the evidence on this page: the improvement, the constraint, the benign reading and the fact that would settle it. It states no view on the shares.
About the private research record
Also on file for this company, behind the private research view 🔒 (author-only): the current integrated note and understanding sheet, with the private credit conclusion and supporting review records, and the forward view withdrawn from this page — the projected financials and the two forecast exhibits. The superseded model, PDF and deck remain archived for audit continuity and are not represented as current. Kept private; not for distribution.
On this page
Business anatomy · where revenue and profit come from
Pawn loans, property-backed credit and gold trading share one capital loop
ValueMax advances against collateral, runs a separate floating-rate lending book, and sells gold and jewellery recovered or purchased for stock.
Compare the business lines: cards map 100.0% of revenue and 96.4% of segment profit; Others (3.6%) is not a card.
What happensPurchased stock and eligible forfeited pledges become wholesale gold or pre-owned jewellery inventory.
How it earnsGold traders and retail buyers pay for the merchandise.
Capital loopReinvestment cycle
Return cash to the books
What happensRedemptions, loan repayments and merchandise sales replenish cash for the next secured advance or stock purchase.
Return driverFunding cost, collateral recovery and inventory turns shape the combined economics.
Original SMID Research comic. AI-assisted, analyst-directed monochrome artwork depicts the evidenced operating steps of ValueMax Group; deterministic captions and dated mix figures state the economics using issuer disclosures available to 2026-08-20. The drawings are representative—not issuer artwork, an exact product or site design, a statement of scale, or a company forecast.
Investor translation
What matters after the operating picture
Four questions connect the business model to cash and balance-sheet risk. This is a factual reading aid, not a valuation or recommendation.
Value lever
Sustainable return on equity after funding and credit costs.
Cash bottleneck
Collateral, loan receivables and inventory grow before collection or sale.
Balance-sheet pressure
Realizable short-term assets and committed funding no longer cover short-term maturities.
Next proof
Maturity ladder, committed liquidity and loan-cohort collections.
Text version of this comic
Business line · Advance against valuables A pawn borrower pledges gold or another valuable; ValueMax appraises, stores and lends against it. Reported mix: FY2025 revenue 11.0%; pre-tax segment profit 23.2% (D).How it earns: The borrower pays interest when the pledge is redeemed or renewed.
Business line · Underwrite secured credit Business and personal borrowers pledge property or other security into a separate floating-rate loan book. Reported mix: FY2025 revenue 12.2%; pre-tax segment profit 32.2% (D).How it earns: Principal, interest and fees are collected over the loan term.
Business line · Sort, refurbish and sell Purchased stock and eligible forfeited pledges become wholesale gold or pre-owned jewellery inventory. Reported mix: FY2025 revenue 76.8%; pre-tax segment profit 41.0% (D).How it earns: Gold traders and retail buyers pay for the merchandise.
Capital loop · Return cash to the books Redemptions, loan repayments and merchandise sales replenish cash for the next secured advance or stock purchase. Return driver: Funding cost, collateral recovery and inventory turns shape the combined economics.
1 · What the company actually is
ValueMax runs 50 pawnshop-and-retail outlets in Singapore, a property-backed moneylending book, and a gold wholesale operation — plus 32 Malaysian outlets through a 37%-owned Bursa-listed associate (Well Chip) and, since April 2026, 11 Jakarta outlets through a 40% associate. Founded as a single pawnshop in 1988 by Yeah Hiang Nam; listed October 2013; still 81.53% family-held. (R)
Three revenue lines, and they are genuinely different businesses:
Pawnbroking (S$60.8m of FY2025 revenue). Collateralised consumer credit against gold. Interest runs 1.0–1.5% in month one and 1.5%/month for the following seven; unredeemed pledges may be repossessed after eight months. The statutory maximum under the Pawnbrokers Act 2015 is a flat 1.5% per month — verified against the Ministry of Law's Registry of Pawnbrokers. (The widely-repeated "1.5% first month, then 1.0%" describes the pre-2015 regime and is wrong for the current Act.) The book is therefore priced at its regulatory ceiling from month two onward: pricing is not a lever. Growth must come from ticket size or unit count. (R)
Moneylending (S$67.3m). Secured loans at 6.4–36.0% p.a. and unsecured at 7.9–47.0%, mostly property-backed, to borrowers outside bank appetite. Nineteen per cent of group trade receivables sit with ten debtors in this segment. (R)
Retail and trading (S$425.0m). Jewellery through the outlets plus a wholesale arm that buys scrap gold — including forfeited pledges from its own and third-party pawnshops — and sells fine bars to factories and traders. (R)
The most under-discussed fact in the accounts
Ten customers accounted for S$327.3m of FY2025 revenue — 59.2% of the group and 77.0% of the retail & trading segment (AR-FY2025 note 31). These are gold-trading counterparties on non-interest-bearing terms. The "three diversified engines" framing understates how much of the top line is one wholesale book with a handful of buyers. (R)
The industry is licence-capped, and the licence list is countable. The Registry of Pawnbrokers shows 244 licensed pawnshops as at 1 August 2026 (242 in Aug 2024, 241 in Sep 2025 — counted from the primary lists). ValueMax's 50 outlets are 20.5% of all licences — and it has added none in Singapore for two full years. In a capped market, unit growth means buying somebody else's licence, which is what the company does (five-plus acquisitions since 2022). (R)
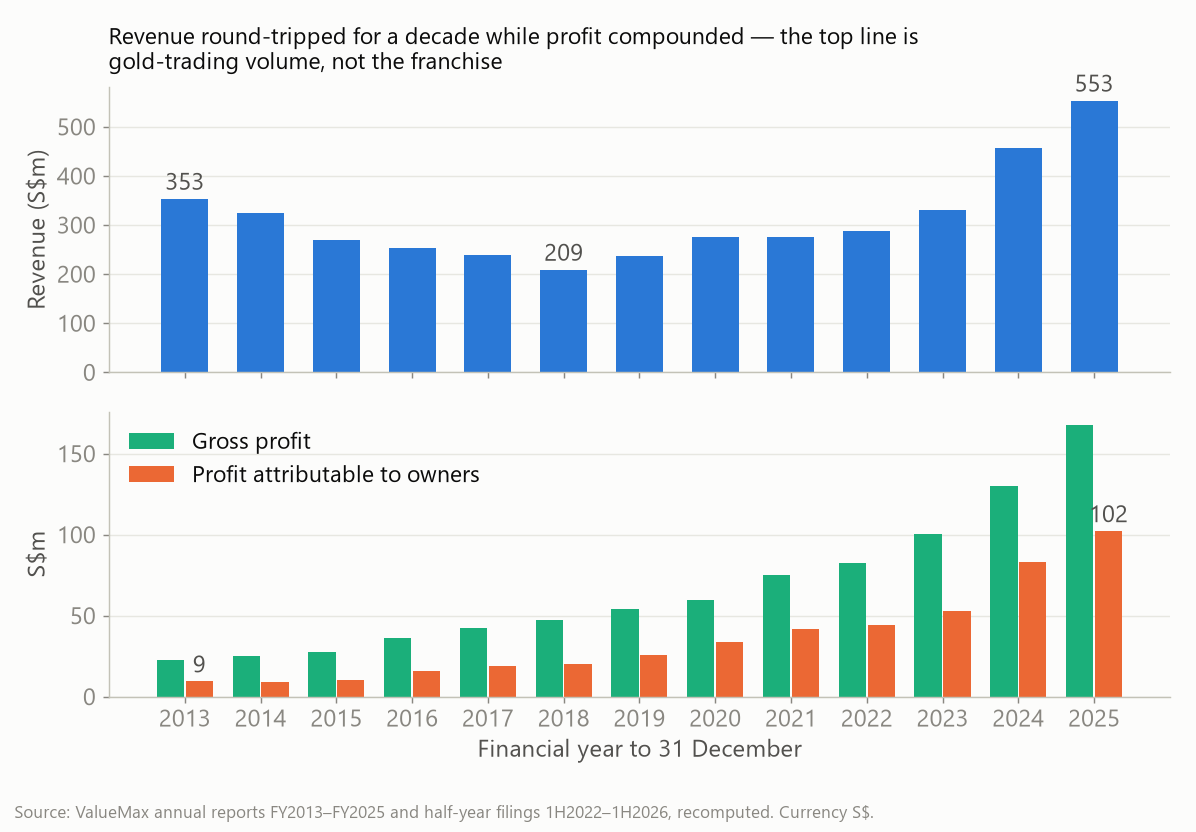
The strategy showed up in the segment note years before any chairman's statement. Moneylending was first split out in FY2015 with S$40.9m of assets; by FY2025 it was S$824.2m — roughly half the group. Revenue round-tripped S$353m → S$209m → S$553m over thirteen years while gross profit rose every single year: the top line is gold-wholesale volume and is the least informative line in the accounts. (R)
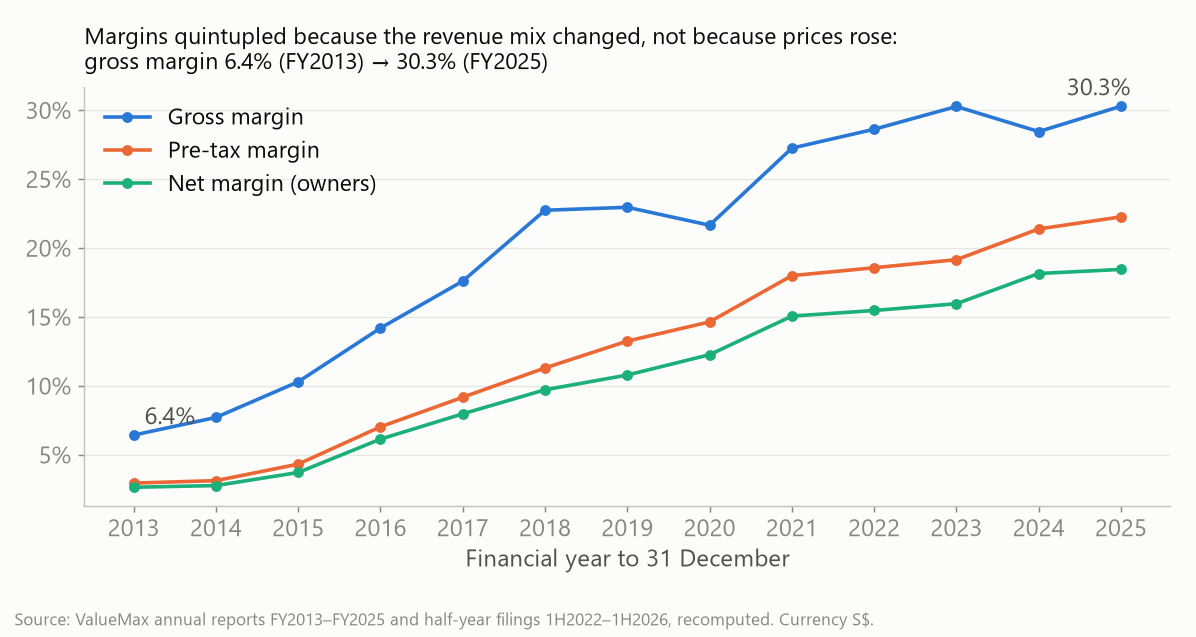
Revenue round-tripped; gross profit rose every year. The top line is volume, not economics.Gross margin 6.4% → 30.3% since IPO — entirely mix, as wholesale gave way to lending.
2 · Segment economics — the capital picture inverts the margin picture
FY2025
Pawnbroking
Retail & trading
Moneylending
Others
External revenue (S$'000)
60,815
425,030
67,285
–
Segment profit, pre-tax (S$'000)
25,851
45,751
35,966
4,000
Segment margin
42.5%
10.8%
53.5%
n.m.
Segment assets (S$'000)
464,498
156,259
824,245
206,253
Profit share
23.2%
41.0%
32.2%
3.6%
Asset share
28.1%
9.5%
49.9%
12.5%
Return on segment assets
5.6%
29.3%
4.4%
1.9%
Return on net capital employed
11.0%
52.3%
9.4%
10.2%
Source: AR-FY2025 note 31, recomputed (D). Segment profit is pre-tax after allocated finance costs. Net capital employed is pre-elimination and does not aggregate to group equity — a structure observation, not a share of equity.
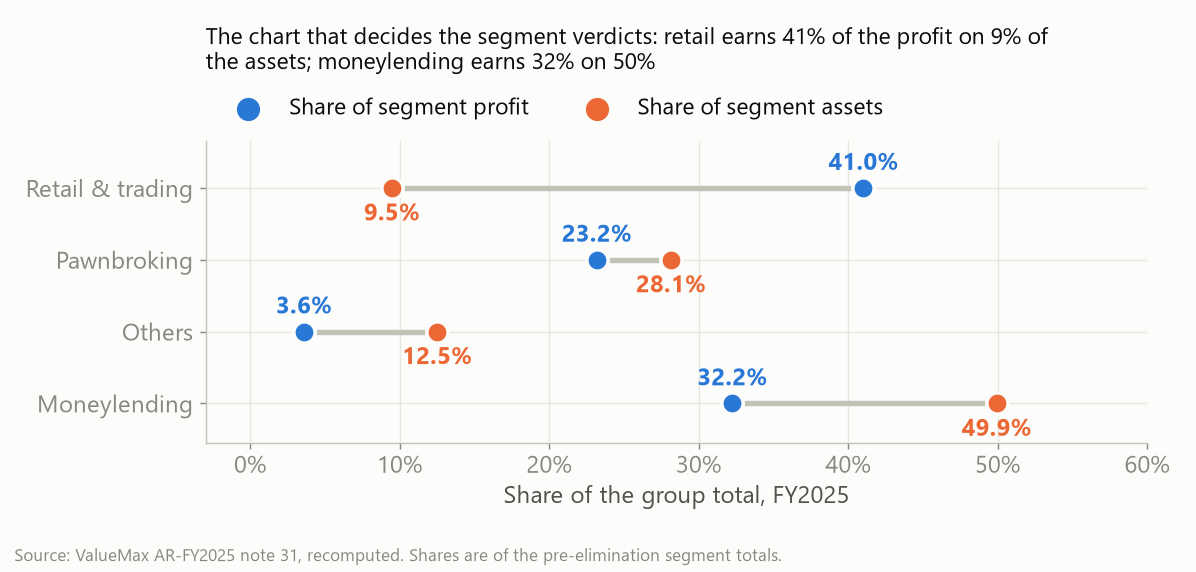
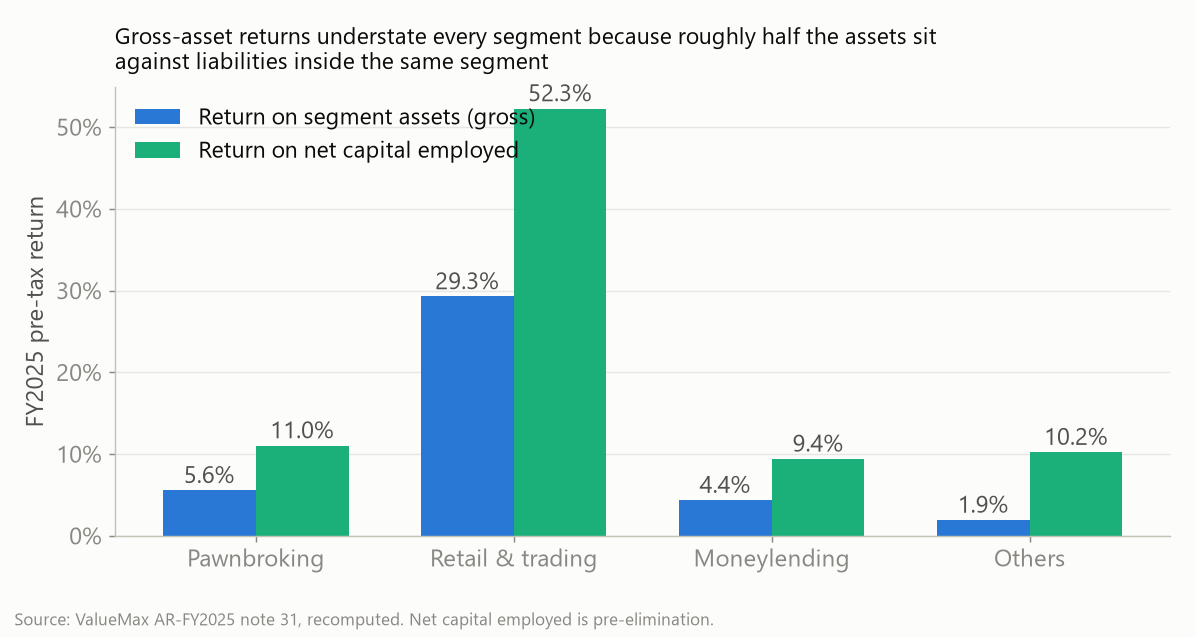
The name on the door produces the smallest profit share. The pawnshop chain earns 23% of segment profit; retail & trading — the segment a margin-only reader dismisses at 10.8% — earns 41% of the profit on 9.5% of the assets and a 52% return on net capital employed. Moneylending is the mirror image: half the balance sheet for a third of the profit. The low-margin business is the capital-efficient one; the high-margin business is the balance-sheet hog.
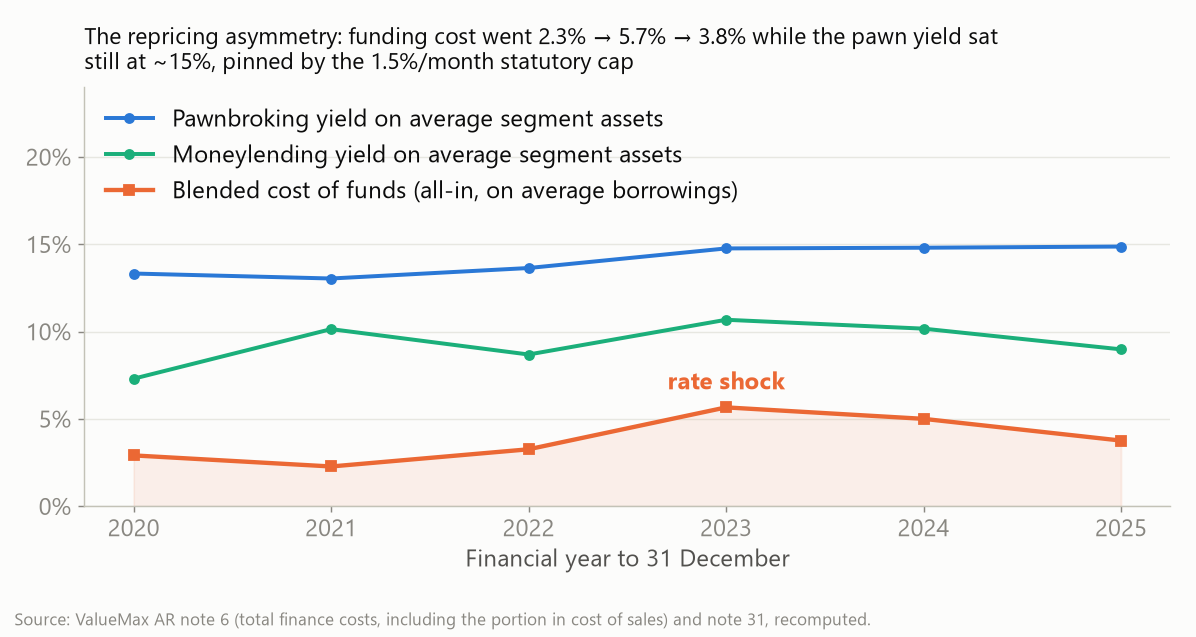
Pawn yield stability is statute, not skill. Yield on average pawn segment assets ran 13.0–14.9% across FY2021–25 because the book is written at the 1.5%/month cap from month two. The segment's net interest margin swung 11.9% → 10.4% → 12.0% across the same years — the whole swing is the funding side.
Retail's FY2025 profit contains a mark. S$10.0m of FY2025 pre-tax profit — 8.1% of group PBT — is the fair-value uplift on commodity inventories credited to cost of sales under the broker-trader exemption: a rising gold price flows straight into profit whether or not anything was sold. In 1H2026 that line reversed to a S$1.5m charge. Comparisons of FY2025's 10.8% retail margin to any forward period must strip it. (R)
Profit share vs asset share: the inversion in one picture.Return on net capital employed by segment.
The complementarity is measurably weakening — visible in one line nobody reads
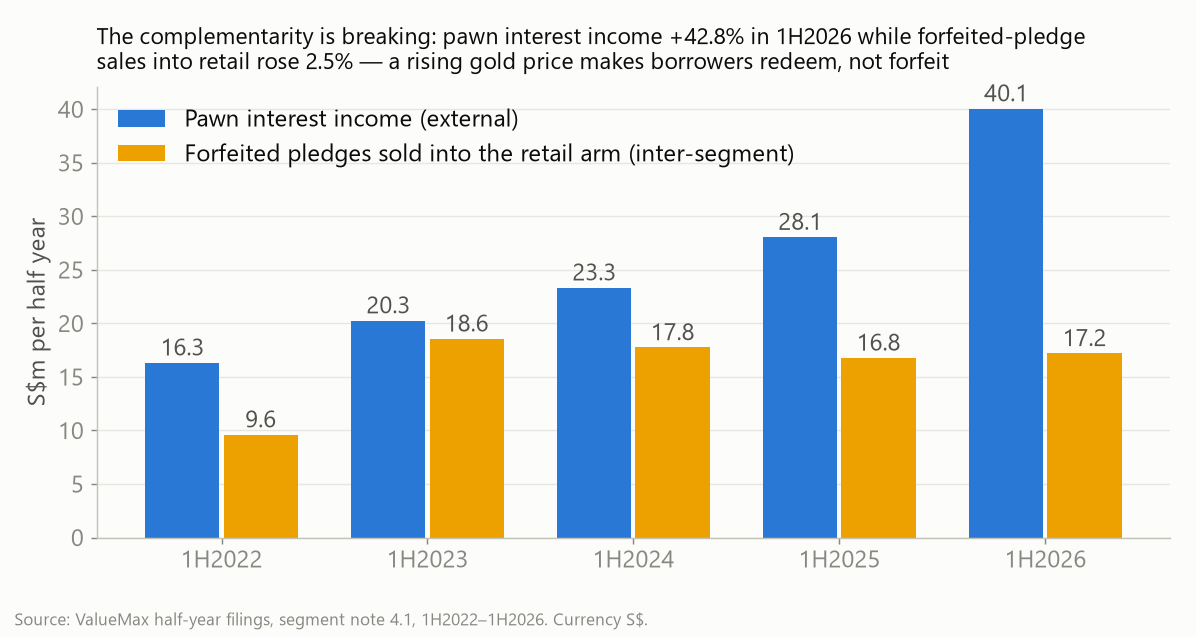
Forfeited pledges flowing from the pawnshops into the retail arm are the internal inventory pipeline, quantified in segment note 4.1. In 1H2026, pawn interest income rose 42.8% while inter-segment pledge sales rose 2.5% — a rising gold price makes borrowers redeem rather than forfeit, starving the retail arm of cheap stock precisely when retail carries the growth. Retail's margin fell 10.4% → 7.9% in the half. The FY2025 series shows the same divergence, milder (17.4% vs 24.3%) — a sharpening trend, not a one-period artefact. Alternative explanation, stated: an eight-month ticket means forfeitures lag a fast-growing book mechanically; the FY-level series partly but not wholly answers this. Falsifier: the FY2026 segment note, ~24 Feb 2027 — inter-segment revenue growing in line with pawn interest would refute it. (D)
Pawn interest income vs inter-segment pledge sales — the divergence, charted.
3 · Track record and the quality of the earnings
S$m unless stated
FY2021
FY2022
FY2023
FY2024
FY2025
1H2026
Revenue
275.5
287.1
331.0
456.2
553.1
370.7
Gross margin
27.3%
28.6%
30.3%
28.5%
30.3%
27.0%
Profit before tax
49.6
53.3
63.4
97.6
123.2
74.9
PATMI
41.5
44.4
52.9
82.8
102.1
62.6
Operating cash flow
(154.8)
(164.1)
3.5
(56.3)
(166.7)
(33.8)
Net debt
428.0
599.5
598.5
670.5
863.9
1,027.7
Audited annual filings and the 1H2026 interim, re-keyed (R). PATMI has risen in 12 of 13 listed years. 1H2026: revenue +38.2%, gross margin down 320bp — the first period where volume grew and margin fell.
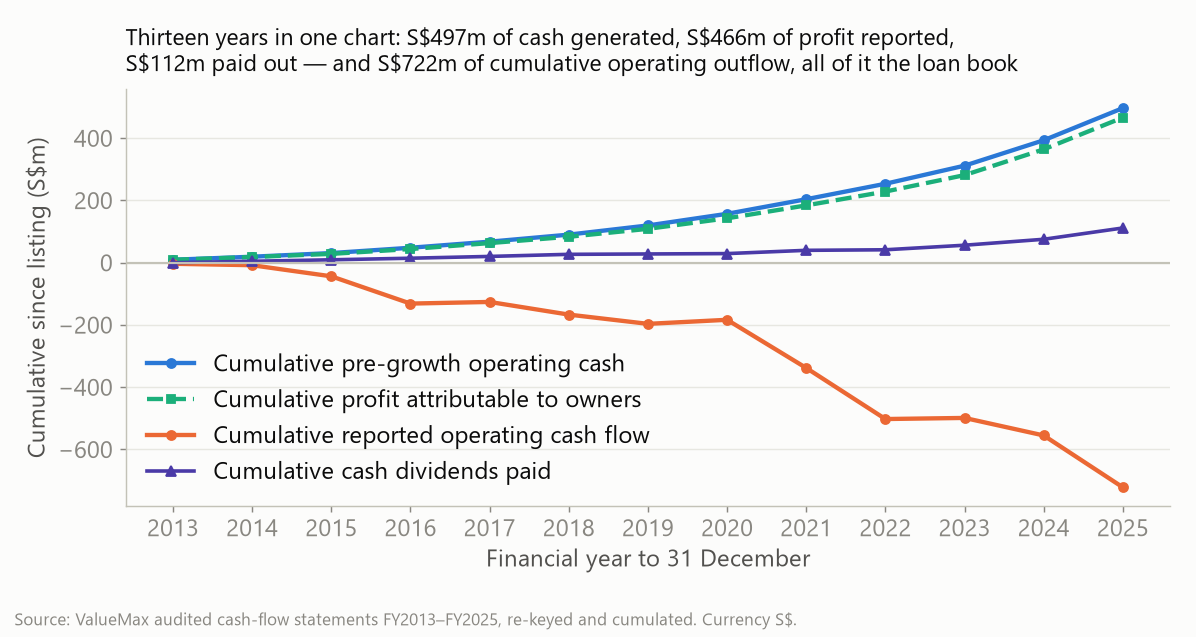
The cash-flow question, answered with thirteen years of arithmetic. Reported operating cash flow has been negative in ten of thirteen listed years — cumulatively −S$722m — which is regularly read as a red flag. Cumulate the pre-growth figure instead (operating cash before working capital, after interest and tax paid): +S$496.8m against cumulative PATMI of +S$466.4m — 107% conversion, re-keyed from every audited cash-flow statement since listing. The earnings are cash; the cash is re-lent. (D)
Two circulating claims, tested against that arithmetic:
"The dividend is financed by creditors." Cumulative cash dividends of S$111.6m are 22.5% of cumulative pre-growth operating cash — covered several times over. The defensible statement is narrower: because the book absorbs everything, each dollar paid out raises the external funding requirement by a dollar. (D)
"Negative operating cash flow proves the earnings aren't real." No — but the reverse claim needs care too: pre-growth operating cash starts from accrual profit, and the principal roll-forward that would prove cash collection cannot be built, because originations and collections are not disclosed. That absence is itself a finding. (D/O)
Thirteen years cumulated: pre-growth operating cash S$497m vs PATMI S$466m.
Unresolved: a S$101m classification gap in the 1H2026 interim
The half-year cash-flow statement shows a S$101.124m operating inflow labelled "increase in trade and other payables". The same filing's balance sheet shows payables rising only S$0.312m. The corresponding borrowings roll-forward is also inconsistent with the reported financing cash-flow line. This is an unreconciled classification conflict, not proof of a reclassification. Removing the S$101.124m inflow from reported CFO of −S$33.844m gives −S$134.968m. Replacing that inflow with the S$0.312m balance-sheet increase instead gives −S$134.656m (−33.844 − 101.124 + 0.312). These are hypothetical classification sensitivities, not alternative issuer-reported CFO: a balance-sheet change need not equal a cash-flow movement, and neither calculation establishes the correct accounting classification. Falsifier: the FY2026 audited reconciliation of liabilities arising from financing activities, ~March 2027 — or an IR answer sooner. (D on R inputs)
Other one-off and cash-perimeter content, stated plainly. FY2024 PBT included a S$10.1m non-cash gain on Well Chip's listing dilution (10.4% of that year's PBT); FY2025 included the S$10.0m inventory mark. In 1H2026 the group recognised S$6.268m of equity-accounted associate profit but received only S$0.150m of associate dividends. The model therefore separates associate accrual profit from upstream cash. Well Chip's 2026 rights undertaking was given by VYN, not disclosed as an automatic ValueMax cash call. (R/D)
4 · Funding — the balance sheet that has to be rolled
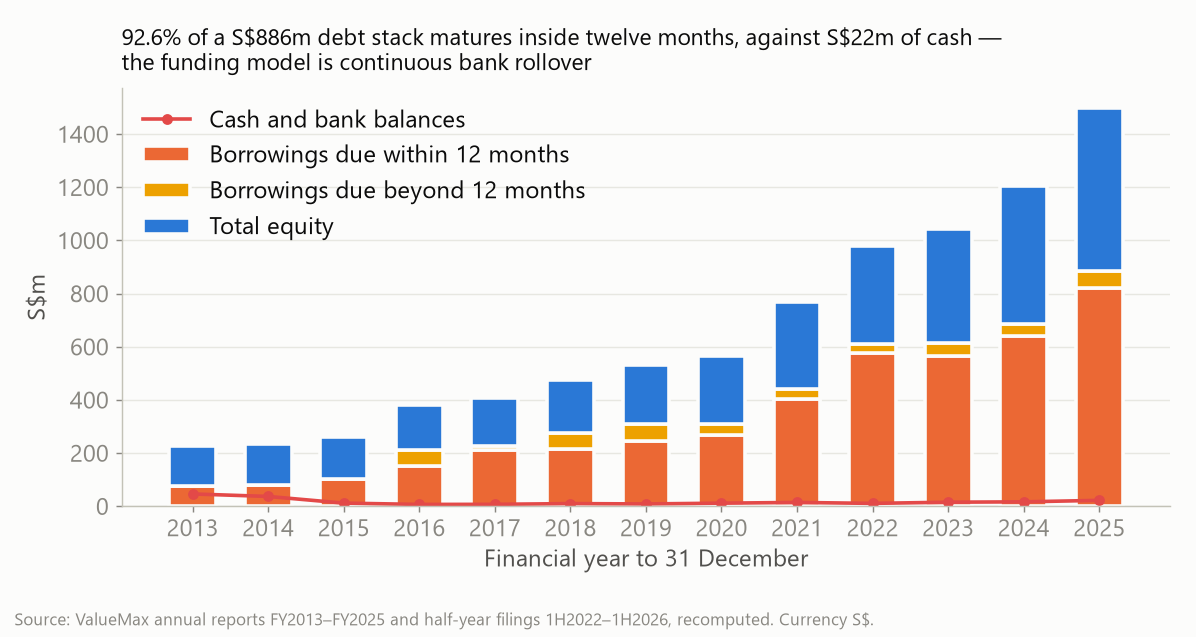
Total borrowings were S$886.3m at FY2025 and S$1,046.5m at 30 June 2026, against S$18.8m of cash. 92.6% of the FY2025 stack matured inside twelve months: S$685.9m of current bank loans, S$124.7m of three-to-six-month commercial paper across five series, overdrafts and gold borrowings. Every floating borrowing reprices within six months. (R)
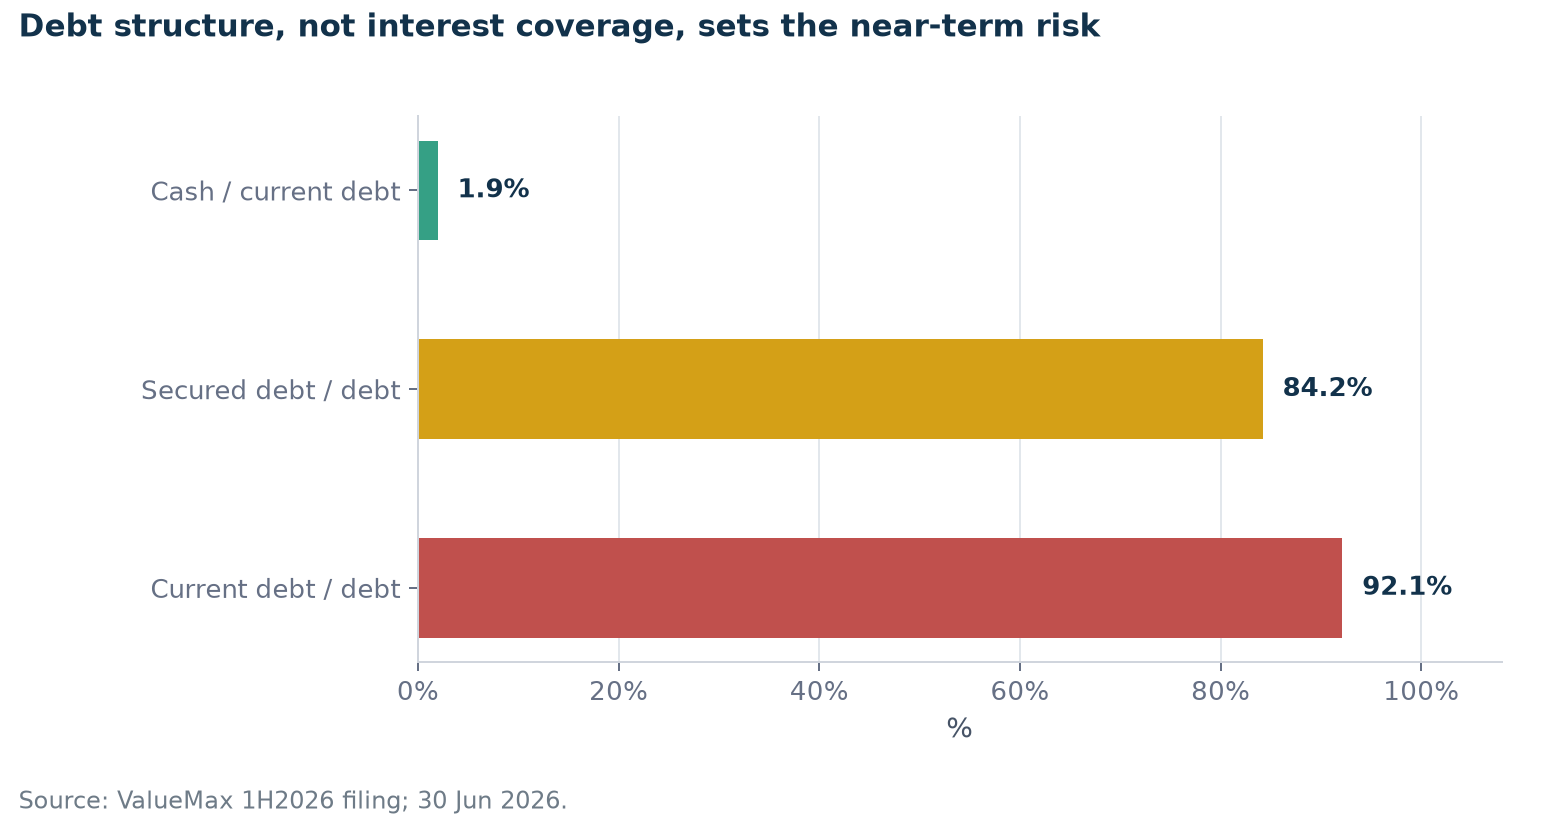
The static asset-liability buffer is positive but thin. On FY2025 contractual maturity, one-year financial assets of S$924.4m stood against one-year liabilities of S$857.7m — 1.08x coverage, down from 1.18x. That is more informative than cash alone for a lender, but it is unstressed and does not show whether property-loan collections arrive before monthly debt maturities. At 30 June 2026, 92.1% of S$1.046bn borrowings were current and cash covered only 1.95% of current debt. (R/D)
What is not disclosed matters as much as what is. The public 5 June 2026 Information Memorandum and final Series 003 terms establish the legal covenant framework, but undrawn committed facilities, lender concentration, collateral allocation and a month-by-month maturity ladder remain undisclosed. At 30 June, 92.1% of borrowings were current, 84.2% were secured and cash covered only 1.95% of current debt. Corporate guarantees rose 25.5% to S$748.5m at FY2025. (R/D)
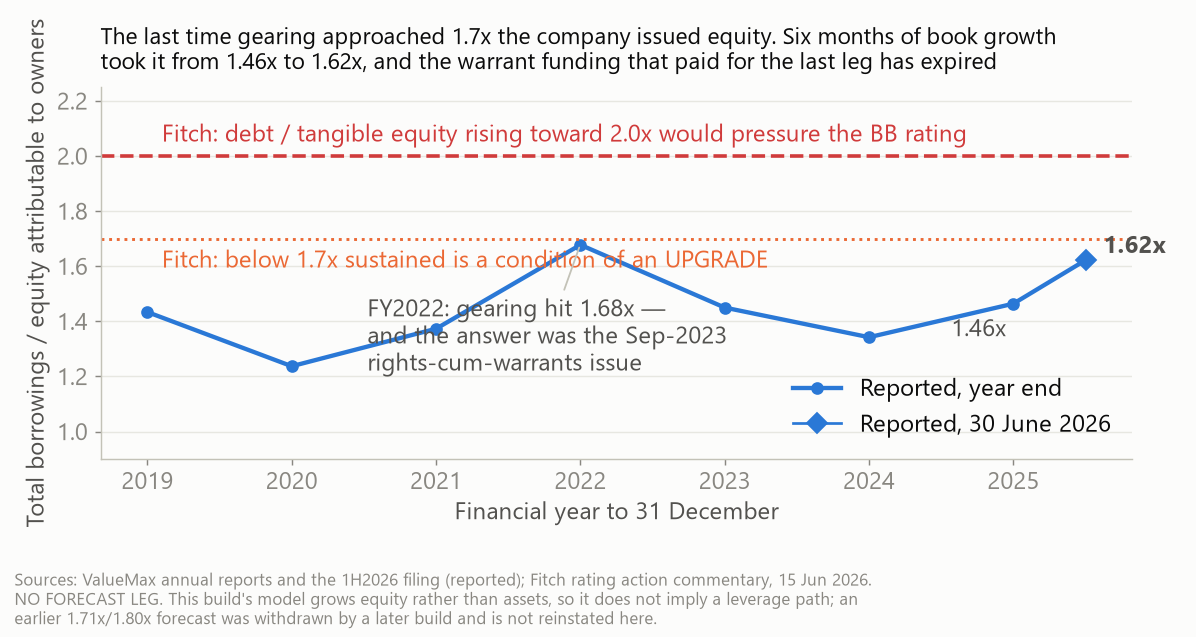
A stable ratio and a growing roll are different things. Gearing at 30 June 2026 was 1.62x, inside the 1.24x–1.68x range the company has run since FY2019, while total borrowings rose from S$886.3m at FY2025 to S$1,046.5m. The ratio holds because equity grows alongside the book, so it says nothing about the absolute sum that has to be refinanced each year — and that sum is the larger number. A capital ratio is not a cash calendar, and the second cannot be built from public filings while committed facilities and instrument-level maturities stay undisclosed. Whether book growth can be funded without new capital is a forward question: this page deliberately excludes forecasts, scenarios and projected funding needs, and the forward view sits behind the rated view 🔒 (author-only). (R/D)
Dilution has been the quiet tax. Shares outstanding have gone 533.5m → 947.1m since listing (+78%) while PATMI rose 10.9x. Holders have done very well; they have also been asked for money three times. (R)
The listed note adds a market indicator, with quotation limits. The S$80m 4.00% notes were issued on 10 July 2026, after the 30 June balance-sheet date, and improve tenor only at the margin. They are direct, unconditional, unsubordinated and unsecured obligations of the listed parent; approximately 21.56% was allocated to interested persons. Bondsupermart displayed a 100.50 ask and 3.814% ask yield-to-worst at 15:59 Singapore time on 18 August 2026. This is a dated indicative platform observation, not a current executable quote or a fair-value conclusion; price side, timestamp, accrued interest and yield convention matter. (R/E)
The funding stack: short-dated, secured, bank-heavy.Reported gearing at each year end from FY2019 and at 30 June 2026, against Fitch’s published rating-sensitivity levels. Reported data only — the chart carries no forecast leg.The FY2022–23 margin squeeze was the funding side: cost of funds 2.28% → 5.66% → 3.76% while the asset yield sat at its statutory cap.
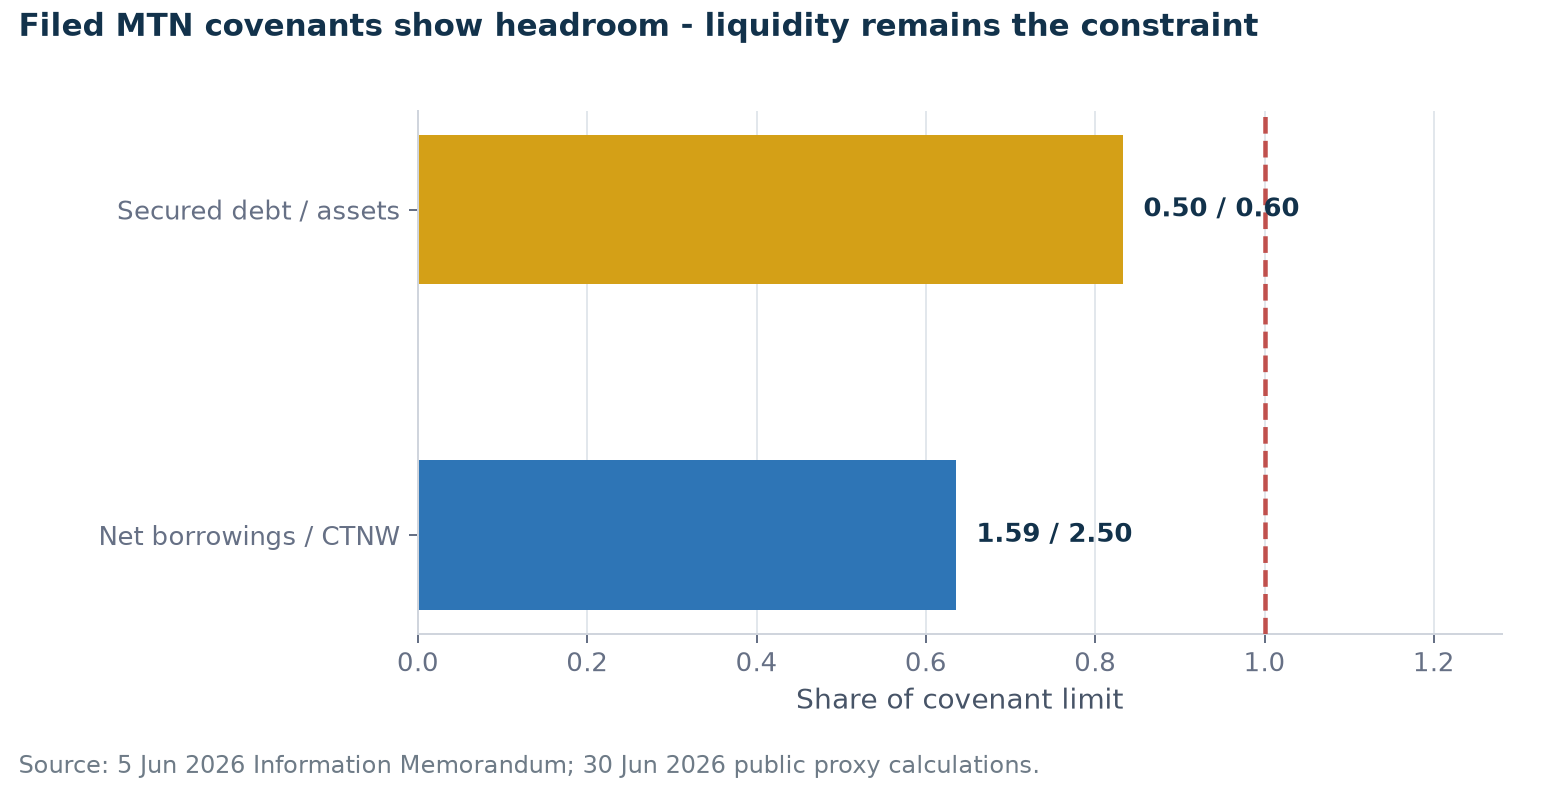
Filed MTN covenants and legal triggers
Covenant
Filed threshold
30 Jun public proxy
Proxy headroom
Consolidated tangible net worth
≥ S$350m
S$644.9m
S$294.9m
Net borrowings / CTNW
≤ 2.50x
1.59x
0.91x
Secured debt / total assets
≤ 60%
50.0%
10.0ppt; ~S$175.8m static capacity
Source: filed MTN Information Memorandum and corrected 1H2026 results (R/D). These are analytical proxies, not legal compliance certificates. Static covenant capacity is not committed liquidity.
The terms also contain a S$5m aggregate cross-default threshold and a noteholder put if the named family ownership falls below 51%. The negative pledge has ordinary-course working-capital and refinancing exceptions; it is not a blanket ban on further security. (R)
Filed covenant utilisation at 30 June 2026. Headroom does not replace a committed liquidity schedule.Current debt, secured debt and cash coverage at 30 June 2026.
Two exhibits that stood here — a chart of projected revenue and PATMI, and a chart of forward residual funding needs — have been withdrawn. This page deliberately excludes forecasts and scenarios; both sit behind the rated view 🔒 (author-only).
5 · Five years of cash — what feeds the book
S$’000, from the consolidated statements of cash flows in the FY2021, FY2022, FY2023 and FY2025 annual reports. Gross borrowing traffic is the drawings and repayments added together, not netted, because the size of the roll is the point.
S$’000
FY2021
FY2022
FY2023
FY2024
FY2025
Operating cash flow before working capital
62,389
73,583
100,523
121,713
145,097
Increase in trade and other receivables
(198,134)
(192,943)
(31,788)
(140,869)
(252,083)
Increase in inventories
(4,342)
(20,472)
(15,906)
+4,367
(24,836)
Interest paid
8,533
16,552
34,070
30,701
29,120
Income taxes paid
6,959
7,419
8,308
9,368
12,659
Net operating cash flow
(154,767)
(164,079)
3,533
(56,305)
(166,713)
Purchase of property, plant and equipment
2,364
471
5,227
11,407
3,821
Proceeds from loans and borrowings
195,674
347,199
402,244
525,410
732,143
Repayment of loans and borrowings
61,407
183,875
398,831
458,142
530,835
… gross borrowing traffic, the two added
257,081
531,074
801,075
983,552
1,262,978
Lease principal paid
5,056
5,342
5,715
5,854
6,116
Equity issued — rights, then warrants (gross)
41,904
–
23,423
23,239
25,880
Dividends paid on ordinary shares
10,474
1,782
14,632
19,098
36,297
Dividends paid to non-controlling interests
745
594
610
688
749
Cash and cash equivalents at year end
14,481
6,279
10,736
8,014
18,036
The negative operating line is the loan book, not the business. Operating cash flow before working capital rose in every one of the five years without exception — S$62.4m, S$73.6m, S$100.5m, S$121.7m, S$145.1m, cumulatively S$503.3m. Over the same five years trade and other receivables absorbed S$815.8m. That single line is 1.6 times everything the operations generated before it, and it is the whole of the difference between a business that produces cash and a statement that reports it consuming cash. FY2023 is the one positive year and it is the year the receivable barely grew: S$31.8m against S$140.9m and S$252.1m either side of it.
A billion-dollar book is run on a cash balance that has never exceeded S$18.0m. Year-end cash was S$14.5m, S$6.3m, S$10.7m, S$8.0m and S$18.0m. Against that, FY2025 alone drew S$732.1m of borrowings and repaid S$530.8m — S$1.263bn of gross traffic through the financing section, roughly seventy times the cash balance it ends with, and 2.3 times the year’s S$553.1m of revenue. The roll has grown in every year, from S$257.1m in FY2021. This is what section 4 means by a balance sheet that has to be rolled, expressed as the volume actually rolled rather than as a maturity profile.
Interest paid peaked in FY2023 and has fallen every year since, while the book kept growing. S$8.5m, S$16.6m, S$34.1m, S$30.7m, S$29.1m. The peak is FY2023, the year the receivable stopped growing; the two years of fastest book growth since have carried a falling interest bill. That is a rate story rather than a leverage story, and it is worth reading beside the FY2025 finance cost of S$29.6m and the blended funding cost the funding section reports.
Shareholders have funded this book alongside lenders, and that channel has just closed. Equity raised runs S$41.9m in FY2021, nil, S$23.4m, S$23.2m and S$25.9m — S$114.4m over five years, against S$82.3m of ordinary dividends paid out across the same period. The company told SGX that the FY2025 warrant proceeds fund loan-book growth specifically, and warrant conversion supplied 27.7% of the growth in equity attributable to owners that year. But the programme is essentially exhausted: 856,448 warrants were outstanding at 30 June 2026 against 947.0m shares in issue — under a tenth of one per cent — at an exercise price of S$0.36 and expiring 14 September 2026. What was a recurring funding channel through FY2025 stops being one from FY2026, and the research pack also records that public shareholders did not take up their rights entitlements, so each raise concentrated the register. (Warrant figures from the research pack, claims CL-237, CL-279 and CL-299, not from the cash flow statements above.)
6 · Management and governance — both readings, dated
Succession is executed, and the delivery ledger reads well. Yeah Chia Kai became CEO in January 2022; the founder remains Executive Chairman; a daughter runs retail. Outlet targets have been met almost every year since listing; the Malaysian strategy delivered a Bursa listing; every prior MTN series matured on schedule. The quiet drift: the prospectus committed to a 50% payout for FY2013–15, and the payout has run 25–35% since — time-limited commitment, unannounced drift. (R)
The February 2026 block trade is the most important governance datum, and it reads both ways. On 26 February 2026 — three days after the FY2025 results print and the all-time high of S$1.34 — the chairman and his wife sold 34.8m shares at S$1.16 (S$40.4m) to four institutions, cutting family interest to 81.53% with a 90-day moratorium. Bull reading: it institutionalised the register and directly enabled iEdge NEXT 50 inclusion a month later — value-accretive, non-dilutive. Bear reading: the best-informed holders monetised S$40m at 1.8x book near the top of a gold cycle, and the shares now trade 16% below the placement price. Both are true; no motive is attributed. The discriminating future observation: whether the family buys below S$1.00 — the chairman added ~S$0.55m in the April 2025 dip, so the family demonstrably trades its own stock with a view. (R/D/O)
Related parties are small but moving fast. Purchases from director-related companies +126% to S$5.74m in FY2025; family members hold the company's commercial paper; key management remuneration +40.3% against PBT +26.2%. Every RPT line sits below the S$17.8m threshold that would trigger Audit Committee pre-approval — which is why the trend, not the level, is the watch item. (R)
The language delta worth taking literally. After four years of boilerplate, the 1H2026 outlook added a phrase never used before: "increased competition" — in the same half that MoneyMax's pawn book out-grew ValueMax's. (R)
7 · What five years of AGM minutes add
ValueMax holds no earnings calls, so the AGM minutes are the only forum where management answers unscripted questions. Minutes for 2021–2026 were retrieved and read; every item below is the company's own recorded answer. (R)
The register has voted on dilution — and the timing is exact
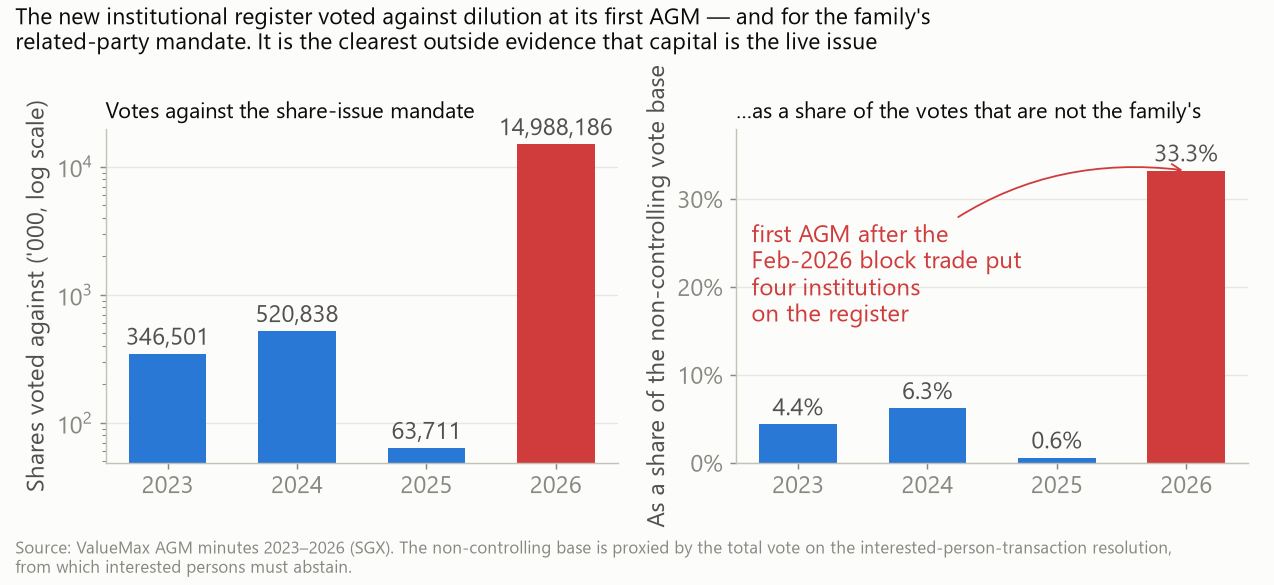
Votes against the standing share-issue mandate ran at 0.6–6.3% of the non-interested base from 2023–25. At the April 2026 AGM — the first after the block trade put four institutions on the register — votes against jumped to 14,988,186 shares, roughly a third of the non-interested base, while dissent on the family's related-party mandate collapsed from 19.7% to 0.7%. The new holders are relaxed about the RPTs and hostile to being diluted. Alternative explanation, stated: a blanket-policy voter cannot be excluded from the poll data — but it would typically oppose both mandates, and it didn't.Falsifier: the April 2027 AGM.
The rights-issue question was asked directly (2025) and not ruled out. The CFO's answer — a rights issue was done in 2023, and any future fundraising would consider the optimal capital structure at the time — is a non-denial on the exact question the funding arithmetic raises.
The clean credit record does not resolve the larger lending book. Asked what caused the credit-loss provision, the CFO located it "mainly [in] the auto financing segment, which constitutes a very small percentage of the group's business." The decade of sub-0.5% aggregate credit costs is therefore not enough to establish the current condition of the much larger moneylending portfolio, which includes property-backed and other loans. No ageing, stage or NPL disclosure exists; Fitch's upgrade condition naming an 8.0% impaired-loan threshold is the only public reference point.
Management's gold-decline defence checks out — for the part of the business that is no longer the main part. Loans are granted at a discount to collateral; the book has no vintage concentration; and the group stayed profitable through 2013's >30% gold fall. All three verified. But pawnbroking was 77% of segment profit in FY2013; retail & trading — the gold-linked segment — is 41% today. The precedent protects yesterday's mix.
Only the pawn book is rate-fixed. Moneylending agreements normally reprice with bank rates (2024 AGM) — so the cap-vs-floating-cost squeeze applies to roughly a quarter of assets, not half. (Recorded as a correction to this research's own earlier framing.)
A volume KPI hiding in a S$2 fee. The MinLaw-permitted S$2/transaction admin fee implies ~787k and ~838k fee-bearing transactions in FY2024–25 — +6.5%, against pawn interest income +24.3%. Growth came from ticket size, not customers — and ticket size is the gold price wearing a different label. Independently, industry data shows pledges +8% with average loan per pledge +19.6% — two unrelated origins, same split. (D)
The Louis Vuitton settlement carried an undisclosed condition. The SGX announcement said the matter settled without admission of liability, immaterial. The 2026 AGM minutes add an undertaking not to sell LV items going forward — financially trivial, structurally a permanent product restriction on a resale business, and a precedent now available to any other brand.
Votes against the share-issue mandate, 2023–2026: the register's revealed preference.
8 · The peer decomposition — same assets, different balance sheets
All three listed Singapore pawnbroking groups filed 1H2026 results for the same six months. On primary filings, recomputed:
1H2026, six months to 30 Jun
ValueMax
MoneyMax
Aspial Lifestyle
Revenue (S$m)
370.7
325.7
464.2
Profit after tax, total (S$m)
63.6
55.4
55.0
… attributable to owners (S$m)
62.6
52.5
52.4
Average total assets (S$m)
1,660.6
1,358.5
1,731.8
Average equity attributable to owners (S$m)
625.3
299.7
363.6
Return on assets, annualised
7.54%
7.74%
6.05%
× average assets / average equity
2.66x
4.53x
4.76x
= return on equity, annualised
20.03%
35.06%
28.83%
P/B (R/D, 17 Aug 2026 close ÷ 30 Jun 2026 book)
1.40x
2.27x
1.79x
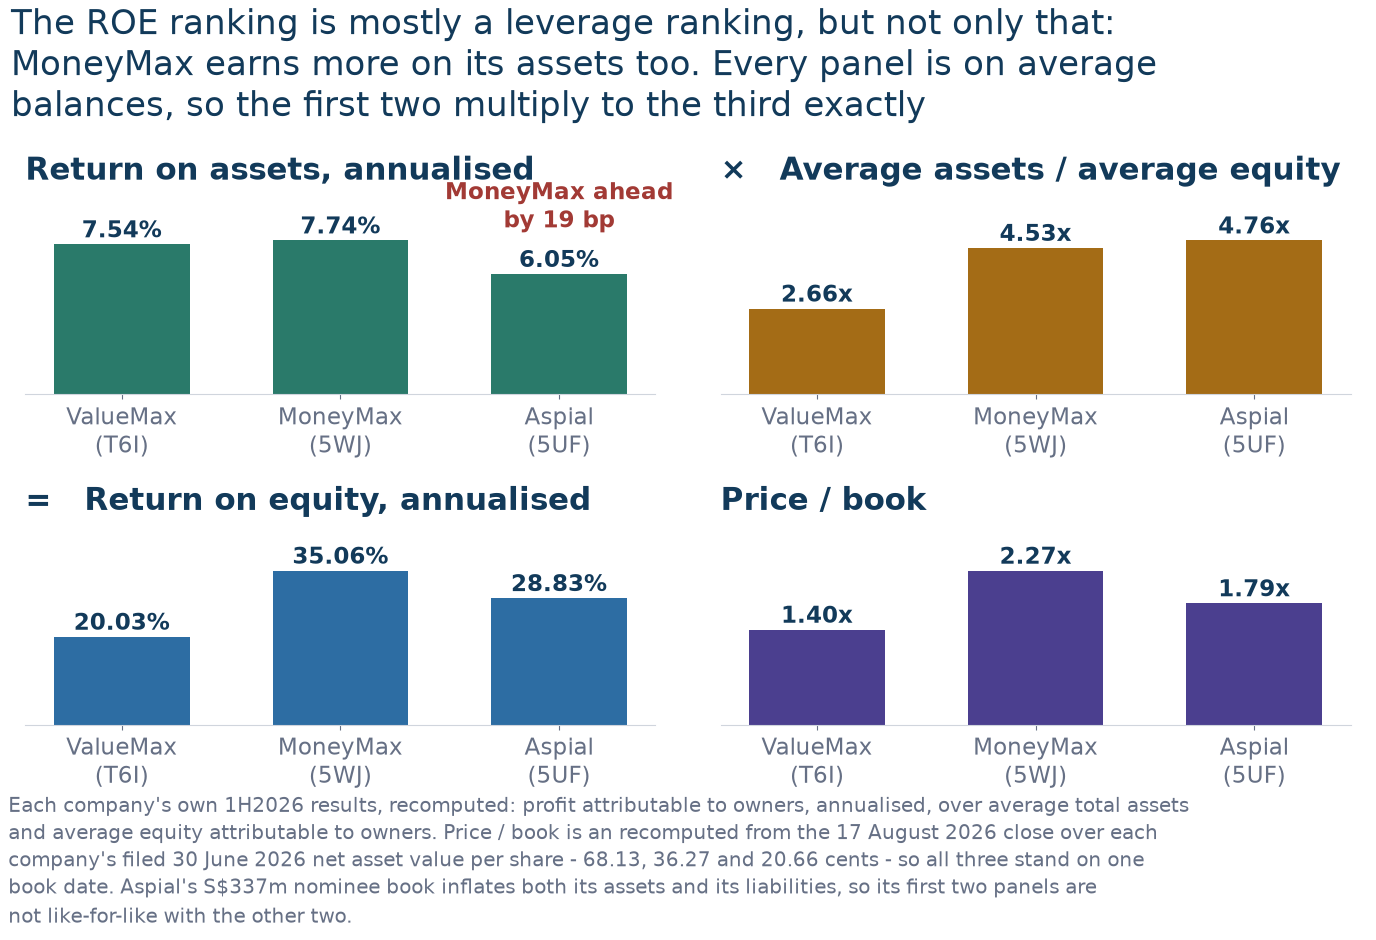
Each company’s own 1H2026 results announcement, recomputed (R/D); the price-to-book row is recomputed (R/D) rather than carried from an aggregator, because the aggregator figures sat on two different book dates inside one row: the 17 August 2026 close — S$0.955, S$0.825 and S$0.370 — over each company’s 30 June 2026 equity attributable to owners divided by shares in issue excluding treasury, which is the net asset value per share each of them files: 68.13, 36.27 and 20.66 cents. The book date is stated because it decides the answer. On 31 December 2025 books the same three closes give 1.48×, 2.89× and 2.28×, and MoneyMax moves furthest because its April 2026 placement issued 53.0m shares for about S$43.5m against a 28.60-cent book. Profit is attributable to owners in the ratio rows, over average total assets and average equity attributable to owners — one convention throughout, so the three highlighted rows multiply together exactly. MoneyMax consolidates Malaysia (14.1% of revenue) where ValueMax equity-accounts it; its balance sheet grew 19.9% in the half, helped by a S$43.5m cash placement in April 2026 for its Catalist-to-Main-Board transfer — the S$59.6m rise in its share capital also contains S$16.1m of scrip dividend, which raised no cash, and averaging is what stops that growth flattering its returns. Aspial’s S$337m nominee book inflates both its assets and its liabilities, so its first two ratio rows are not like-for-like with the other two. Which perimeter this is, and what the other says. These rows pair an attributable numerator with attributable equity throughout. The other consistent choice — total profit after tax over average TOTAL assets and equity, which the private research file uses — gives return on assets of 7.66%, 8.16% and 6.35% and return on equity of 20.14% and 34.55% for the two Singapore names. Both sets multiply through correctly and both rank MoneyMax ahead of ValueMax on assets; they differ only in whether minority-funded profit and minority-funded equity are counted. The ranking is not an artefact of the choice, which is the point of stating it.
Read the three highlighted rows as one multiplication. Return on assets times the asset multiplier is return on equity, exactly: 7.54% × 2.66 = 20.03% for ValueMax, 7.74% × 4.53 = 35.06% for MoneyMax, 6.05% × 4.76 = 28.83% for Aspial. The ROE gap between ValueMax and MoneyMax is 1,503 basis points. It does not split additively — return on equity is the product of the two columns, so the 19-basis-point difference in asset returns is amplified by MoneyMax’s leverage before it reaches the ROE line. Decomposed properly, 88 basis points of the gap come from asset productivity and 1,415 from the leverage difference: MoneyMax carries 4.53 times its equity in assets against ValueMax’s 2.66. The book multiples do not line up behind either column, which is itself worth noticing. ValueMax is cheapest on book and lowest on leverage, but Aspial carries the most leverage of the three at 4.76× and trades at the middle multiple, while MoneyMax carries less leverage and the highest. So the multiple is not a simple restatement of the balance sheet either — it is the one number here the filings do not determine. What stays true is that a comparison starting from ROE or P/B without decomposing is comparing balance-sheet choices rather than businesses. What is no longer true is the stronger claim this page made until 24 August 2026 — that the two earn the same return on assets. MoneyMax earns more. (D)
The convention decides the ranking, and the discarded one was the only one that favoured ValueMax. Attributable profit over period-end assets — the basis this table used until 24 August 2026 — gives ValueMax 7.11% against MoneyMax 7.09%, a lead of 1.8 basis points. The other three pairings all reverse it: total profit over average assets, 7.66% against 8.16%; total over period-end, 7.22% against 7.48%; attributable over average, 7.54% against 7.74%. The discarded basis was also the weakest of the four, pairing a numerator that excludes minority profit with a denominator holding all of the assets minorities fund, and charging a full half-year’s profit against a balance sheet that only existed at the end of the half — which flatters whichever company grew slower. MoneyMax’s assets grew 19.9% in these six months and ValueMax’s 12.9%. (D)
The two retail arms are different businesses wearing one segment name. ValueMax's retail line generates 18% more revenue than MoneyMax's on the same segment assets — and 27% less profit (margin 7.9% vs 12.9%). The names explain it: MoneyMax reports "retail and trading of gold and luxury items"; ValueMax's line is dominated by wholesale gold to ten counterparties. A gold wholesaler and a luxury reseller — and wholesale margin is precisely what compresses when the gold price stops rising. It also makes the LV undertaking cheap for ValueMax and expensive for a peer. (R/D)
The competitive fact: MoneyMax's consolidated pledge book is 75% larger, at an almost identical yield (14.0% vs 14.2% — two companies writing at the same statutory ceiling), and MoneyMax is the one adding stores (26 year-to-date against ValueMax's two-year-static 50). (R)
The same decomposition drawn: return on assets, the asset multiplier and the product of the two, every panel on average balances. Rebuilt 24 August 2026 — the previous version mixed average and period-end denominators across its panels, so they did not multiply together.
9 · What drives the earnings
Gold — one factor wearing three costumes. The company's disclosed direct sensitivity is trivial: 5% on the price moves PBT by ~S$1.0m (the inventory and gold-loan mark only). The real transmission is (a) the trading margin — one point of retail segment margin ≈ S$5.7m of PBT, six times the disclosed figure; (b) pledge quanta and hence book growth; (c) redemption-vs-forfeiture behaviour, which sets the internal inventory pipeline. In a reversal all three move together — the offset (forfeitures feed retail with cheap stock) is real but weaker, because inventory acquired into a falling market is worth less on sale. Anyone sizing gold risk off the note-32 disclosure alone under-sizes it by roughly an order of magnitude. Company-disclosed context: gold peaked ~US$5,300/oz in March 2026 and stood ~US$4,100 in early August — the tailwind has stopped. (R/D)
Funding cost against a capped asset yield. Blended cost of funds: 2.28% (FY2021) → 5.66% (FY2023) → 3.76% (FY2025). The company's own sensitivity: S$4.43m of PBT per 50bp on FY2025 balances. Because the pawn book cannot reprice above 1.5%/month, hiking cycles squeeze and cutting cycles expand — the single cleanest explanation of the FY2022–23 margin history. (R)
Book growth, and its funding shadow. Receivables +25.3% in FY2025, +15.0% in 1H2026 alone. Five points of annual book growth ≈ S$9.5m of PBT — and ≈ S$70m of incremental funding. The growth and the funding requirement are the same number seen from two sides. (D)
Credit cost normalisation. FY2025 ECL charge: 0.33% of the closing book; below 0.5% for a decade — but see §6 on which book generated the losses. Every 25bp on the book ≈ S$3.8m of PBT. (R/D)
Competitive position in a licence-capped market. Watch the outlet count against the MinLaw licence list, and pawn interest income against MoneyMax's on aligned six-month windows. (R)
10 · Defensiveness, by shock type
Recession / credit stress: counter-cyclical. Pawn demand rises when credit tightens. COVID is the cleanest read: FY2020 PBT rose 29% and operating cash flow was positive. (R)
Rate shock: exposed but demonstrated. FY2022–23 multiplied the funding cost 2.5x and quadrupled finance costs; group PBT still grew 7.5% and 18.9%. (R)
Gold reversal: the exposure. The FY2013–15 analogue: revenue fell 24%, pawn segment profit fell, gross profit still rose every year — genuinely reassuring, but the gold-linked profit share is far larger now than then. (R)
Singapore property downturn: untested. The moneylending book was S$41m in FY2015 and is S$824m now. There is no listed-history observation of this book under stress. (R)
11 · Growth attribution — what propelled FY2020→FY2025
D/O — precision is impossible; the mix is the point. Roughly a tenth of the growth renews itself, a third needs continued funding access, and close to half needs the gold cycle to hold.
12 · Red-flags scorecard
Search reports over the FY2013–25 annual reports, 1H2022–1H2026 interims, both Fitch reports, the 12-month announcement tape and press through 20 August 2026 — verdicts describe what was found, not what exists.
Item
Verdict
Evidence
Auditor changes / qualifications
Clear
EY since listing, unqualified every year; partner rotated FY2022
Frequent equity fundraising
Watch
Rights 2021 and 2023 plus warrant tranches; shares +77% since IPO
Receivables vs revenue growth
Watch
Book +25.3% vs revenue +21.3% in FY2025; the 1H2026 direction was favourable
Related-party transactions
Watch
Small against PBT, but +126% purchases from director-related companies; family holds the company's CP
KPI redefinition / dropped disclosures
Clear
Segment basis unchanged since FY2015
Board / CFO turnover
Clear
Stable; CFO externally recognised 2025
Promotional IR uncorrelated with fundamentals
Watch
First interim dividend, first press release, first named quotes — all within twelve months of the block trade and index inclusion; fundamentals were genuinely at a record
Litigation
Watch
LV suit settled without liability — with a never-announced undertaking not to sell LV items (2026 AGM minutes)
Moneylending credit quality
Flag
Not a red flag in the accounts — a flag in what the accounts cannot show: aggregate loss expense is low, but the larger moneylending portfolio has no ageing/NPL disclosure
Minority dissent on dilution mandate
Watch
Votes against: 63,711 (2025) → 14,988,186 (2026)
Covenant headroom / undrawn facilities
Flag
Filed thresholds and public proxies show headroom, but undrawn committed facilities, lender concentration and monthly maturities remain undisclosed
Unaudited cash-flow classification
Flag
The S$101.1m item in §3, unresolved until the FY2026 audit
13 · The watch-list — dated, gradable, falsifiable
Seven questions, each answerable by a specific future disclosure:
Does the FY2026 audited cash-flow note reconcile the S$101.1m payables line — and to what? (FY2026 AR, ~Mar–Apr 2027)
Where does FY2026 gross debt/equity print against the 1.62x reported at 30 June 2026, with the payout maintained — and are committed undrawn facilities disclosed alongside it? (FY2026 results, ~24 Feb 2027)
Does the ECL charge stay under 0.5% as moneylending receivables continue to grow? (Half-yearly)
Does the Singapore outlet count move off 50 — and at what disclosed price per licence? (Announcement tape)
Does the inter-segment pledge flow re-accelerate? (Segment note, half-yearly)
Does the family buy back below S$1.00, having sold at S$1.16? (Director interest notices)
When a verifiable secondary quote is available, what yield and spread do the S$80m 4.00% 2029 notes imply? (Periodic market check; no executable quote verified at this cut-off)
Date
Event
What it shows
3 Sep 2026
1H2026 interim dividend paid (1.38c)
Payout stance confirmed
14 Sep 2026
Warrant expiry
Final diluted share denominator becomes observable; the latest model uses 947.1m issued shares
Q4 2026
Commercial-paper rollovers (ADDX/SDAX)
A live print on funding cost (~3.5% currently)
~24 Feb 2027
FY2026 results
The most information-dense event: gearing, ECL, retail margin, payout — in one print
~Mar–Apr 2027
FY2026 annual report
Resolves the S$101.1m classification question either way
Apr 2027
AGM
Whether the register's dilution dissent was a one-off
How to read the undated possibilities, decided in advance: a pawnshop acquisition disclosed with consideration and acquired pledge-book size is informative; the same headline without terms is not. A capital raise's structure and pricing relative to book value — and what the proceeds fund — matters more than its existence. A partial Well Chip monetisation is the one path that relieves the funding arithmetic without touching T6I's share count.
13 · The share price and what came with its moves
Over the window ValueMax returned +244.8% on a dividend-adjusted basis; the Straits Times Index returned +71.9% and the median of the 2 listed comparisons +445.1%.
Click a quarter — on the chart or in the return strip under it — to read its filings beside its large moves.
Key: ValueMax (T6I) as a solid line; Straits Times Index rebased, dashed; peer median rebased, dotted; the peer median runs off scale from Jan 26 and is clipped there; filing ticks above the axis; ex-dividend ticks on it; numbered pins are moves with a written note; plain dots are other detected moves.
Key moves
The five largest moves over a day or up to two weeks, with no day counted twice.
Each move is shown next to the market over the same days (and peers, where shown). News listed with a move was published within its dates; that does not mean the news caused the move. The quarter view has all the news.
Index: Straits Times Index. Peers: the average of two listed companies used as a sector check; the notes name them and their limits.
Q1 2023
20 Feb 2023 – 31 Mar 2023 (part quarter)
T6I +0.0%STI −1.5%Peer median −8.1%Range S$0.33–S$0.36Close S$0.35
Gross margin rose to 28.6% from 27.3% on a higher revenue share from pawnbroking and moneylending; moneylending revenue rose S$9.4m and pawnbroking S$5.3m while retail and trading of jewellery and gold fell S$3.1m. Interest costs within cost of sales rose S$2.5m for pawnbroking and S$5.4m for moneylending. The second half was weaker: 2H2022 revenue fell 7.1% to S$133.6m and profit before tax fell 14.5% to S$23.3m. Operating cash flow was an outflow of S$163.4m as trade and other receivables rose S$193.0m, funded by S$163.3m of net new borrowings; loans and borrowings were S$577.2m current and S$33.3m non-current against cash of S$11.0m. The dividend is payable in cash or scrip.
Guidance: Gold 'may continue to remain volatile' with rising rates and geopolitical tension; the company said it continues to face 'a challenging business environment and increased competition', will explore acquisitions and moneylending growth, and will assess fund-raising, capital-market, joint-venture or M&A options for its associated companies.Next session (2 Mar): T6I −1.4% · STI −0.6% · peers +0.0%
SGX-ST asked on 13 March 2023 why the group generated no operating cash inflow despite a net profit, how it would meet its payment obligations over the next 12 months with S$6.3m of cash and cash equivalents, and why borrowings had risen S$167.9m in the year. The company said the moneylending and pawnbroking loan books absorb working capital as they grow, that operating cash flow before working capital was S$74.2m (FY2021: S$62.4m), that it keeps only enough cash for daily needs and relies on bank facilities plus a S$100m commercial-paper programme and a S$300m medium-term-note programme, and that pawnbroking and moneylending segment assets had risen S$45.6m and S$146.5m.
Next session (16 Mar): T6I +0.0% · STI −0.5% · peers +0.0%
Large price moves
122 Mar 2023 · +6% · index +2% · peers 0%
223 Mar 2023 · −7% · index 0% · peers +1%
Q2 2023
3 Apr 2023 – 30 Jun 2023
T6I −1.4%STI −1.6%Peer median +6.4%Range S$0.32–S$0.35Close S$0.33
Approved at the AGM of 25 April 2023; record date 11 May 2023 and paid on 27 June 2023. The chart's return series is adjusted for it, so the ex-date step is not counted as a move.
Up to 73,158,897 rights shares at S$0.325, a 0% discount to the S$0.325 VWAP of 28 June 2023, with up to 146,317,794 detachable warrants exercisable at S$0.36 (a 10.8% premium) over three years. The issue is non-underwritten and carries no minimum amount; Executive Chairman Yeah Hiang Nam, with a deemed interest of 82.97%, undertook to take up the entitlement on the 66,379,454 shares (9.07%) held through his nominee. All net proceeds are for working capital, and the company said the issue is intended to strengthen the capital base and fund growth of the moneylending business. The offer information statement was lodged on 22 August 2023.
Next session (3 Jul): T6I −1.5% · STI +0.0% · peers +0.3%
Large price moves
310 May 2023 · +6% · index 0% · peers −1%
Q3 2023
3 Jul 2023 – 29 Sep 2023
T6I −6.2%STI +0.4%Peer median −0.3%Range S$0.30–S$0.33Close S$0.30
Pawnbroking revenue rose S$4.0m and moneylending S$8.3m while retail and trading fell S$13.9m, lifting gross margin to 30.1% from 27.7%. Interest costs within cost of sales rose S$3.8m for pawnbroking and S$5.4m for moneylending, which the company attributed to higher interest rates, and finance costs rose 168.8% to S$2.9m; interest paid in the half was S$16.1m. Operating cash flow was an outflow of S$56.7m as receivables rose S$53.1m and inventories S$19.9m; loans and borrowings were S$649.7m current and S$40.3m non-current against cash of S$10.7m. No interim dividend, in line with the company's policy of considering only a final dividend.
Guidance: Gold 'may continue to remain volatile'; the company again cited 'a challenging business environment and increased competition', and said its Malaysian associated companies were being restructured in preparation for potential fund raising and/or capital-market opportunities.Next session (15 Aug): T6I +0.0% · STI −0.5% · peers −0.7%
Valid acceptances covered 65,719,167 rights shares (89.8%) and excess applications 6,352,943 (8.7%); 7,439,730 were not taken up, and the issue was therefore undersubscribed with all excess applications filled. Yeah Hiang Nam received 9,637,945 rights shares including 3,000,000 on excess application. The rights shares were listed on 19 September and the warrants on 20 September 2023. Net proceeds were S$23,236,000 after S$187,000 of expenses, reported in the FY2023 annual report as applied S$19.4m to moneylending loans and S$3.8m to pawnbroking loans.
Next session (15 Sep): T6I +0.0% · STI +1.0% · peers +0.0%
Q4 2023
2 Oct 2023 – 29 Dec 2023
T6I +4.9%STI +0.7%Peer median −5.2%Range S$0.29–S$0.34Close S$0.32
Its stakes in SYT Pavilion (49.46%) and in Thye Shing Pawnshop, Kedai Emas Well Chip and Kedai Pajak Well Chip (49.35% each) are to be swapped into Well Chip Group Sdn Bhd for RM171,646,606 of consideration, set at the targets' combined net asset value at 31 December 2022 and satisfied by 449,999,999 new Well Chip shares. VMM Holdings will hold 19.75% of Well Chip directly and 29.62% through VYN Holdings, in which it holds 43.83%. The announcement was broadcast at 12:09, during the trading session.
Next session (14 Nov): T6I +0.0% · STI −0.1% · peers −0.4%
Large price moves
4week to 24 Nov 2023 · +10% · index −1% · peers +6%
512 Dec 2023 · −9% · index 0% · peers +2%
614 Dec 2023 · +7% · index +1% · peers −1%
Q1 2024
2 Jan 2024 – 28 Mar 2024
T6I +18.7%STI −0.5%Peer median +4.3%Range S$0.32–S$0.40Close S$0.38
All three segments grew: retail and trading rose S$17.2m, pawnbroking S$9.6m and moneylending S$17.1m, and gross margin widened to 30.3% from 28.6%. The second half carried the year: 2H2023 revenue rose 34.1% to S$179.2m and 2H PATMI 44.4% to S$27.8m. Interest paid roughly doubled to S$33.7m from S$17.2m, employee costs rose S$3.4m and the allowance for expected credit losses on trade receivables rose S$1.4m. Operating cash flow turned to an inflow of S$3.5m; the rights issue brought in S$23.2m net, and loans and borrowings were S$564.7m current and S$49.2m non-current against cash of S$15.5m.
Guidance: Gold 'may continue to remain volatile' above US$2,000; the company said it faces increased competition 'especially in the moneylending segment' and will keep exploring acquisitions and outlet locations.Next session (21 Feb): T6I +11.1% · STI −0.8% · peers +0.0%
Large price moves
721 Feb 2024 · +11% · index −1% · peers 0%
8week to 23 Feb 2024 · +11% · index −1% · peers +7%
Q2 2024
1 Apr 2024 – 28 Jun 2024
T6I +15.7%STI +3.4%Peer median +7.7%Range S$0.36–S$0.41Close S$0.41
Applications close on 10 July, balloting is on 12 July and allotment on 19 July 2024. The restructuring of the Malaysian associates had completed on 20 May 2024. Broadcast at 12:00, during the session.
Next session (27 Jun): T6I +2.6% · STI +0.3% · peers +0.0%
Large price moves
928 Jun 2024 · +5% · index 0% · peers −3%
Q3 2024
1 Jul 2024 – 30 Sep 2024
T6I +9.6%STI +7.6%Peer median +15.8%Range S$0.40–S$0.47Close S$0.46
Well Chip listed on 23 July 2024, issuing 150,000,000 new shares at RM1.15 each; ValueMax's effective interest fell from 49.37% to 37.03% and it booked a S$10,137,000 gain on dilution in FY2024. The company later described Well Chip as the first pawnbroker listed on Bursa Malaysia.
Next session (15 Jul): T6I +1.2% · STI +0.1% · peers +1.4%
Retail and trading revenue rose S$71.6m to S$174.4m, pawnbroking S$3.1m and moneylending S$3.3m; gross margin fell from 30.1% because the lower-margin retail segment grew fastest, while interest costs within cost of sales fell S$1.0m for pawnbroking and S$0.9m for moneylending. Administrative expenses rose S$3.6m, of which S$3.0m was staff cost, and the allowance for doubtful trade receivables rose S$2.3m. Share of associates rose S$1.0m to S$3.5m. Operating cash flow was an outflow of S$18.1m as receivables rose S$66.1m; warrant exercises brought in S$23.2m and S$19.8m of dividends were paid. Loans and borrowings were S$587.6m current and S$48.8m non-current against cash of S$20.0m.
Guidance: Gold near US$2,500 'may continue to remain volatile'; the company cited a 'challenging business environment and increased competition', noted Well Chip's listing on 23 July 2024, and said it would keep exploring acquisitions and outlet locations.Next session (14 Aug): T6I +0.0% · STI +0.9% · peers +5.1%
Large price moves
10week to 16 Aug 2024 · +11% · index +3% · peers +8%
Q4 2024
1 Oct 2024 – 31 Dec 2024
T6I −3.3%STI +5.6%Peer median −3.1%Range S$0.43–S$0.47Close S$0.44
The company said it was not aware of any external leakage of data, that investigations were ongoing with a review of its IT systems to follow, and that its business continuity plan had been activated to limit disruption to customers. No further update on the incident appears on the tape.
Next session (16 Oct): T6I −1.1% · STI −0.1% · peers +0.0%
The price was set by reference to Ban Fook's pledge loan book and inventory and is funded internally. Completion is conditional on the Registrar of Pawnbrokers approving the transfer of the pledges held at Ban Fook's Woodlands outlet to premises nominated by ValueMax and on Ban Fook surrendering its HDB lease. The company classed it as a non-discloseable transaction under Rule 1006; the FY2024 results later said the S$3.3m pledge book was taken over in February 2025, and the 1H2025 results that Ban Fook and Heng Heng Pawnshop were both completed in March 2025.
Large price moves
1112 Nov 2024 · −6% · index −1% · peers −5%
Q1 2025
2 Jan 2025 – 28 Mar 2025
T6I +18.2%STI +4.9%Peer median +18.3%Range S$0.42–S$0.53Close S$0.52
Retail and trading revenue rose S$116.7m to S$343.8m, pawnbroking S$6.2m to S$48.9m and moneylending S$2.3m to S$63.5m; gross margin fell to 28.5% from 30.3% on the retail mix, while interest costs within cost of sales fell S$0.5m for pawnbroking and S$3.9m for moneylending. The gain on dilution of S$10,137,000 arose from Well Chip's IPO at a premium; excluding it, profit before tax rose 37.9% (computed). Administrative expenses rose S$5.4m, share of associates rose to S$6.3m from S$5.3m, and the expected-credit-loss allowance rose S$0.4m. 2H2024 revenue rose 26.3% to S$226.4m and 2H PATMI 70.6% to S$47.4m. Operating cash flow was an outflow of S$55.9m as receivables rose S$140.9m; interest paid was S$30.7m, capex S$11.4m and warrant proceeds S$23.2m. Loans and borrowings were S$641.3m current and S$46.0m non-current against cash of S$16.8m.
Guidance: Gold above US$2,900 'may continue to remain high in the near future'; the company cited increased competition 'especially in the moneylending segment', said it had taken over Ban Fook's S$3.3m pledge loan book in February 2025 with completion expected in March, and would keep exploring acquisitions.Next session (28 Feb): T6I +2.0% · STI −0.7% · peers +0.2%
Q2 2025
1 Apr 2025 – 30 Jun 2025
T6I +22.6%STI −0.2%Peer median +23.1%Range S$0.48–S$0.61Close S$0.60
Gross margin rose to 30.2% from 27.6%, which the company attributed to better margins in all three segments: retail and trading revenue rose 17.5% to S$204.8m, pawnbroking 20.2% to S$28.1m and moneylending 10.7% to S$35.4m. Administrative expenses rose S$5.3m, the credit-loss allowance on trade receivables was S$1.2m against S$2.6m, and share of associates rose 25.8% to S$4.4m. Heng Heng Pawnshop and Ban Fook Pawnshop were both acquired in March 2025. Operating cash flow was an outflow of S$11.2m as receivables rose S$72.1m; warrant exercises brought in S$24.1m. Loans and borrowings were S$699.4m current and S$56.7m non-current against cash of S$46.5m. The interim dividend is paid on 2 September 2025, and the board said it would 'strive to maintain or increase annual dividend payouts'.
Guidance: Gold above US$3,400 'may continue to fluctuate'; the company cited a 'challenging business environment' and said it would keep exploring acquisitions and outlet locations.Next session (13 Aug): T6I −1.2% · STI +1.2% · peers −0.7%
Responding to a Business Times report, the company said LV alleges trademark infringement and passing off, that the items were unredeemed pawned goods procured through separate sources, that the subsidiary would defend the claims, and that the board expects no material impact on the business or the FY2025 financial statements.
Next session (19 Dec): T6I −1.0% · STI −0.0% · peers +0.0%
Large price moves
201 Oct 2025 · +7% · index +1% · peers +4%
213 Oct 2025 · +8% · index 0% · peers +3%
22week to 3 Oct 2025 · +16% · index +3% · peers +9%
Q1 2026
2 Jan 2026 – 31 Mar 2026
T6I +3.0%STI +5.1%Peer median +51.7%Range S$0.94–S$1.34Close S$1.02
Retail and trading revenue rose S$81.2m to S$425.0m, pawnbroking S$11.9m to S$60.8m and moneylending S$3.8m to S$67.3m; gross margin recovered to 30.3% from 28.5%. Profit before tax rose 26.2% to S$123.2m, or about 40.9% excluding the prior year's S$10.1m Well Chip dilution gain, by the company's calculation. Share of associates rose to S$11.6m from S$6.3m, administrative expenses rose S$7.0m and the expected-credit-loss allowance rose S$1.6m. 2H2025 revenue rose 25.8% to S$284.8m and 2H PATMI 14.0% to S$54.1m. Operating cash flow was an outflow of S$166.7m as receivables rose S$252.1m, against S$201.3m of net new borrowings and S$25.9m of warrant proceeds. Loans and borrowings were S$820.9m current and S$65.4m non-current against cash of S$22.4m; net assets were S$611.8m and the company put its debt-to-equity ratio at 1.43 times. The final dividend of 2.68 cents adds to the 1.20-cent interim, a payout of about 34.8% on basic EPS of 11.16 cents.
Guidance: Gold past US$5,000 in early 2026; the company said it faces 'volatile market conditions and intensified competition' and remains committed to its expansion strategy through acquisitions, new outlets and moneylending growth.Next session (24 Feb): T6I −4.5% · STI −0.4% · peers −5.5%
The company said the amicable settlement will have no material impact on the current year's results. The AGM minutes published on 21 May 2026 record an undertaking by the group not to sell LV items going forward, which the announcement itself does not mention.
Next session (24 Feb): T6I −4.5% · STI −0.4% · peers −5.5%
OCBC acted as placement agent; the buyers named were abrdn Asia, Amova Asset Management Asia, Avanda Investment Management and ICH Synergrowth Fund. Yeah Hiang Nam and Tan Hong Yee gave a 90-day lock-up and retain a direct and deemed interest of 81.53%. The company said the sale was undertaken to institutionalise the register, improve liquidity and free float and support eligibility for indices such as the iEdge Singapore Next 50, and that it involves no new shares. The announcement is dated 25 February 2026 and appears on the tape on 26 February; the shares had closed at S$1.34 on 23 February, their highest close in the window.
Same session: T6I −2.4% · STI −0.9% · peers −5.4%
Large price moves
232 Jan 2026 · −5% · index 0% · peers +1%
2426 Jan 2026 · +12% · index −1% · peers +13%
25week to 30 Jan 2026 · +11% · index 0% · peers +7%
2623 Feb 2026 · +10% · index +1% · peers +9%
2727 Feb 2026 · −7% · index +1% · peers +1%
2825 Mar 2026 · +7% · index +1% · peers +8%
Q2 2026
1 Apr 2026 – 30 Jun 2026
T6I −10.6%STI +5.8%Peer median +11.6%Range S$0.86–S$1.18Close S$0.89
Four queries dated 21 April 2026. The company reconciled S$1,544,000 of sales and S$5,741,000 of purchases with director-related companies to the S$598,000 and S$4,266,000 in its interested-person table, the difference being transactions under S$100,000 and companies owned by directors' relatives who are not interested persons (S$830,000 of sales and S$1,354,000 of purchases). It said the warrant proceeds went mainly to pawnbroking loans, declined to name or band its top three key managers' remuneration on grounds of confidentiality and commercial sensitivity, and set out board diversity targets of at least 20% female directors and a majority of independent directors (four of seven).
Next session (24 Apr): T6I −7.1% · STI −0.4% · peers −2.6%
Approved at the AGM of 21 April 2026, where all nine resolutions passed; the share-issue mandate drew 14,988,186 votes against (1.84%) compared with 63,711 a year earlier. Record date 8 May 2026 and paid on 21 May 2026.
ValueMax's own announcement only pointed to the Bursa Malaysia filing. Well Chip's circular of 14 August 2026 sets the minimum at about RM60.8m, underpinned by an undertaking from VYN Holdings, the 50.70% holder through which ValueMax owns part of its stake, to take up its entitlement in full; the EGM is on 3 September 2026. Whether ValueMax subscribes directly, and for how much, is not stated in any filing on the tape.
Next session (8 Jun): T6I −4.1% · STI −1.7% · peers −4.0%
The programme agreement and trust deed of 22 April 2016 with DBS were amended and restated, the supplemental trust deed aligning the financial covenants 'for consistency with the financial covenants in the Company's existing bank facilities', and the information memorandum last updated on 11 April 2018 was replaced. Notes are offered only to institutional and accredited investors, with proceeds for general corporate purposes including refinancing.
Fitch's drivers were the pawnbroking franchise (an estimated 20% of sector outlets), pretax return on average assets of 8.8% in 2025 and loan growth of 26% in 2025, set against non-prime borrowers, earnings sensitivity to gold, concentration and recovery risk in property-backed moneylending (about half of assets) and reliance on short-tenor secured bank funding. Fitch said it expects profitability to moderate this year while pretax ROAA stays above 6%, and named sustained delinquency increases or a property or gold downturn as downgrade triggers. Broadcast at 12:33, during the session.
Next session (16 Jun): T6I −0.5% · STI +0.8% · peers −4.0%
Large price moves
298 Apr 2026 · +8% · index +1% · peers +10%
3024 Apr 2026 · −7% · index 0% · peers −3%
31week to 24 Apr 2026 · −12% · index −2% · peers +3%
Q3 2026
1 Jul 2026 – 21 Aug 2026 (part quarter)
T6I +10.1%STI +10.0%Peer median +3.6%Range S$0.87–S$1.01Close S$0.98
Series 003 was priced on 30 June 2026 for issue on 10 July and listing on 13 July, in S$250,000 denominations to institutional and accredited investors, with DBS as sole global coordinator and DBS and OCBC as joint lead managers; Fitch assigned the notes an expected 'BB'. The notes are direct, unsecured and unsubordinated obligations and carry a put if Yeah Hiang Nam and his immediate family cease to own at least 51% of the shares. Proceeds are for general corporate purposes including refinancing existing borrowings. The closing announcement followed on 10 July 2026.
Retail and trading revenue rose S$85.1m to S$290.0m, pawnbroking S$12.0m to S$40.1m and moneylending S$5.3m to S$40.7m; the company attributed the margin fall from 30.2% to the larger share of retail and trading. Pawnbroking segment profit rose to S$21.9m from S$13.0m while retail segment profit rose to S$23.0m from S$21.3m on the much larger revenue; share of associates rose S$1.8m to S$6.3m. Operating cash flow was an outflow of S$33.8m after a S$192.7m rise in receivables and a S$101.1m increase in trade and other payables in the cash-flow statement, against a S$0.3m rise in payables on the balance sheet. Loans and borrowings were S$964.0m current and S$82.4m non-current against cash of S$18.8m; net assets were S$651.6m. A 40% stake in PT Gadai ValueMax Indonesia, with 11 Jakarta outlets, was acquired in April. A replacement filing on 14 August corrected the dividend book-closure year only; 783,198 of the 2023 warrants remained unexercised ahead of expiry on 14 September 2026.
Guidance: Gold peaked near US$5,300 in March 2026 and was about US$4,100 in early August and 'may continue to remain volatile'; the company said it continues to face 'a challenging business environment and increased competition' and will keep exploring acquisitions and outlet locations. The interim dividend's ex-date of 26 August 2026 falls after the price window.Next session (14 Aug): T6I +0.0% · STI +0.4% · peers +1.2%
Large price moves
323 Jul 2026 · +7% · index +1% · peers +6%
Notes and sources
Share price record
How this section was built
The detector flagged 32 large moves in the window — 21 single sessions and 11 weekly windows — before any news was read. 1 market move, 15 sector moves; 16 are left over after both controls, unexplained by them. Of those, 3 followed a filing by timestamp, 3 coincided with one in the same session or week and 10 have nothing filed against them beyond routine notices and are recorded as unexplained rather than explained away.
This section records the 42-month price history and puts every large move through two subtractions and reports what is left over, not what caused it: first the Straits Times Index, then the median of the two listed pawnbroking comparisons — MoneyMax Financial Services and Aspial Lifestyle — which trade the same session. With two names the median is their mean, and a single peer event moves it; the per-peer returns are listed in each row of the full move register. “Left over” is what survives both controls.
Each quarter panel pairs two records. Key developments are the filings that carry information — results, the 2023 rights-cum-warrants issue, the Well Chip listing and rights issue, the pawnshop acquisitions, the Louis Vuitton litigation and its settlement, the vendor share sale, the Fitch rating, the note issue, every ex-date — with the figures as filed, the guidance given, the close on the day and how the reacting session traded against both controls; a filing after the 09:00 open is read against the next session. Large price moves are the threshold-detected sessions from the price-driver register.
How to read the tags.Market-wide and Sector-wide mean the index or the peer median moved with the share over the same session or week; Residual means the move is still large after both are subtracted. A residual is what is left over, not a cause: it does not establish that the company’s own news moved the price, and an unchanged or thinly traded price is not proof that no information arrived. Returns use the dividend-adjusted close; a filing released after the open is read against the next session.
Prices are a market-data vendor's daily closes for T6I.SI (881 sessions, 20 February 2023 to 21 August 2026), dividend-adjusted with no splits in the window; the traded close is shown. The announcement tape is the issuer's investor-relations listing parsed to 437 SGXNet-linked items from 10 March 2021 to 17 August 2026, inside which the window sits; release times are SGX broadcast times.
Limitations bound every row above. The tape is the issuer's own investor-relations listing, 437 announcements from 10 March 2021 to 17 August 2026 each linked to SGXNet; it was stale by about four weeks when checked on 16 August 2026 and carries no broadcast times, so every release time in this register was read from the filing's own SGX landing page (Date and Time of Broadcast); ex-dividend dates are carried as dates only. The disclosure stream of Well Chip Group Berhad, the 37.03%-owned Bursa Malaysia-listed associate, was not enumerated: its quarterly results, IPO prospectus and June 2026 rights issue reached this register only through ValueMax's own cross-announcements, and PT Gadai ValueMax Indonesia, the 40% associate acquired in April 2026, is unlisted and has no stream. Press (including the Business Times report that prompted the December 2025 litigation update), index-provider notices (the iEdge Singapore Next 50 inclusion of March 2026 is not on the tape), broker research and social channels were not examined, and about 80 routine ADDX/SDAX commercial-paper launch and close notices, 50 warrant-exercise allotments and 107 director and substantial-shareholder interest notices in the window were read only by title. The listed Singapore pawnbroking peer set is two names, MoneyMax (5WJ) and Aspial Lifestyle (5UF), which is the whole listed universe rather than a sample, so the peer control is the mean of two and is weak: on the week of 22 August 2025 the peer median rose 26.9% against ValueMax's 11.7%, and the driver map classes 17 of its 32 detected moves as sector repricings on a 4-point threshold that gives 6 to 23 such moves across 2 to 6 points.
A quarter shows only the columns it has. An empty developments column means: No filings beyond routine disclosures (warrant exercises, commercial-paper notices, interest notices) this quarter. An empty moves column means: No session cleared the large-move threshold this quarter.
The full move register — every large move and its market and sector controls
Every threshold-detected move in the window with its market and sector controls, dispositioned in the price-driver register; rows with a written note carry a numbered pin on the chart.
#
Session
T6I
STI
Peers
Left over
Control result
What the evidence supports
1
22 Mar 2023
+6.0%
+1.5%
−0.3%
+6.3%
Residual
No announcement on the enumerated tape accounts for this move. MoneyMax +0.0 · Aspial −0.7
2
23 Mar 2023
−7.0%
−0.1%
+1.3%
−8.4%
Residual
No announcement on the enumerated tape accounts for this move. MoneyMax +0.0 · Aspial +2.7
3
10 May 2023
+6.2%
−0.0%
−0.7%
+6.8%
Residual
No announcement on the enumerated tape accounts for this move. MoneyMax +0.0 · Aspial −1.4
4
week to 24 Nov 2023
+9.7%
−1.0%
+6.1%
+3.6%
Sector-wide
The week rose 9.7% with the sector. Both listed pawnbroking peers moved with it: the excess over the peer median is +3.58 points, inside the 4-point band this map treats as sector rather than company news. MoneyMax +12.2 · Aspial +0.0
5
12 Dec 2023
−9.1%
+0.4%
+1.7%
−10.8%
Residual
No announcement on the enumerated tape accounts for this move. MoneyMax +0.0 · Aspial +3.3
6
14 Dec 2023
+6.7%
+0.6%
−0.8%
+7.5%
Residual
No announcement on the enumerated tape accounts for this move. MoneyMax +0.0 · Aspial −1.6
7
21 Feb 2024
+11.1%
−0.8%
+0.0%
+11.1%
Residual
FY2023 results were released before the session and the shares rose 11.1% on 12x median volume. MoneyMax +0.0 · Aspial +0.0
8
week to 23 Feb 2024
+10.9%
−1.1%
+6.6%
+4.3%
Residual
The week containing the FY2023 results release closed 10.9% higher. MoneyMax +11.6 · Aspial +1.6
9
28 Jun 2024
+5.1%
−0.3%
−2.5%
+7.5%
Residual
The shares rose 5.1% in the sessions following an update on the potential Bursa listing of the group's Malaysian associate. MoneyMax −5.8 · Aspial +0.8
10
week to 16 Aug 2024
+11.1%
+2.8%
+8.4%
+2.7%
Sector-wide
The week containing the 1H2024 results release rose 11.1%, and so did the sector. Both listed pawnbroking peers moved with it: the excess over the peer median is +2.68 points, inside the 4-point band this map treats as sector rather than company news. MoneyMax +17.6 · Aspial −0.8
11
12 Nov 2024
−5.5%
−0.8%
−4.5%
−0.9%
Sector-wide
The shares fell 5.5% alongside both listed peers. Both listed pawnbroking peers moved with it: the excess over the peer median is -0.94 points, inside the 4-point band this map treats as sector rather than company news. MoneyMax −9.1 · Aspial +0.0
12
7 Apr 2025
−5.9%
−7.5%
−2.9%
−2.9%
Market-wide
The shares fell 5.9% in a session when the Straits Times Index fell 7.5%; the shares outperformed the market that day. Both listed pawnbroking peers moved with it: the excess over the peer median is -2.94 points, inside the 4-point band this map treats as sector rather than company news. MoneyMax −2.5 · Aspial −3.4
13
week to 18 Jul 2025
+8.2%
+2.5%
+4.8%
+3.4%
Sector-wide
The week rose 8.2% with the sector. Both listed pawnbroking peers moved with it: the excess over the peer median is +3.38 points, inside the 4-point band this map treats as sector rather than company news. MoneyMax +8.0 · Aspial +1.6
14
week to 25 Jul 2025
+11.4%
+1.7%
+7.7%
+3.7%
Sector-wide
The week rose 11.4% with the sector. Both listed pawnbroking peers moved with it: the excess over the peer median is +3.70 points, inside the 4-point band this map treats as sector rather than company news. MoneyMax +7.4 · Aspial +7.9
15
12 Aug 2025
+6.6%
−0.3%
+9.4%
−2.8%
Sector-wide
The shares rose 6.6% on the day of the 1H2025 results, while the peer median rose 9.4%; the shares lagged their own sector on their own results day. Both listed pawnbroking peers moved with it: the excess over the peer median is -2.76 points, inside the 4-point band this map treats as sector rather than company news. MoneyMax +12.0 · Aspial +6.8
16
week to 22 Aug 2025
+11.7%
+0.5%
+26.9%
−15.2%
Residual
The week rose 11.7% while the peer median rose 26.9%. The residual was −15.23 percentage points, outside the 4-point sector band. This was relative underperformance during a sector rise; the residual classification does not establish a company-news cause. MoneyMax +22.7 · Aspial +31.1
17
9 Sep 2025
+5.9%
−0.2%
+3.1%
+2.8%
Sector-wide
The shares rose 5.9% with the sector. Both listed pawnbroking peers moved with it: the excess over the peer median is +2.82 points, inside the 4-point band this map treats as sector rather than company news. MoneyMax −1.0 · Aspial +7.1
18
week to 12 Sep 2025
+15.7%
+0.9%
+18.1%
−2.4%
Sector-wide
The week rose 15.7% with the sector. Both listed pawnbroking peers moved with it: the excess over the peer median is -2.38 points, inside the 4-point band this map treats as sector rather than company news. MoneyMax +15.4 · Aspial +20.8
19
week to 19 Sep 2025
−14.6%
−1.0%
−17.0%
+2.5%
Sector-wide
The week fell 14.6% with the sector. Both listed pawnbroking peers moved with it: the excess over the peer median is +2.47 points, inside the 4-point band this map treats as sector rather than company news. MoneyMax −16.2 · Aspial −17.9
20
1 Oct 2025
+7.1%
+0.5%
+4.0%
+3.0%
Sector-wide
The shares rose 7.1% with the sector. Both listed pawnbroking peers moved with it: the excess over the peer median is +3.02 points, inside the 4-point band this map treats as sector rather than company news. MoneyMax +3.3 · Aspial +4.8
21
3 Oct 2025
+8.2%
+0.4%
+3.4%
+4.9%
Residual
No announcement on the enumerated tape accounts for this move. MoneyMax +4.4 · Aspial +2.3
22
week to 3 Oct 2025
+16.0%
+3.4%
+8.9%
+7.1%
Residual
No announcement on the enumerated tape accounts for this move. MoneyMax +10.5 · Aspial +7.3
23
2 Jan 2026
−5.0%
+0.2%
+0.5%
−5.6%
Residual
No announcement on the enumerated tape accounts for this move. MoneyMax +1.1 · Aspial +0.0
24
26 Jan 2026
+12.4%
−0.6%
+12.7%
−0.3%
Sector-wide
The shares rose 12.4% on 36x median volume, and the peer median rose 12.7% the same session. Both listed pawnbroking peers moved with it: the excess over the peer median is -0.30 points, inside the 4-point band this map treats as sector rather than company news. MoneyMax +12.4 · Aspial +13.0
25
week to 30 Jan 2026
+11.4%
+0.3%
+6.5%
+4.9%
Residual
No announcement on the enumerated tape accounts for this move. MoneyMax +9.3 · Aspial +3.7
26
23 Feb 2026
+9.8%
+0.5%
+8.9%
+1.0%
Sector-wide
The shares rose 9.8% on the day of the FY2025 results, to what remains their highest close; MoneyMax rose 8.2% and Aspial Lifestyle rose 9.5% the same session, and the Straits Times Index rose 0.5%. Both listed pawnbroking peers moved with it: the excess over the peer median is +0.98 points, inside the 4-point band this map treats as sector rather than company news. MoneyMax +8.2 · Aspial +9.5
27
27 Feb 2026
−7.4%
+0.6%
+1.3%
−8.7%
Residual
The Executive Chairman and his spouse placed 34.8m shares at S$1.16 on 26 February 2026 and the shares fell 7.4% the following session on 30x median volume. MoneyMax +1.2 · Aspial +1.4
28
25 Mar 2026
+7.0%
+0.9%
+7.7%
−0.7%
Sector-wide
The shares rose 7.0% with the sector. Both listed pawnbroking peers moved with it: the excess over the peer median is -0.73 points, inside the 4-point band this map treats as sector rather than company news. MoneyMax +7.0 · Aspial +8.5
29
8 Apr 2026
+7.5%
+0.8%
+9.5%
−2.0%
Sector-wide
The shares rose 7.5% with the sector. Both listed pawnbroking peers moved with it: the excess over the peer median is -2.04 points, inside the 4-point band this map treats as sector rather than company news. MoneyMax +12.6 · Aspial +6.5
30
24 Apr 2026
−7.1%
−0.4%
−2.6%
−4.6%
Residual
The shares fell 7.1% in the session after the company published its responses to four SGX-ST queries on the FY2025 annual report. MoneyMax −2.8 · Aspial −2.3
31
week to 24 Apr 2026
−11.9%
−1.5%
+3.1%
−14.9%
Residual
The week of the AGM, the annual report and the SGX query responses closed 11.9% lower while the peer median rose 3.1%. MoneyMax −2.8 · Aspial +9.0
32
3 Jul 2026
+6.9%
+0.5%
+6.1%
+0.8%
Sector-wide
The shares rose 6.9% with the sector. Both listed pawnbroking peers moved with it: the excess over the peer median is +0.78 points, inside the 4-point band this map treats as sector rather than company news. MoneyMax +4.9 · Aspial +7.4
Key developments: sources, timing and notes
1 Mar 2023 · FY2022 results: revenue up 4.2% to S$287.1m and PATMI up 7.0% to S$44.4m; final dividend raised to 2.00 cents from 1.88.ResultsReaction (next session, 2 Mar): T6I −1.4% · STI −0.6% · peers +0.0% · 41.1× median volumeSource: SGX announcement, 1 Mar 2023
15 Mar 2023 · SGX queries the FY2022 results: the exchange asks about the S$163.4m operating cash outflow, S$6.3m of cash and S$610.5m of borrowings.AnnouncementReaction (next session, 16 Mar): T6I +0.0% · STI −0.5% · peers +0.0%Source: Response to SGX queries, 15 Mar 2023
10 May 2023 · Ex-dividend: first and final FY2022 dividend of 2.00 cents per share.DividendSource: SGX dividend notice, 5 Apr 2023
30 Jun 2023 · Rights cum warrants issue proposed: 1-for-10 at S$0.325 with two free warrants per rights share, for up to S$23.5m of net proceeds from the rights and S$52.7m from the warrants.Corporate actionReaction (next session, 3 Jul): T6I −1.5% · STI +0.0% · peers +0.3% · 10.8× median volumeSource: SGX announcement, 30 Jun 2023 · OIS lodgement and timetable, 22 Aug 2023
14 Aug 2023 · 1H2023 results: revenue down 1.1% to S$151.8m and PATMI down 0.4% to S$25.1m as higher funding costs offset loan-book growth.ResultsReaction (next session, 15 Aug): T6I +0.0% · STI −0.5% · peers −0.7% · 3.0× median volumeSource: SGX announcement, 14 Aug 2023
10 Nov 2023 · Malaysian associates to be restructured under Well Chip Group for a Bursa Malaysia Main Market listing; ValueMax's effective interest stays at 49.37%.Corporate actionReaction (next session, 14 Nov): T6I +0.0% · STI −0.1% · peers −0.4% · 0.4× median volumeSource: SGX announcement, 10 Nov 2023
20 Feb 2024 · FY2023 results: revenue up 15.3% to S$331.0m and PATMI up 19.0% to S$52.9m; dividend raised to 2.20 cents from 2.00.ResultsReaction (next session, 21 Feb): T6I +11.1% · STI −0.8% · peers +0.0% · 43.9× median volumeSource: SGX announcement, 20 Feb 2024
26 Jun 2024 · Well Chip IPO timetable: 150,000,000 new shares offered from 26 June, with listing on Bursa Malaysia's Main Market set for 23 July 2024.Corporate actionReaction (next session, 27 Jun): T6I +2.6% · STI +0.3% · peers +0.0% · 1.8× median volumeSource: SGX announcement, 26 Jun 2024
12 Jul 2024 · Well Chip IPO: the 30,000,000-share public tranche is 12.87 times oversubscribed and the 120,000,000-share institutional tranche fully placed.Corporate actionReaction (next session, 15 Jul): T6I +1.2% · STI +0.1% · peers +1.4% · 1.6× median volumeSource: SGX announcement, 12 Jul 2024 · FY2024 results, 27 Feb 2025
13 Aug 2024 · 1H2024 results: revenue up 51.4% to S$229.8m and PATMI up 41.3% to S$35.4m, with gross margin down to 27.6% on the gold-trading mix.ResultsReaction (next session, 14 Aug): T6I +0.0% · STI +0.9% · peers +5.1% · 5.5× median volumeSource: SGX announcement, 13 Aug 2024
15 Oct 2024 · Cybersecurity incident: a malware attack on certain group IT servers, contained with external consultants and reported to the authorities.AnnouncementReaction (next session, 16 Oct): T6I −1.1% · STI −0.1% · peers +0.0% · 0.0× median volumeSource: SGX announcement, 15 Oct 2024
10 Dec 2024 · Acquisition: 100% of Ban Fook Pawnshop for S$1,757,400 in cash, against an audited FY2023 net asset value of S$1.84m.Corporate actionSource: SGX announcement, 10 Dec 2024
27 Feb 2025 · FY2024 results: revenue up 37.8% to S$456.2m and PATMI up 56.7% to S$82.8m, including a S$10.1m gain on the Well Chip listing; dividend raised to 2.68 cents from 2.20.ResultsReaction (next session, 28 Feb): T6I +2.0% · STI −0.7% · peers +0.2% · 21.8× median volumeSource: SGX announcement, 27 Feb 2025
8 May 2025 · Ex-dividend: first and final FY2024 dividend of 2.68 cents per share.DividendSource: SGX dividend notice, 1 Apr 2025
12 Aug 2025 · 1H2025 results: revenue up 16.8% to S$268.3m and PATMI up 35.5% to S$48.0m; a first interim dividend of 1.20 cents and a first results press release.ResultsReaction (next session, 13 Aug): T6I −1.2% · STI +1.2% · peers −0.7% · 2.7× median volumeSource: SGX announcement, 12 Aug 2025 · Press release, 12 Aug 2025
25 Aug 2025 · Ex-dividend: interim FY2025 dividend of 1.20 cents per share, the company's first interim payment.DividendSource: SGX dividend notice, 13 Aug 2025
18 Dec 2025 · Litigation: Louis Vuitton sues subsidiary ValueMax Retail in the Singapore High Court over one gold charm sold and one pair of earrings offered for sale.AnnouncementReaction (next session, 19 Dec): T6I −1.0% · STI −0.0% · peers +0.0% · 0.7× median volumeSource: SGX announcement, 18 Dec 2025
23 Feb 2026 · FY2025 results: revenue up 21.3% to S$553.1m and PATMI up 23.2% to S$102.1m, the first year above S$100m; total dividend up 44.8% to 3.88 cents.ResultsReaction (next session, 24 Feb): T6I −4.5% · STI −0.4% · peers −5.5% · 8.7× median volumeSource: SGX announcement, 23 Feb 2026
23 Feb 2026 · Litigation settled: Louis Vuitton discontinued its suit against ValueMax Retail on 12 February 2026, with no admission of liability.AnnouncementReaction (next session, 24 Feb): T6I −4.5% · STI −0.4% · peers −5.5% · 8.7× median volumeSource: SGX announcement, 23 Feb 2026
26 Feb 2026 · Vendor share sale: the Executive Chairman and his spouse place 34,800,000 shares at S$1.16, a 6.5% discount to the S$1.24 close of 25 February, with four institutions.Corporate actionReaction (same session): T6I −2.4% · STI −0.9% · peers −5.4% · 126.7× median volumeSource: SGX announcement, 26 Feb 2026
23 Apr 2026 · SGX queries the FY2025 annual report: related-party purchases of S$5,741,000 reconciled, S$25,880,000 of warrant proceeds explained, and key-management pay left undisclosed.AnnouncementReaction (next session, 24 Apr): T6I −7.1% · STI −0.4% · peers −2.6% · 4.8× median volumeSource: Response to SGX queries, 23 Apr 2026
5 Jun 2026 · Well Chip proposes a 1-for-5 rights issue of up to 120,000,000 shares, a cash call of up to RM120.0m on the 37.03%-owned associate at the illustrative RM1.00 price.Corporate actionReaction (next session, 8 Jun): T6I −4.1% · STI −1.7% · peers −4.0% · 2.9× median volumeSource: SGX announcement, 5 Jun 2026
5 Jun 2026 · S$300m medium-term-note programme refreshed: financial covenants in the 2016 trust deed amended to match the group's bank facilities and the information memorandum updated for the first time since 2018.Corporate actionSource: SGX announcement, 5 Jun 2026
15 Jun 2026 · Fitch assigns a first-time 'BB' issuer rating with a Stable outlook, citing credit costs below 0.5% for a decade and debt to tangible equity of 1.5 times at end-2025.AnnouncementReaction (next session, 16 Jun): T6I −0.5% · STI +0.8% · peers −4.0% · 0.5× median volumeSource: SGX announcement, 15 Jun 2026
These comparisons reuse evidence from other covered companies when a specific economic mechanism connects the source to this company; sector labels and apparent relatedness are not the test. Period, definition, geography, business mix and reporting perimeter are checked, and the external evidence remains a lead until this company's own disclosure confirms it.
Aspial Lifestyle — peer-perimeter caveat. Its nominee-book presentation explains why the reported leverage and asset-return ratios are not cleanly interchangeable.
Every other test on this page waits for the company to file. These do not. Each row is a series you can look up yourself, free, today — with the level this reading was built against, the levels that would put it in question, and what the series cannot tell you.
The current-SORA page; read the headline 3-month compounded figure and the quarter it is as of. Monetary Authority of Singapore, quarterly reading republished by Propkaki
Last recorded
1.06 %, 2026-06-30
What the reading assumes
1.2 % (approximate level at the last financial year end, mid-December 2025)
Watch / alert
2.2 and 3 %, on a move above — currently at or better than the level the reading assumed
How often to look
quarterly (the series prints quarterly)
What it points to. The asset yield is capped by statute while the funding side floats, so a rate rise lands entirely on the spread.
Direction only — this pack does not carry a coefficient from this series to reported earnings.
What it cannot tell you. It prices the floating and short-dated tranche only. The fixed-rate notes and any commercial paper already rolled are untouched until they mature, so a move here reaches the reported cost of funds gradually and partially.
Settled by FY2026 finance-cost note, due 2027-02-24. Lead time: one repricing quarter.
The headline gold price, in US dollars per troy ounce. It is an OTC/CFD market reference, not an official benchmark. Trading Economics (OTC/CFD market reference; LBMA benchmark averages used as the anchors)
3,432 and 2,386 US$/oz, on a move below — currently between the assumed level and the watch level
How often to look
monthly (the series prints daily)
What it points to. Gold sets the advance against a pledge, so it points to ticket size, book growth and the value of forfeited stock flowing into retail.
Direction only — this pack does not carry a coefficient from this series to reported earnings.
What it cannot tell you. Gold sets the size of the loan advanced against a pledge and the value of metal inventory; it does not set the number of pledges or the footfall through the shops. A rally alongside falling volumes can leave interest income flat. The level here is an OTC/CFD market reference, while the anchors are LBMA benchmark annual averages, so read the gap between them as approximate at the margin, never to the dollar.
Settled by FY2026 results and segment note, due 2027-02-24. Lead time: one pledge or stock cycle, roughly one to six months.
Watchlist reviewed on 2026-09-24; each observation has its own date above. This watchlist date does not change the company research cutoff. A series moving past a level is a reason to re-read the case, not a recommendation. The same series across every company covered: what you can watch.
Download
A print-ready PDF of this page, for reading away from the screen: ValueMax Group evidence library (PDF). It carries the same content as this page — what the company is, segment economics, the track record and earnings quality, funding, five years of cash, management and governance, five years of AGM minutes, the peer decomposition, the earnings drivers, defensiveness, growth attribution, the red-flags scorecard, the watch-list, the share price and cross-company read-throughs — and the same omissions: no rating, no fair value, no forecast.
Correction, 24 August 2026 — the peer decomposition. This table gave return on assets as attributable profit over period-end total assets: ValueMax 7.11%, MoneyMax 7.09%, and the text read that the two earn the same return on assets to within two basis points and that the entire ROE gap is leverage. That is one of four ways to build the ratio and the only one that puts ValueMax ahead. On average balances and total profit MoneyMax leads by 50 basis points; on the attributable-over-average basis now shown, by 19. The table also carried two further inconsistencies: its ROE row used period-end book while the ROA row used period-end assets against an averaged alternative, and its liabilities-to-equity row computed Aspial on a different rule from the other two. All rows are now on one convention, the three ratio rows multiply together exactly, and the chart has been rebuilt to match. Aspial, which the research pack drops for want of a filing, is computed from its own 1H2026 results. The finding was raised by a parallel review session and independently re-derived here from the three companies’ filings before being applied.
ValueMax annual reports FY2013–FY2025 and half-year filings 1H2022–1H2026 (SGX); IPO prospectus (21 Oct 2013); 5 Jun 2026 MTN Information Memorandum and programme-amendment announcement; Series 003 pricing supplement, pricing, closing, listing and corrigendum announcements; AGM, SIAS and SGX-query materials; Fitch rating action commentaries (15 Jun, 10 Jul 2026); Well Chip 2Q2026 and rights materials; Ministry of Law Registry of Pawnbrokers list as at 1 Aug 2026; Pawnbrokers Act 2015; MoneyMax and Aspial Lifestyle 1H2026 filings; company announcements per the source manifest; and dated press for event confirmation. Gaps named: verified committed-undrawn facilities, lender concentration, instrument-level monthly maturities, loan-cohort collections, Stage/DPD/NPL/LTV and recovery data. Research process is AI-assisted and source-controlled; load-bearing figures were re-verified against retained primary filings.
Corrections log. 16 Sep 2026: the FY2021 net-debt cell in §3 read S$427.9m; on the row’s own basis (total borrowings of S$442.569m less cash and bank balances of S$14.601m, both from the FY2021 annual report) it is S$428.0m. A rounding slip in one cell; FY2022 to 1H2026 were re-derived from the filings and are unchanged. 27 Aug 2026: projected financials had been published on this page and have been withdrawn — a forward gearing path, forward residual funding needs, a chart of projected revenue and PATMI, a chart of forward funding gaps, and the restatements of those figures in the watch-list and in this log. This site publishes the evidence and keeps the forward view behind the authenticated rated view; the material is held there, and the two forecast chart files have been removed from this page’s public chart directory. No as-filed figure was changed and no reported analysis was removed. 20 Aug 2026: integrated the equity and credit work, replaced the unsupported prior leverage path with the live model formulas, updated the share denominator, separated associate accrual from upstream cash, added the filed MTN covenants and legal triggers, and made the S$101.124m CFO classification sensitivity exact. A third-party FY2025 cash figure of S$122.4m was rejected against the official S$22.419m. 18 Aug 2026: corrected the source inventory — the June Information Memorandum and July pricing supplement are publicly filed — and withdrew the description of the 2029 notes as carrying a continuously observable live price because no executable secondary quote was verified. 16 Aug 2026: an earlier draft apportioned MoneyMax's Singapore pawn revenue at ~S$48m using its Malaysian profit share; the primary filing discloses Malaysian revenue of 14.1%, the split cannot be derived from the disclosure, and the estimate was withdrawn — replaced by the whole-group comparison in §7.
No proprietary rating, fair value, price target, expected return or recommendation is published here; the private credit conclusion is not distributed. Information cut-off 20 August 2026; issuer-filing sweep completed 26 August 2026 · Next scheduled update after FY2026 results (~24 Feb 2027) or on material announcement.
Reader questions & corrections
Ask about this company, challenge a source or suggest a factual correction. Only selected questions that SMID Research has reviewed and answered are published.
Submissions are private by default. Your email is encrypted and never published. Please do not send confidential or inside information, allegations about individuals, promotions, or requests for personalised investment advice.
Behind the lock
A private working view of this company exists beyond this page: the current integrated note and understanding sheet, together with the protected credit conclusion and review record. Superseded model, PDF and deck files are retained only as an audit archive. The private material is maintained for the author's own records — not published, and not available for sharing. This page carries everything that is public.
These bounded retrospective corrections clarify specific published facts or calculations. They retain each report's existing research cutoff and do not represent a full refresh or a finding that all possible issues are resolved.
ValueMax Group
Internal Inconsistency. Removing the S$101.124m operating inflow from reported CFO gives a hypothetical −S$134.968m; substituting the S$0.312m balance-sheet increase gives −S$134.656m. Source basis: existing published cash-flow and balance-sheet inputs. Limitation: These are classification sensitivities, not alternative issuer-reported CFO or proof of the correct accounting classification.
Internal Inconsistency. The week to 22 August 2025 had a negative 15.23-percentage-point residual, outside the stated four-point sector band. Its classification and explanation now agree. Source basis: published price-map return inputs and rule. Limitation: A residual does not identify the cause of a share-price move.
Transcripts
Find available event transcripts in the transcript library.
· VM20V613 - SGX Close Announcement — AI summary: Company raising S$29.76 million from the 3-month Series 020 Issuance · SGX
Titles are from the linked SGX filing, with common words abbreviated. Summaries are written by AI and may contain inaccuracies; refer to the original announcement. Items after 20 August 2026 are not reflected in this page's analysis; earlier items are listed for reference, may not be discussed in it, and may have been updated by later announcements.